Shouting at Memory: Where Did My Write Go?

Abstract
Non-Volatile Memory (NVM) promises persistent data, but verifying that promise on real hardware is challenging due to opaque caching and internal buffers like Intel’s WPQ, which obscure the true state of writes. Traditional validation methods often fall short. This paper introduces a novel perspective: leveraging the subtle timing variations of memory accesses as a direct probe into write persistence.
We present a software technique, inspired by echolocation, that uses high-resolution timers to measure memory load latencies. These timings act as distinct signatures (“echoes”) revealing whether a write’s data resides in volatile caches or has reached the NVM persistence domain. This offers a non-invasive method to track write progression towards durability.
To reliably interpret these potentially noisy timing signatures and systematically explore complex persistence behaviours, we integrate this echolocation probe into an active model learning framework. This synergy enables the automated inference of a system’s actual persistency semantics directly from black-box hardware observations. The approach is hardware-agnostic, adaptive, and scalable. Preliminary experiments on Intel x86 – a platform where persistence validation is notably challenged by the opaque Write Pending Queue (WPQ) – demonstrate the feasibility of our technique. We observed distinct latency clusters differentiating volatile cache accesses from those reaching the persistence domain. This combined approach offers a promising path towards robust and automated validation of NVM persistency across diverse architectures.
Keywords and phrases:
Persistency Memory Semantics, Fuzz Testing, Model LearningCategory:
Pearl/Brave New IdeaCopyright and License:
2012 ACM Subject Classification:
Software and its engineering Empirical software validationAcknowledgements:
Special thanks to Andy Rudoff, Non-Volatile Memory Software Architect at Intel Corporation, for his insightful input on the development of the read-after-write timestamps mechanism. Gratitude is also extended to Glynn Winskel for his thoughtful feedback on the application of Event Structures in the intricate domain of memory persistency.Editors:
Jonathan Aldrich and Alexandra SilvaSeries and Publisher:
1 Introduction
Non-volatile memory (NVM) combines the speed of RAM with persistent data retention, providing reliable storage that survives power outages. The write-handling mechanisms of NVM are captured by formal persistency models, such as Px86 for Intel x86 architectures [37] and PArm for ARM architectures [38]. These models aim to align with architectural specifications, guiding developers in programming for NVM. However, they often lack extensive empirical validation to confirm their real-world applicability.
Empirical validation serves two key purposes. First, it ensures hardware vendors adhere to specified standards – an area with historical inconsistencies [4, 2]. Second, it provides a benchmark for testing whether theoretical persistency models align with actual hardware behaviour. This process ensures that models reflect observable behaviours while avoiding those that cannot occur on real machines, thus maintaining both soundness and completeness.
Persistency correctness is not merely academic but critical for system reliability. In practical applications – financial services, healthcare, industrial automation – the failure to respect persistency guarantees can undermine system integrity. For example, in financial systems that rely on persistent storage, improper write ordering could violate transaction atomicity guarantees, potentially contributing to data inconsistencies if other safeguards fail. Healthcare systems with patient records might experience data loss or inconsistent state retrieval after power events. In safety-critical domains, such as automotive control systems, inconsistent recovery of calibration parameters or system state could lead to unpredictable behaviour during operation. While modern systems implement multiple layers of protection (transaction logs, checksums, reconciliation processes), the fundamental persistency guarantees of NVM serve as a critical foundation for these higher-level reliability mechanisms. Ensuring that persistency behaves as specified is therefore essential for building trustworthy systems across these domains.
Challenges in Validating Persistency Semantics.
Validating persistent memory semantics involves significant challenges. A naive approach might involve inducing program crashes by abruptly powering off the system and retrieving data from Non-Volatile Memory (NVM) upon restart. However, this method only reveals the most recent write, leaving the order of prior writes uncertain. Moreover, frequent power cycling is impractical for comprehensive testing, and scheduling precise crashes proves nearly impossible.
Memory bus interception methods also face limitations, particularly with Intel x86 architectures [25]. This arises from the unique data pathway in Intel x86, where data destined for memory first pass through a battery-backed buffer called the write-pending queue (WPQ) in the memory controller [40] (see Figure 1). Since bus intercept observations occur after data have left the processor, they fail to accurately reflect the true order of data persistence.
In the realm of memory consistency models, empirical validation is a well-established practice. Tools like litmus [5] execute small multi-threaded tests, known as litmus tests, on target machines to examine the visibility and sequencing of writes across threads. This helps clarify the visibility and sequencing of writes among threads. However, unlike memory consistency, a litmus-like approach to validating persistency is impractical, as programs cannot directly detect data persistence. Stores may reside in various locations, such as caches, the Write-Pending Queue (WPQ), host memory, or in Compute Express Link (CXL) devices.
Representing Behaviour for Validation.
Effectively validating NVM persistence – whether checking hardware compliance against specifications like Px86/PArm or diagnosing deviations – requires methods to precisely represent and compare expected versus observed behaviours. This involves capturing the complex interplay of concurrency, weak memory effects, and durability guarantees. While various formalisms exist for modelling concurrent systems (e.g., state machines, Petri nets [34], algebraic approaches [18]), representing the specific partial orders, fence semantics, and persistence states relevant to NVM validation poses unique challenges. Finding a formalism capable of clearly expressing both the specified model’s predictions and the potentially divergent behaviours observed on real hardware is crucial for building robust validation techniques. We discuss our choice of formalism, Event Structures [44], in Section 5.
Contributions.
Our work makes two key contributions:
-
1)
Introduction of Memory Echolocation Technique: We introduce memory echolocation, a conceptually architecture-agnostic timing analysis technique that uses instruction latencies to non-invasively infer store locations. By analysing retrieval times, this approach identifies distinct timing patterns corresponding to memory hierarchy levels (e.g., caches, WPQ, NVM), revealing write progression towards persistence. Its effectiveness is demonstrated on Intel x86, a challenging platform for validation.
-
2)
Model-Learning Framework Leveraging Echolocation: We propose a model-learning based validation framework that utilises memory echolocation (Contribution 1) for black-box observation. This framework enables the iterative refinement of persistency models based on observed timing data, facilitating scalable, adaptive, and more effective validation. It is grounded in Event Structures and incorporates persistency properties to accurately capture system behaviour.
2 Background
Non-Volatile Memory (NVM) technologies have introduced new challenges in the reliable management of persistent data. As NVMs retain data across power failures, system designers must ensure that updates to persistent state are crash-consistent – i.e., that data remains consistent even in the event of unexpected interruptions. Achieving this requires explicit reasoning about when writes leave volatile caches and become durable.
Modern architectures such as Intel-x86 and Arm support persistency through specialised instructions that transfer modified data from volatile cache layers to the persistent domain. These mechanisms enable fine-grained control over persist ordering, which is essential because contemporary processors employ multi-level caching for performance, decoupling program execution order from persistence visibility.
Illustrative Litmus Tests.
To enforce correct persistency semantics, both Intel-x86 and Arm provide architectural primitives that explicitly govern data flushes to the persistent domain. The examples in Litmus Tests 1 and 2 illustrate minimal persistency patterns: if a crash occurs after is assigned the value 1, then the programmer expects to have been persisted, thereby ruling out states where but .
upon recovery:
Intel-x86 Persistency Semantics.
The Intel-x86 persistency model is inherently buffered, allowing the persist order (the sequence in which writes are committed to persistent memory) to diverge from the coherence order (the sequence in which writes become visible to threads) [37]. For instance, in the sequence , recovery states after a crash may include , , or , but not , which contradicts the program order. This discrepancy arises due to reordering of persist operations.
Intel-x86 offers instructions such as to enforce persistence. This instruction flushes the cache line of to the persistence domain. Variants such as and provide similar guarantees with differing performance characteristics: retains the cache line, while evicts it. These are non-blocking operations; they trigger persistence asynchronously.
Arm Persistency Semantics.
The Arm architecture offers a comparable, though architecturally distinct, model [38, 15]. The instruction transfers data to the persistent domain, but requires a subsequent barrier to ensure visibility. These synchronisation mechanisms preserve persist order and enforce crash-consistency guarantees akin to those on Intel-x86, as demonstrated in Litmus Test 2.
Persistence Domains and Observability.
The scope of the persistence domain – that is, the part of the memory hierarchy where data is guaranteed to persist across power failures – is determined by hardware architecture. On Intel-x86 systems, writes are considered persistent once they reach the memory controller (MC), often equipped with battery-backed buffers. Enhanced ADR (eADR) extends this domain to include L2 and L3 caches [40], further decoupling program execution from persistence observability.
In contrast, Arm architectures maintain a more confined persistence domain, which does not extend to the memory controller, allowing for more direct and observable control over write persistence.
Black-Box Model Learning.
Validating persistency models requires a precise understanding of how write and flush operations interact under relaxed behaviours. However, target architectures often function as black boxes, concealing internal details such as persistence ordering and flush timing. These behaviours are instead inferred from observable outcomes of carefully orchestrated operation sequences.
Black-box model learning addresses this challenge by abstracting internal structures and focusing on input-output behaviours. This approach systematically issues crafted sequences of operations (e.g., writes, flushes) and observes the resulting persistence behaviour. Learning algorithms [6] iteratively construct state-transition models that approximate the system’s persistency semantics.
For persistency validation, these learned models reveal how writes propagate to the persistence domain under varying conditions, enabling the detection of inconsistencies or undocumented behaviours. By systematically testing even opaque architectures, black-box learning provides a rigorous framework for evaluating complex, poorly understood persistency mechanisms [32].
Event Structures for Modelling Concurrent Behaviour.
Persistent behaviours in concurrent programs are naturally expressed in terms of partial orders. Event Structures [44] offer a formal framework for modelling these behaviours. An event structure comprises a set of atomic events, a causality relation that expresses dependencies, and a conflict relation that defines mutual exclusions.
This representation is well-suited to reasoning about NVM persistency, which involves partially ordered interactions among writes, flushes, and fences. In this work, we adapt event structures to model the hypotheses explored during model learning. This enables precise specification and comparison of observed system behaviours with theoretical expectations. We present our specific adaptation of Event Structures for NVM persistency in Section 5.
3 Memory Echolocation
This section outlines a straightforward method for inferring store locations within the memory hierarchy, drawing metaphorical inspiration from the concept of echolocation. By leveraging timing analysis within the memory hierarchy, we can “map” where data is stored across different memory layers. By doing so, it avoids the need for intrusive approaches like crash-and-recovery, which disrupt system execution and involve directly inspecting memory contents.
3.1 Echolocation-Inspired Insight
Echolocation, as observed in nature, involves emitting a signal and interpreting its returning echoes to infer the spatial arrangement of the environment. Our methodology mirrors this approach in the context of memory systems. By performing a store operation, we create a disruption in the memory hierarchy – analogous to emitting a signal. Subsequently, retrieving this data produces measurable latencies, or “echoes”, that reveal the location and behaviour of the memory hierarchy components involved.
This analogy underscores the power of latency measurement as a diagnostic tool, revealing patterns of memory residency and transitions across architectural layers. The emitted “signal” in our case is the store operation, and the echoes are derived from the variability in memory access times observed during data retrieval.
3.2 Timing as a Mapping Tool
At the core of our approach is the precise measurement of memory access times. Once the initial store operation is performed, we measure the time required to fetch the data (Figure 2). These timing measurements serve as unique fingerprints of the specific memory layer where the data resides, offering a non-invasive mechanism to explore the memory hierarchy. For example:
-
Extremely low latencies indicate L1 cache residency.
-
Intermediate latencies may correspond to L2 or L3 caches.
-
Longer latencies often point to the Write Pending Queue (WPQ) or main memory (RAM).
-
In extended setups, latencies may also reveal accesses to emerging technologies like CXL-enabled memory.
Interpreting Latency Patterns.
By correlating these retrieval times with the hierarchical levels of the memory system – such as L1/L2/L3 caches, Write Pending Queue (WPQ), main memory (RAM) and CXL – we can deduce where the stored value resides within the memory architecture. Shorter access times indicate cache residency, while longer delays suggest data retrieval from deeper layers like WPQ or RAM. These timing-based observations serve as a guide to “echo-map” the memory hierarchy, pinpointing the location of stored data with high precision.
4 Learning Persistency Models
Validating persistency semantics in modern systems is a complex and dynamic task, largely due to the intricate interactions between memory management, concurrency, and system failures. As systems grow in complexity, the number of potential states they can reach also increases. Traditional validation methods often fail to capture the full spectrum of behaviours that can emerge under different conditions. This is particularly true when dealing with non-deterministic behaviours, such as those triggered by crashes, race conditions, and the failure-recovery processes that involve complex memory state transitions.
To address these challenges and ensure more comprehensive validation process for persistency semantics, we propose integrating model learning techniques. This approach leverages the dynamic interplay between a knowledgeable Persistency Learner and an informative oracle, enabling automated and optimised validation tasks in a black-box setting. The learner formulates hypotheses about the system’s persistency behaviour and tests them against the system through Membership Queries (MQ) and Equivalence Queries (EQ), receiving feedback from the oracle to validate or refine these hypotheses. This interactive, feedback-driven process enables the model to evolve continuously in real time, uncovering previously undetected edge cases, inconsistencies, and subtle aspects of persistency semantics that may have otherwise gone unnoticed.
4.1 Persistency Model Learning in Action
The interaction between the learner and the oracle follows a systematic cycle, illustrated in Figure 3. To explore this process, consider a program with two consecutive writes: followed by . Following a crash and recovery, the values of and may vary, and the state and could appear, even though this state is never observable during normal execution. This inconsistency presents an opportunity for the model learner to refine its hypothesis about write persistency.
To reason about the persistency of writes in this example, we use a toy model built around the concept of a persist buffer. This buffer serves as an abstraction that captures the intermediate state of writes that are not yet persisted but are still available within the volatile memory hierarchy. The model incorporates the following elements:
-
Writes: , where is the set of all writes executed by the program.
-
Program Order: The relation captures the sequential order of writes in , where means appears before in the program.
-
Persist Buffer: , the ordered sequence of writes currently in the persist buffer, where and if write occurs before in the order within the buffer.
-
Persistence States: A write can be in one of two states:
Alternatively, we may use to denote .
-
Buffer Transitions: A transition represents a change in the contents of the persist buffer when write occurs, resulting in a new buffer state . The exact transformation is defined by specific persistence rules.
-
Crash and Echo Recovery: represents a “soft crash” simulated using our non-invasive echolocation technique. Instead of a physical crash, this step involves probing the system using timed memory loads to infer the likely location (and thus persistence state) of relevant variables. It approximates the outcome of a crash-recovery cycle without disrupting the system. The specific mechanism for interpreting these probes is detailed in Section 6.
Initially, the model assumes that all writes are persisted immediately upon execution. This is captured by the following invariance rule for the persist buffer:
This simplistic assumption sets the stage for the learner to iterate and refine its understanding of the persistency model. The learning process unfolds as follows, with the numbering matching that in Figure 3:
-
1.
Initial Hypothesis: The learner begins with the simplest hypothesis, assuming immediate persistence. This predicts and post-crash. The hypothesis is submitted as an Equivalence Query (EQ) to the oracle, which tests it against the actual System Under Learning (SUL).
-
2.
Targeted Test Case Generation: To refine its understanding, the learner generates a test case (a Membership Query, MQ) to probe the system’s crash recovery behaviour. The test involves executing a sequence of operations followed by the echolocation probe:
The effectiveness of echolocation hinges on using carefully constructed, simple test cases like . For validating persistency semantics, we employ litmus tests which are kept intentionally small, typically involving only a few memory accesses and persistence-related instructions (flushes, fences). The echolocation probe () is strategically placed after the sequence of operations whose outcome needs assessment, representing the timed load measurements for relevant variables (here, and ). Complexity in these test cases must be minimised to avoid introducing extraneous micro-architectural effects that could obscure the primary latency signal related to data location. Echolocation is therefore suited for targeted microbenchmarks designed to probe specific persistency interactions, not for direct timing analysis within complex application code.
The test case is submitted as an MQ to observe the actual system behaviour as interpreted through the echolocation probe.
-
3.
Oracle Feedback: The oracle executes the MQ on the SUL. Using the probe mechanism (detailed in Section 6), it determines the persistence state of the variables. Suppose the oracle concludes from the probes that was non-persistent at the time of the simulated crash, while was persistent. This translates to an observed ’recovered’ state of , which contradicts the learner’s initial hypothesis. This counterexample (the test trace and its observed outcome) is returned to the learner.
-
4.
Discrepancy Analysis and Model Refinement: The learner revises its hypothesis to account for asynchronous persistence, acknowledging that writes pass through the persist buffer before being persisted, with reordering possible. The updated rule is expressed as follows:
This rule accounts for the transient nature of writes in the persist buffer, allowing them to remain temporarily before being committed to persistent storage, with the persistence order potentially non-deterministic.
To accommodate controlled operations that enforce the immediate persistence of specific writes, the model is further refined with a dedicated rule for explicit flushes: -
5.
Iterative Hypothesis Testing: The learner continues generating test cases (MQs or as part of EQs) to challenge the updated model. For instance:
This test case examines whether the system flushes to persistent memory before the write to occurs. If the probe (following ) leads the oracle to conclude that is persistent but is not, the inferred recovered state would be .
4.2 Algorithmic Implementation of Persistency Learning
Algorithm 3 outlines the iterative learning process at a high level, highlighting the roles of Membership Queries (MQs), Equivalence Queries (EQs), and the echolocation probe (). The algorithm addresses several practical considerations in model learning. It establishes explicit termination conditions through and parameters. This ensures the learning process eventually terminates, even when a perfect model cannot be achieved due to system complexity or non-determinism. The tracking provides a quantitative measure of model quality, calculated as the proportion of test cases where the model’s predictions differ from observed outcomes. Central to our approach is the , which serves as a structured knowledge repository mapping test sequences to their observed outcomes. This table plays a crucial role in both generating test sequences for equivalence queries and constructing refined hypothesis models. The learning process has two distinct phases:
-
1.
Equivalence Query Phase: The algorithm generates test sequences based on the current hypothesis and observation history. Each test is augmented with the echolocation probe and executed on the System Under Learning. Discrepancies between predicted and observed outcomes are collected as counterexamples. If no counterexamples are found, the current hypothesis is accepted as equivalent to the target model.
-
2.
Hypothesis Refinement Phase: When counterexamples are found, the algorithm selects the most informative one to guide the generation of targeted membership queries. These queries explore specific aspects of the system’s behaviour revealed by the counterexample. Results from these queries update the observation table, which is then used to construct a new hypothesis model.
The maintains rich state, tracking the abstract persist buffer content and the status of writes ( or ). The and represent the inferred set of persisted variable states (e.g., ) after a test sequence. The refinement process involves updating ’s internal representation of buffering and persistence rules based on the observed outcomes stored in the observation table. This algorithm strikes a balance between theoretical soundness and practical applicability, accommodating the inherent challenges in learning models of complex persistency semantics in real-world systems.
5 Modelling Formalism
To formally model the complex interactions between concurrency, memory consistency, and NVM persistence guarantees, we adopt Event Structures [44]. This formalism provides a natural and expressive framework well-suited to the challenges of reasoning about persistency semantics, as detailed below.
5.1 Rationale for Choosing Event Structures
Event Structures [44] provide a principled foundation for modelling persistency for several key reasons:
True Concurrency and Causal Dependencies.
Unlike interleaving models that artificially serialise concurrent operations, Event Structures directly represent concurrency through partial orders (causality) and mutual exclusion (conflict). This approach naturally captures non-total orderings inherent in weak memory models, particularly the complex interactions between memory operations, flushes, and fences in persistent memory systems.
Explicit Persistency Constraints.
The core relations in event structures – causality, conflict, and concurrency – provide a natural framework for encoding the fine-grained behaviours specific to non-volatile memory systems. Causal dependencies represent ordering enforced by barriers, while conflict relations precisely capture requirements such as write persistence ordering (e.g., the “sfence” or dependent flush111“Dependent flush” refers to the common pattern where the persistence guarantee of an asynchronous flush like CLFLUSHOPT or CLWB is made effective relative to subsequent code via an ordering instruction like SFENCE.), preventing executions that violate persistence rules.
Compositionality.
Persistency guarantees operate at multiple levels of abstraction. Event Structures support modular reasoning, allowing models of individual instructions or components to be composed without needing a monolithic global state representation. This compositionality is essential for scaling verification to complex systems.
Leveraging these strengths, the next section provides our customised definition of Persistent Event Structures, tailored to the specifics of NVM operations and drawing parallels to concrete instruction sets like Intel x86 where relevant.
5.2 Persistent Event Structures
Definition 1 (Persistent Event Structure).
A persistent event structure for a program over a set of persistent memory locations and values is defined as a tuple: , where:
-
is a finite set of events representing atomic memory operations;
-
is a set of threads, each executing a sequence of events;
-
maps each event to its issuing thread;
-
is the program order, a disjoint union of strict total orders on events within each thread. Specifically, for any , if , then , meaning both events occur within the same thread. This relation enforces a sequential ordering of events within each thread.
-
is the happens-before relation, a partial order (transitive, irreflexive, and antisymmetric) that extends program order () and captures synchronisation effects across threads;
-
is the conflict relation, which captures mutual exclusivity between events that cannot occur together in the same execution due to resource contention (such as conflicting reads or writes to the same variable). The relation is irreflexive, symmetric and upward-closed with respect to happens-before order: .
-
is the resulting-from relation, where means that the value read by event was written by event . This relation links each read operation to the specific write that provided its value.
-
labels each event with a memory operation from alphabet .
The alphabet of memory operations is structured hierarchically:
-
1.
Basic Memory Operations:
-
Initialisation Operation , representing the initialisation of all locations in persistent memory appeared in the program, typically setting them to 0.
-
Read Operations , where denotes reading the value from .
-
Write Operations , where denotes writing to , and represents the initialisation of all locations to zero. All writes are durable, meaning their effects may be observed after system recovery.
-
Read-Modify-Write Operations denotes atomic updates to using the function . These operations atomically read the value of , modify it using , and write the result back to , ensuring no interference from other threads during execution. Common atomic operations in Intel architectures include:
-
–
lock xadd: Atomic fetch-and-add. Adds a value to and returns its previous value.
-
–
lock cmpxchg: Atomic compare-and-swap. Compares with a specified operand and updates if they match.
-
–
lock or/and: Atomic bitwise OR/AND. Performs a bitwise OR/AND operation on .
-
–
lock add: Atomic addition. Adds a value to and stores the result atomically.
-
–
-
-
2.
Synchronisation Operations:
-
Memory Fence ensures all preceding memory operations (loads and stores) complete before any subsequent ones. In Intel architectures, this is enforced via the MFENCE instruction.
-
Store Fence guarantees that all previous store operations complete before any subsequent stores. This is implemented in Intel architectures via the SFENCE instruction.
-
-
3.
Persistency Operations:
-
Regular Flush writes back the cache line containing to memory, ensuring that all pending writes to that cache line are asynchronously persisted. In Intel architectures, this is implemented via the CLFLUSH instruction.
-
Optimised Flush also flushes the cache line containing . However, it imposes different ordering constraints: a operation is ordered only with respect to earlier writes to the same cache line; in contrast, a operation is ordered with respect to all writes, regardless of their cache line. In Intel architectures, this functionality is provided by the CLFLUSHOPT instruction.
-
Write Back behaves like but provides better performance; both persist the cache line of , but invalidates it, whereas may retain it for reuse. Implemented in Intel architectures via the ‘CLWB‘ instruction.
-
We define as the subset of writes that have reached persistent memory. The initialisation is always persistent: .
The complete event alphabet is therefore:
Refining the previously defined resulting-from relation over the event alphabet, we have:
meaning:
-
justifies reading zero from any location ;
-
a write of to justifies reading from .
A refinement of the program order is the adjacent program order relation, , which captures the adjacency of events within the same thread. Formally, it is defined as:
In other words, two events and are adjacent in the program order if there is no event such that except for and themselves.
Events that are neither ordered by happens-before nor in conflict are considered concurrent. To formally capture the independence of events across different threads, we define the concurrency relation, denoted , as follows:
The following example illustrates the application of event structures in this context.
Illustrative Example.
Consider two concurrent processes, and (Figure 4), running on an Intel x86 architecture and interacting with the shared variable ingredients.
A natural expectation is that if ready_to_cook is true, then ingredients should be 2. However, due to the buffered persistence model of Px86, a crash and recovery may result in a state where ready_to_cook true persists while ingredients 2 does not.
The instruction clflushopt ingredients invalidates the cache line containing ingredients across the coherence domain, ensuring all cores either discard or update the cached copy. However, it does not enforce immediate persistence and may be reordered with later stores. Because of this, it is possible for the following sequence of events to occur:
-
1.
writes 1 followed by 2, but these updates remain in the cache and have not yet persisted.
-
2.
reads ingredients = 2, sets the local variable check_ingredients to 2, and subsequently ready_to_cook true, with the latter being successfully persisted to memory.
-
3.
Before executes clflushopt ingredients, the system crashes. As a result, the persistent state upon recovery can have:222Upon recovery, the possible values are: , which accounts for all potential states.
(1) contradicting the program’s expected logic: .
This counterintuitive behaviour can, however, be avoided by using the stricter clflush instruction instead of clflushopt, as clflush prevents reordering with respect to any writes.
Representing persistent program behaviour with Event Structures. The semantics of a persistent event structure can be visualised using a directed acyclic graph. In the program shown in Figure 4, each instruction is mapped to a modelled action, highlighted next to it. These actions represent reads, writes and flushes in the program. Figure 5 (left) depicts the semantics of the concurrent execution of and as an event structure graph, where solid edges show happens-before order, dashed edges indicate resulted-from, and saw-like edges denote conflicts. When the right thread reads the value 2 from ingredients, which was written by the left thread , passes a message to . Under the Intel-x86 architecture, message passing ensures that the instruction writing the message () is executed and ordered before the corresponding read instruction () in . This ordering is implicitly captured by the resulted-from relation, which links reads to their corresponding writes.
Replacing flushopt with flush enforces a stricter happens-before ordering by introducing an additional edge from flush to . As a result, this guarantees that whenever is executed, has already been persisted.
5.3 Alloy Encoding
We encode the semantics of persistent event structures using the Alloy modelling language [20], a declarative framework that expresses systems as relational structures. This encoding facilitates the analysis of program behaviour under diverse memory access patterns. The model is structured into a set of entities, each representing a distinct aspect of memory semantics. Figure 6 illustrates the hierarchical relationships between these entities and their interconnections within the event structure. The corresponding Alloy code defining these entities is provided in Listing 1.
In Alloy, memory events are defined as signatures, introducing new types in the model. The Event signature serves as the supertype, with specialised event types extending it via the extends keyword. Events are structured through relations that link their attributes to other entities (e.g., ) or within the same entity (e.g., ). These relationships are further constrained using facts – axiomatic formulae that Alloy assumes to be always true, shaping the space of possible examples and counterexamples generated by the Alloy analyser. For instance, to enforce that the relation adjacent program order (adj_po) applies only within the same thread, the following fact is defined:
To illustrate how our Alloy model is executed to generate concrete instances, consider the following predicate, volatile. It expresses conditions under which a write w could be considered volatile when event e occurs. The Alloy analyser systematically explores the model to find instances satisfying this predicate, revealing concrete memory event orderings that meet these constraints.
By executing Alloy’s run command with this predicate, we generate concrete executions that reveal scenarios where a write remains volatile. The analyser constructs instances that adhere to the specified constraints. One such instance, discussed in Figure 5, satisfies the volatile predicate and can be obtained by executing the following command, which explores possible executions within a bounded model of 7 events, 2 threads, and 3 memory locations:
6 Implementation and Feasibility Demonstration
As a foundational step, we developed a time-based measurement framework designed to explore memory access patterns, inspired by echolocation principles. This initial framework leverages high-resolution timestamps to analyse memory fetch latencies, enabling the identification of subtle timing variations. Central to this is the CPU’s Time Stamp Counter (TSC), which provides the high-resolution timings necessary to observe micro-level memory access variations.
6.1 Measurement Technique
Our preliminary implementation, used to generate the latency data shown in Figure 7 and Table 1, employs a microbenchmark written in C (available at DOI 10.5281/zenodo.15045528). The core measurement technique involves timing individual memory load operations using the TSC. Specifically, we utilise the rdtscp 333Read Time-Stamp Counter and Processor ID is an assembly instruction available on x86 processors that retrieves the current value of the CPU’s time-stamp counter (TSC) along with the processor ID. This instruction offers a high-resolution timing mechanism often used for performance monitoring and benchmarking, and is partially serializing. instruction, accessed via inline assembly, to obtain cycle counts immediately before and after the target memory load operation (e.g., sum += array[i] in our benchmark code).
To prevent the compiler from optimising away the timed memory load, the target memory array (array) and the variable accumulating the result (sum) are declared volatile. Memory for the array is allocated using posix_memalign to ensure 64-byte alignment, minimising potential variations due to unaligned accesses.
The elapsed cycle count (end cycles - start cycles) for each load is then converted into nanoseconds. This conversion uses the CPU’s clock frequency, which is determined dynamically at the start of the benchmark by parsing the ’cpu MHz’ field from /proc/cpuinfo on the Linux test system. We acknowledge this frequency detection method is specific to the Linux environment.
In the specific experiment designed to populate the latency distribution (Figure 7), each timed load access to an array element array[i] was preceded by a write to that element and an explicit clflush instruction (also invoked via inline assembly) targeting its cache line. This was done to ensure that the subsequent timed load would likely fetch data from deeper levels of the memory hierarchy (e.g., L3, WPQ, DRAM) rather than potentially hitting in L1/L2 caches, allowing us to observe the full spectrum of access latencies. The benchmark performs numerous such timed accesses across a large memory region and repeats the entire measurement process multiple times. Individual nanosecond latency measurements are recorded (written to a CSV file in our implementation) to allow for detailed statistical analysis and visualization.
6.2 Feasibility Results
Our tests, carried out on an Intel® Xeon® E-2286G CPU (4.00 GHz, 14 cores) running Linux kernel version 4.18.0 on Red Hat Enterprise Linux 8, demonstrated that we could differentiate memory access latencies across various hierarchical levels based on these measurements. In Figure 7, we present a distribution plot based on approximately 25 million memory fetch operations. The observed latencies ranged from as low as 15 ns for the fastest L1 cache to up to 10,000 ns for the slowest swapped memory on disk. The vertical axis represents the order in which these memory accesses occurred, serving only to visualise the distribution of memory accesses across the entire dataset.
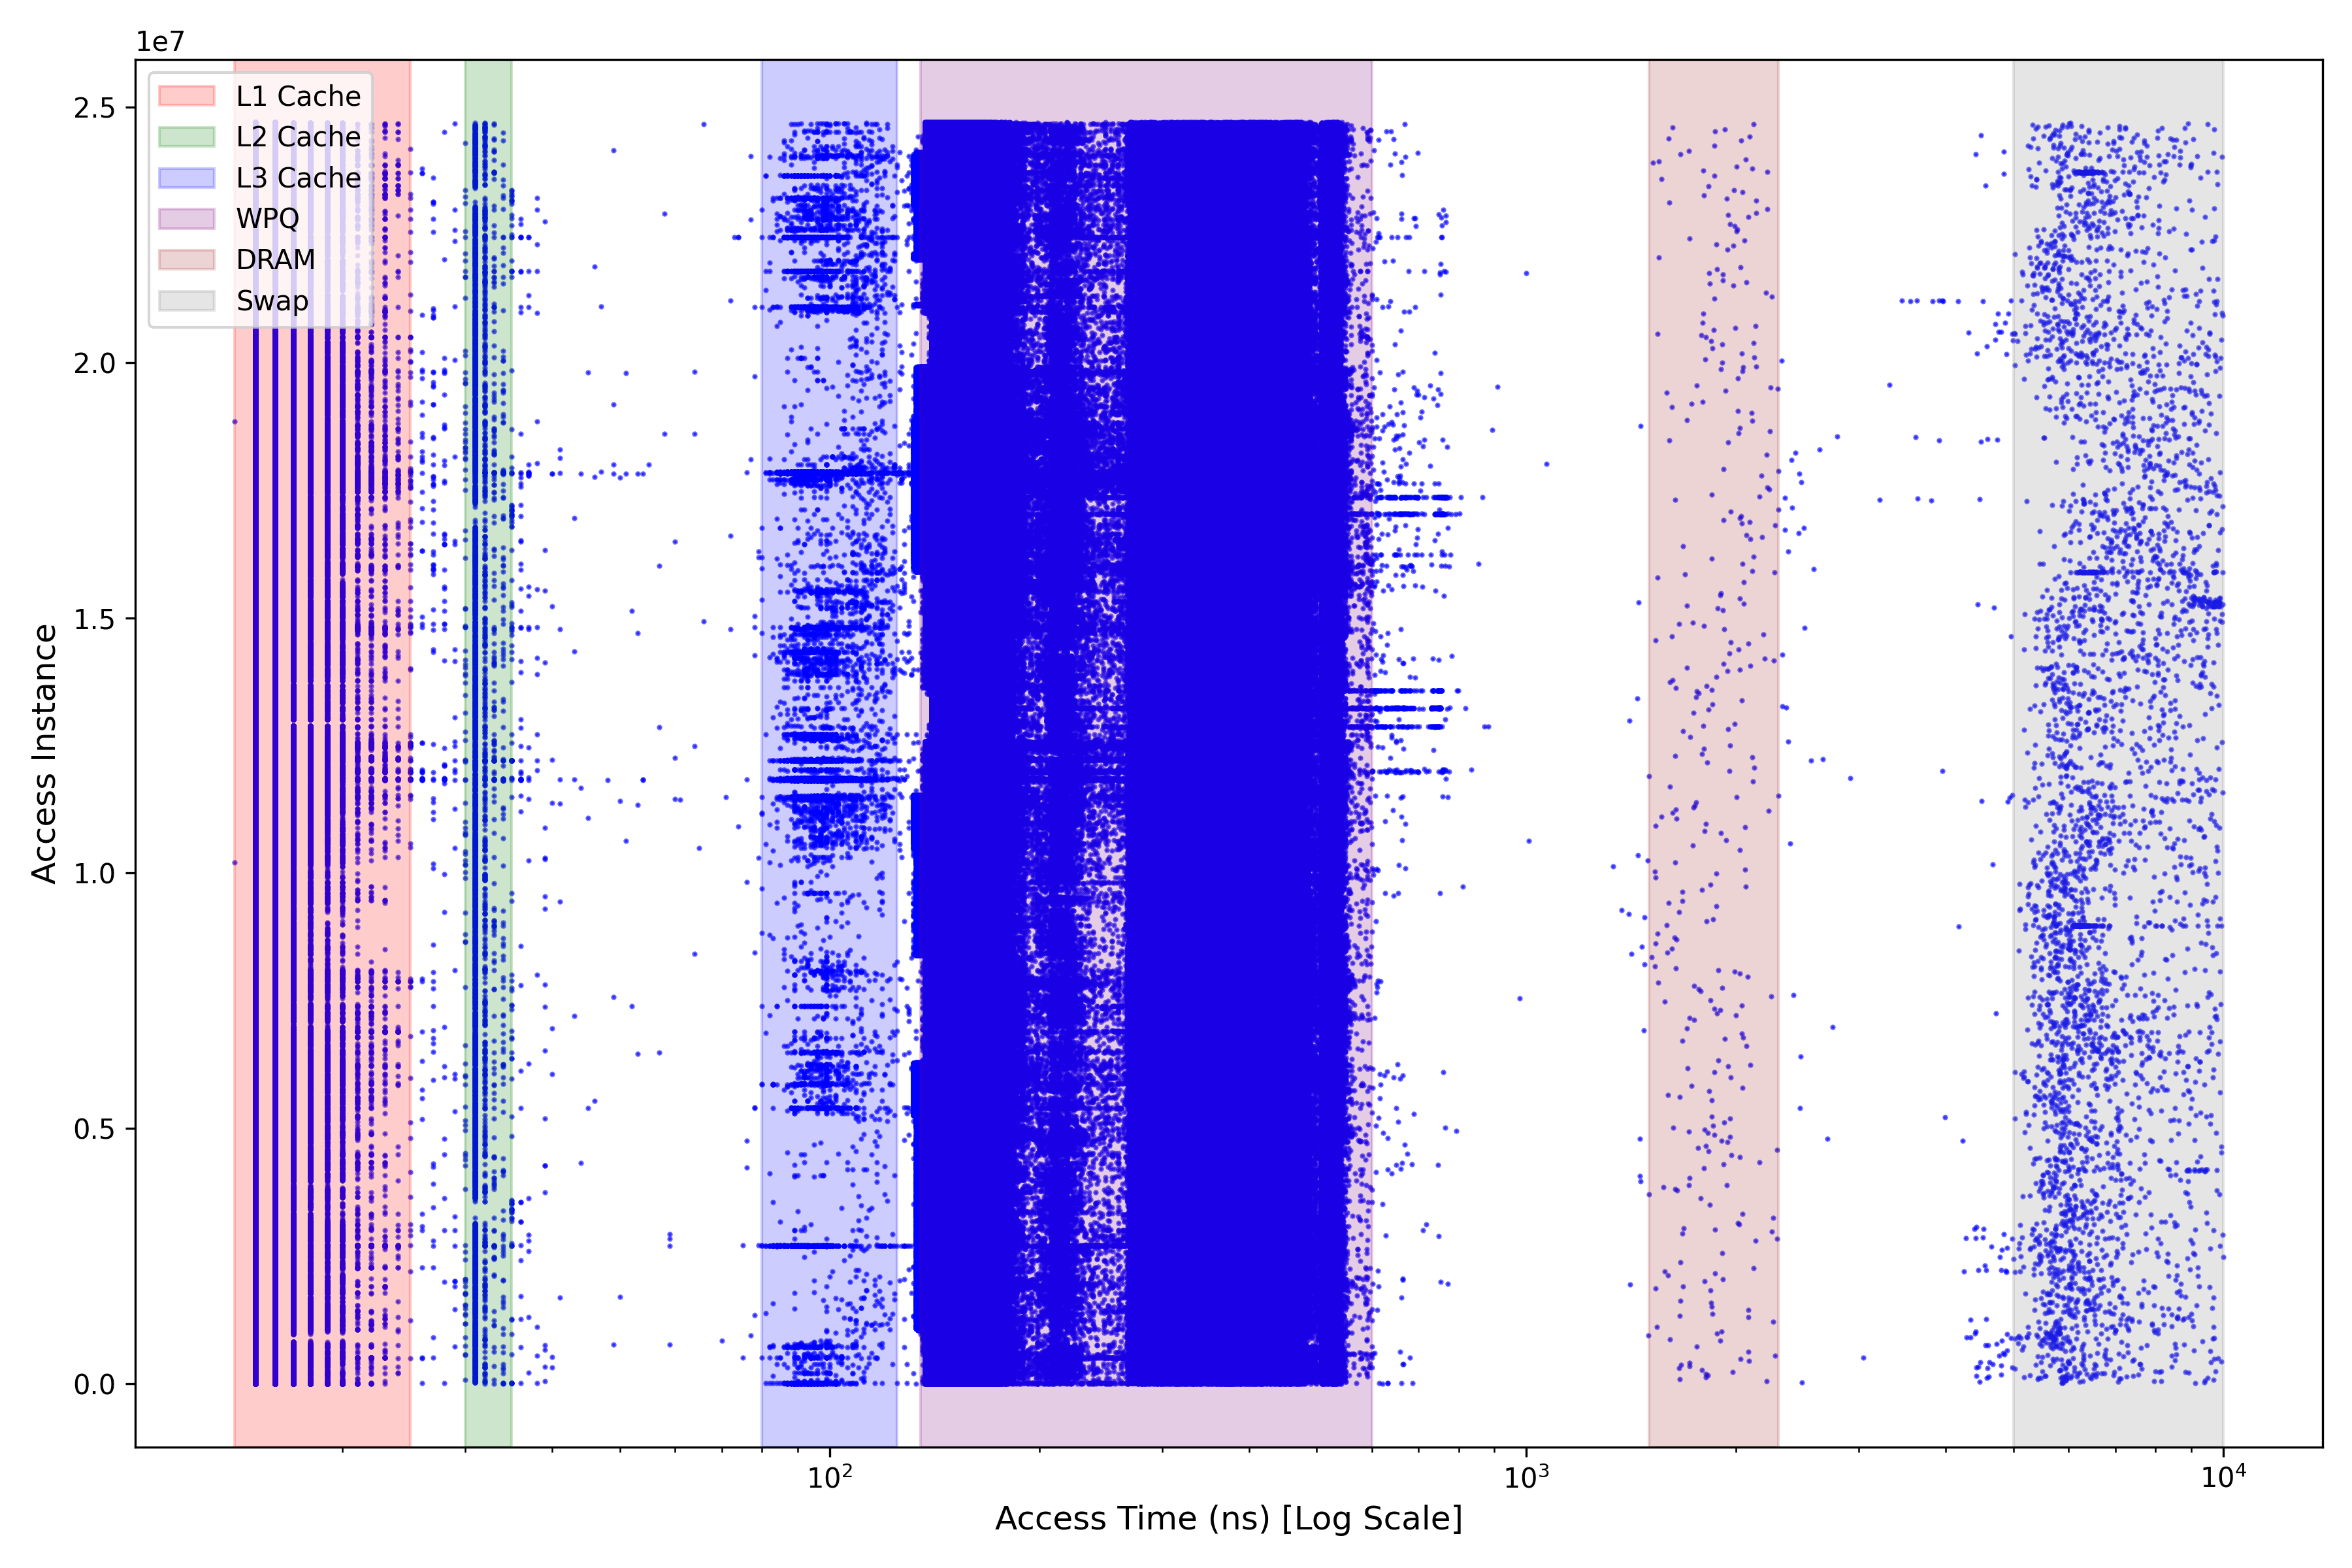
The fetch latencies are clearly segmented into six distinct zones, as highlighted by the shaded regions in the plot and detailed with range values in Table 1. These zones correspond to the hierarchical memory locations of the test system: L1 cache, L2 cache, L3 cache, Write Pending Queue (WPQ), DRAM, and swapped memory. This clear segmentation suggests the potential of our approach in profiling memory access patterns and indicates the reliability of timestamp-based latency measurements for inferring data location.
When measuring memory fetch latencies, the elapsed time includes not only the pure data fetch duration but also several overheads. These include the time required to issue the memory access command, the execution time of the memory access instruction itself, and the small but consistent cost of retrieving timestamps using the rdtscp instruction. Additionally, micro-architectural factors, such as cache coherence traffic, prefetcher activity, pipeline effects, resource contention, or cache invalidation caused by instructions like clflush, can contribute noise to the measured time. While these overheads and noise sources are present in the absolute measurements, they often remain relatively consistent or manifest as outliers across different fetches under controlled conditions.
For our purpose, which is to differentiate memory access locations within the hierarchy (e.g., cache, write pending queue, DRAM), the absolute latencies are less significant than the relative differences and distinct clusters observed between fetch times originating from different levels (Figure 7). These large differences tend to cancel out fixed overheads, allowing us to reliably identify the memory hierarchy level from which the data is being fetched based on its characteristic latency range. This approach ensures that variations in fetch latencies used for inference are primarily attributable to the memory location itself rather than extraneous factors, although careful statistical analysis and threshold selection (see Section 8) are needed to handle ambiguity.
6.3 Application to Persistence Validation
The core idea of using echolocation for validation is to map the measured memory load latencies, discussed in the previous subsection, to an inferred persistence state for a given write. This allows us to approximate the outcome of a crash-recovery cycle non-invasively.
Definition 2 (Inferred Persistence State from Latency).
Let be the latency measured by the echolocation probe for write . Let be the experimentally determined minimum latency threshold indicating entry into the persistence domain, derived from the observed latency ranges (Table 1). On our test machine, ns, corresponding to the lower bound of WPQ access times. We define the inferred persistence state function as:
Crucially, to mitigate potential misinterpretation due to measurement noise near the threshold (as discussed in Section 8), we adopt a conservative approach when selecting : it is aligned with the upper bound of non-persistent latency clusters plus a safety margin. This prioritises soundness (avoiding false positives for persistence). The oracle function within the model learning algorithm (Algorithm 3) uses this mapping , based on the conservatively chosen , to determine the definitive or state contributing to the from the raw latencies measured during the step.
With this mapping (Definition 2) established, we can validate correctness conditions required after a potential crash. For example, consider the litmus test from Figure 4 and its instrumented version in Figure 8. The expected post-crash condition is:
| (2) |
Validation of this condition relies on determining the state of ready_to_cook after the program sequence. Our approach uses the probe (executed after the write ready_to_cook == true in Figure 8) to measure . The Oracle then applies Definition 2:
and the condition (Equation 2) must hold for the validation to pass. Figure 8 illustrates how this check, driven by the echolocation-derived status, is conceptually embedded in the validation logic.
This implementation demonstrating the echolocation probe and its application concept represents a foundational step. As discussed in Section 10, future work involves implementing the full model learning framework and extending validation to more complex scenarios and diverse hardware.
7 Scope and Applicability
The previous sections introduced memory echolocation as a technique for non-invasively probing data location within the memory hierarchy (Section 6) and framed its use within a model learning cycle for validating persistency semantics (Section 4). This combined approach aims to provide a more robust, adaptable, and hardware-agnostic methodology compared to existing techniques. This section discusses the broader scope and applicability of this approach, particularly concerning different hardware architectures and potential extensions.
Hardware Agnosticism and Generality.
A key advantage of our proposed methodology lies in its software-based nature. Unlike hardware bus interception methods, which require physical probes, platform-specific knowledge, and may be hindered by component integration (e.g., on SoCs) or internal buffering (like Intel’s WPQ), echolocation relies solely on timing standard memory access instructions. This makes the fundamental probing technique portable across any architecture that provides a sufficiently high-resolution timer accessible from software (such as the TSC on x86, or equivalent counters on ARM, RISC-V, etc.). When coupled with the black-box model learning framework, which adapts based on observed outcomes, the overall approach offers a path towards a unified validation framework applicable across diverse hardware platforms, reducing the need for architecture-specific tooling.
Applicability to ARM Systems.
While the challenge of the WPQ makes software-based validation particularly appealing for Intel x86, the echolocation technique offers significant advantages for ARM architectures as well:
-
Non-Invasiveness and Accessibility: Echolocation avoids the cost, complexity, and potential physical impossibility of hardware bus probing, which is especially relevant for highly integrated ARM-based Systems-on-Chip (SoCs) commonly found in mobile, embedded, or IoT devices where physical access might be limited or impractical.
-
Unified Methodology: It provides the same validation methodology used for other architectures, simplifying cross-platform testing, comparison, and tool development, rather than requiring different approaches (e.g., software for x86, hardware probes for ARM).
-
Future-Proofing: As ARM architectures evolve, particularly in server or high-performance domains, they may incorporate more complex cache hierarchies, memory controllers with internal buffering, or technologies like CXL, potentially obscuring the exact persistence boundary from external probes, similar to the WPQ issue. Echolocation, being software-based, remains applicable regardless of these internal complexities.
-
Complementary Insights: Even on ARM systems where bus snooping might be feasible, echolocation provides timing data reflecting the state before data necessarily reaches an externally snoopable point. This can offer complementary insights into buffering or ordering effects internal to the CPU core, cache hierarchy, or SoC interconnect.
Therefore, the motivation for using echolocation on ARM extends beyond merely bypassing a WPQ-like issue; its non-invasiveness, generality, and accessibility make it a valuable tool for validating persistency on these platforms.
Synergy of Echolocation and Model Learning.
The proposed approach leverages the synergy between the two techniques. Echolocation provides the fine-grained, albeit potentially noisy, observational data about memory state transitions without system disruption. Model learning provides the structured framework (inspired by , as discussed in Section 4) to systematically generate test cases (MQs, EQs), interpret the noisy observations from echolocation within the context of a hypothesis, identify discrepancies, and iteratively refine a model of the system’s actual persistency behaviour. This allows for uncovering subtle or undocumented behaviours that might be missed by static analysis or purely hardware-based methods.
Potential for Broader Application.
While this paper focuses on validating NVM persistency semantics, the underlying principles might be adaptable. The ability to infer data location in the memory hierarchy via timing could potentially be applied to study cache behaviour, coherence protocol actions, or even aspects of memory consistency, although these applications would require careful calibration, different instrumentation strategies, and potentially more sophisticated analysis techniques to deconvolve timing effects. These remain interesting avenues for future exploration.
Despite its promise, this methodology is not without challenges. The accuracy of echolocation can be affected by micro-architectural noise, and the completeness of model learning depends on the quality of test generation and the ability to explore relevant system states. The next section delves into these potential threats to validation and outlines mitigation strategies.
8 Threats to Validation
The proposed validation approach applies echolocation and model learning to systematically analyse persistency semantics. While promising, its robustness, accuracy, and generality must be scrutinised to strengthen its credibility.
8.1 Accuracy of Echolocation as a Proxy for Crash Behaviours
Echolocation is used to approximate memory access patterns occurring during recovery by analysing write echo times. As demonstrated in Figure 7, the access time zones are generally well-segmented for different memory regions. However, very few access times fall ambiguously between these zones, making it difficult to assign them definitively to a specific storage hierarchy. Such ambiguities may lead to misinterpretations of persistency behaviours.
Mitigation.
To resolve this, we propose a two-pronged approach. First, outlier detection methods, such as the Local Outlier Factor (LOF) [11], can identify and potentially filter anomalous access times likely caused by transient system noise, improving the clarity of latency clusters. Second, to directly address the ambiguity of times falling near zone boundaries, we adopt the conservative threshold selection strategy detailed in Definition 2. By setting the persistence threshold based on the upper bound of non-persistent levels plus a margin, we explicitly trade off potentially missing some borderline persisted writes (completeness) for increased confidence that inferred persistence is correct (soundness), thus minimising misinterpretations arising from ambiguous timings.
8.2 Coverage of System States and Edge Cases
While the proposed validation approach uses model learning to penetrate the actual system and explore edge cases, some rare or complex execution paths, particularly those that are non-deterministic or timing-dependent, may remain untested, leading to incomplete coverage and potentially missing subtle persistency behaviours.
Mitigation.
Our chosen modelling language, Alloy [20], helps mitigate coverage gaps through its exhaustive analysis within bounded scopes. By encoding the persistency semantics (including timing-related constraints where possible via ordering relations) derived from our model learning, Alloy can explore potential interleavings and states, including those leading to non-deterministic outcomes. Its relational logic is adept at exploring configurations that might expose subtle bugs related to concurrency or complex interactions, complementing the execution-based approach of model learning. Prior work [16, 38, 37, 24] confirms its utility in finding subtle memory model issues. Furthermore, the iterative nature of both Alloy model refinement (reacting to discrepancies found during validation) and the overarching model learning cycle (Section 4) helps systematically expand coverage as inconsistencies are uncovered and the model of system behaviour improves.
8.3 Assumptions in the Initial Model Hypothesis
The model learning process, as discussed in Section 4.1, begins with a simplistic initial hypothesis. While this serves as a foundation for systematic refinement, it may inadvertently introduce constraints or assumptions that bias subsequent learning steps. Such biases could narrow the exploration of the state space, leading to an incomplete or inaccurate understanding of the system’s persistency semantics.
Mitigation.
To minimise initial hypothesis bias, we adopt several strategies. First, the learning process can be initiated with different starting assumptions beyond simple immediate persistence (e.g., hypotheses incorporating relaxed ordering, different buffering behaviours). Second, we explicitly leverage existing formal persistency models from the literature (e.g., Px86 [37], PArm [38]) as initial hypotheses or baselines for comparison during the learning process on relevant platforms. This provides both a sanity check and ensures our learned models are contextualised against established specifications, adding rigor to the validation of our assumptions and conclusions.
Addressing these threats is crucial for realising the full potential of this validation approach. By systematically mitigating these risks, the methodology can be refined to deliver robust insights into persistency semantics across diverse systems.
9 Related Work
Memory Consistency Model Validation.
Significant research has focused on empirically validating memory consistency models across architectures such as x86 [5, 41], IBM Power [39], and Arm [3], as well as GPUs [2] and hybrid CPU/FPGA systems [19]. Recent work extends these models to support features like virtual memory [42] and non-temporal accesses [36]. Traditional multi-threaded validation methods, while effective for consistency, struggle to validate persistency models, as they cannot distinguish between data retrieved from volatile caches and persistent memory.
Testing Persistent Programs.
Tools such as PMTest [29], Pmemcheck [23], and PMAT [22] test persistent programs by embedding assertions to validate memory persistency guarantees dynamically. XFDetector [28] addresses pre- and post-crash instruction interactions, while PMFuzz [27] generates test cases to maximise path coverage, focusing on persistency-related operations. These tools generally rely on vendor-provided architectural specifications to evaluate whether a program violates persistency guarantees.
Event Structures for Modelling Relaxed Memory.
The use of Event Structures (ES) to model systems with relaxed memory ordering guarantees has gained significant attention in recent research [21, 13, 35, 14]. These studies highlight the adaptability of ES in reasoning about concurrency, demonstrating their ability to effectively capture the complexities of weak-memory models across a wide range of architectures and scenarios.
Active Model Learning.
Several algorithms have been proposed for learning models across different types of automata, as explored in various studies [7, 1, 10, 12, 31, 17]. These algorithms can extend their capabilities to learning models of complex, distributed systems, including assemblies of communicating automata [9]. The versatility of these approaches makes them well-suited for testing intricate systems and ensuring the accuracy of persistency models.
Timing-Based Inference.
Several studies have leveraged hardware performance counters to track memory access locality, primarily in DRAM [33, 8, 30, 26]. Our memory echolocation technique shares closer methodological similarities with CacheQuery [43], which employs timing-based measurements to detect cache side-channel vulnerabilities. However, our approach differs fundamentally in both objective and execution. While CacheQuery focuses on cache hierarchies to uncover security weaknesses, we extend timing-based inference to persistent memory systems, specifically analysing persistency properties rather than information leakage. Moreover, our method accounts for system-specific variations in persistence behaviour across different architectures, addressing challenges such as write-back buffers, ADR domains, and persistence ordering guarantees – factors beyond CacheQuery’s security-oriented scope.
10 Conclusion and Future Work
This paper introduced a software-centric methodology aimed at overcoming persistent challenges in validating NVM semantics on real hardware. Our proposed approach uniquely combines fine-grained memory access timing analysis (echolocation) with the structured exploration capabilities of active model learning. We presented the core echolocation technique, demonstrating experimentally on an Intel x86 platform its feasibility for non-invasively distinguishing memory hierarchy levels, including the NVM persistence domain, based on load latency signatures. Furthermore, we outlined how these timing probes serve as the essential black-box observation mechanism within a proposed model learning framework, enabling the automated inference of persistency behaviours. While the full integration of the learning component remains future work, this synergistic approach, conceptually underpinned by Event Structures, represents a promising direction towards scalable, adaptive, and hardware-agnostic NVM validation.
10.1 Future Work
Adaptive Echolocation: Enhancing Robustness and Accuracy.
As highlighted in our discussion of threats (Section 8), precise analysis using echolocation is complicated by inherent noise in modern systems arising from OS jitter, concurrent processes, architectural variability, micro-architectural interference (e.g., prefetchers, coherence traffic), and even thermal effects. To address this, future work will explore adaptive algorithms capable of dynamically adjusting to system state and filtering noise during real-time latency interpretation. Techniques potentially include online statistical filtering, change point detection, or lightweight machine learning models trained to recognise characteristic latency patterns amidst noise. The goal is to significantly improve the accuracy and reliability of inferred persistence states across diverse architectures, including complex emerging systems incorporating technologies like CXL-attached memory. Successfully learning distinctive latency patterns under varying conditions will enhance data residency detection, identify performance anomalies, and allow more confident prediction of memory state transitions.
Learning Event Structure Models of Persistency.
Building on our proposed formalisation using Event Structures (Section 5), a key next step is developing algorithms to automatically infer these structures from echolocation observations. The input would consist of execution traces (sequences of operations generated by the learner) paired with their outcomes (inferred persistence states of relevant variables) obtained via the echolocation probe. The core challenge is to learn the specific causal () and conflict (#) relations that accurately model the target system’s possibly undocumented or non-deterministic NVM persistency behaviour.
In conclusion, while the proposed approach represents a promising step forward in persistency validation, it is important to acknowledge that it is not a catch-all solution. The complexity and variability of memory subsystems pose ongoing challenges. Continued research will be essential to refining coverage of dynamic memory conditions beyond our current scope.
11 Data Availability Statement
The Alloy model discussed in Section 5.3, along with instructions for running it, is available on Zenodo ( ). Additionally, we provide the fetch latencies plotted in Figure 7, along with the C script used to obtain them.
References
- [1] Fides Aarts and Frits Vaandrager. Learning I/O Automata. In CONCUR 2010 - Concurrency Theory, 2010.
- [2] Jade Alglave, Mark Batty, Alastair F. Donaldson, Ganesh Gopalakrishnan, Jeroen Ketema, Daniel Poetzl, Tyler Sorensen, and John Wickerson. GPU concurrency: Weak behaviours and programming assumptions. In ASPLOS, 2015.
- [3] Jade Alglave, Will Deacon, Richard Grisenthwaite, Antoine Hacquard, and Luc Maranget. Armed cats: Formal concurrency modelling at arm. ACM Trans. Program. Lang. Syst., 2021. doi:10.1145/3458926.
- [4] Jade Alglave, Luc Maranget, Susmit Sarkar, and Peter Sewell. Fences in weak memory models. In Computer Aided Verification, 2010.
- [5] Jade Alglave, Luc Maranget, Susmit Sarkar, and Peter Sewell. Litmus: Running tests against hardware. In Tools and Algorithms for the Construction and Analysis of Systems, 2011.
- [6] Dana Angluin. Learning Regular Sets from Queries and Counterexamples. Inf. Comput., 1987. doi:10.1016/0890-5401(87)90052-6.
- [7] Dana Angluin and Miklós Csundefinedrös. Learning Markov Chains with Variable Memory Length from Noisy Output. In COLT, 1997.
- [8] Zelalem Birhanu Aweke, Salessawi Ferede Yitbarek, Rui Qiao, Reetuparna Das, Matthew Hicks, Yossi Oren, and Todd Austin. Anvil: Software-based protection against next-generation rowhammer attacks. In Proceedings of the Twenty-First International Conference on Architectural Support for Programming Languages and Operating Systems (ASPLOS), 2016.
- [9] B. Bollig, M. Leucker, J. Katoen, and C. Kern. Learning Communicating Automata from MSCs. IEEE Transactions on Software Engineering, 2010.
- [10] Benedikt Bollig, Peter Habermehl, Martin Leucker, and Benjamin Monmege. A Fresh Approach to Learning Register Automata. In DLT, 2013.
- [11] Markus M. Breunig, Hans-Peter Kriegel, Raymond T. Ng, and Jörg Sander. Lof: identifying density-based local outliers. In Proceedings of the 2000 ACM SIGMOD International Conference on Management of Data, 2000.
- [12] Sofia Cassel, Falk Howar, Bengt Jonsson, and Bernhard Steffen. Active Learning for Extended Finite State Machines. Form. Asp. Comput., 2016.
- [13] Simon Castellan. Weak memory models using event structures. In Vingt-septièmes Journées Francophones des Langages Applicatifs (JFLA 2016), 2016.
- [14] Soham Chakraborty and Viktor Vafeiadis. Grounding thin-air reads with event structures. Proc. ACM Program. Lang., 3(POPL), 2019. doi:10.1145/3290383.
- [15] Kyeongmin Cho, Sung-Hwan Lee, Azalea Raad, and Jeehoon Kang. Revamping hardware persistency models: View-based and axiomatic persistency models for intel-x86 and armv8. In PLDI, 2021.
- [16] Nathan Chong, Tyler Sorensen, and John Wickerson. The semantics of transactions and weak memory in x86, Power, ARM, and C++. In PLDI, 2018.
- [17] Samuel Drews and Loris D’Antoni. Learning Symbolic Automata. In TACAS, 2017.
- [18] C. A. R. Tony Hoare, Bernhard Möller, Georg Struth, and Ian Wehrman. Concurrent Kleene Algebra. In CONCUR, 2009.
- [19] Dan Iorga, Alastair F. Donaldson, Tyler Sorensen, and John Wickerson. The semantics of shared memory in intel CPU/FPGA systems. Proc. ACM Program. Lang., 5(OOPSLA), 2021. doi:10.1145/3485497.
- [20] Daniel Jackson. Alloy: a language and tool for exploring software designs. Commun. ACM, 2019. DOI: 10.1145/3338843. doi:10.1145/3338843.
- [21] Alan Jeffrey and James Riely. On thin air reads towards an event structures model of relaxed memory. In Proceedings of the 31st Annual ACM/IEEE Symposium on Logic in Computer Science (LICS), 2016.
- [22] Louis Jenkins and Michael L. Scott. Persistent memory analysis tool (PMAT). In 11th Annual Non-Volatile Memories Workshop, 2020. URL: https://louisjenkinscs.github.io/publications/PMAT_EA.pdf.
- [23] Tomasz Kapela. An introduction to pmemcheck, 2015. URL: https://pmem.io/blog/2015/07/an-introduction-to-pmemcheck-part-1-basics/.
- [24] Vasileios Klimis, Jack Clark, Alan Baker, David Neto, John Wickerson, and Alastair F. Donaldson. Taking back control in an intermediate representation for gpu computing. Proc. ACM Program. Lang., 7(POPL), 2023. doi:10.1145/3571253.
- [25] Vasileios Klimis, Alastair F. Donaldson, Viktor Vafeiadis, John Wickerson, and Azalea Raad. Challenges in Empirically Testing Memory Persistency Models. In ICSE-NIER, 2024.
- [26] Moritz Lipp, Daniel Gruss, Raphael Spreitzer, Clémentine Maurice, and Stefan Mangard. Armageddon: cache attacks on mobile devices. In Proceedings of the 25th USENIX Conference on Security Symposium (SEC), 2016.
- [27] Sihang Liu, Suyash Mahar, Baishakhi Ray, and Samira Manabi Khan. Pmfuzz: test case generation for persistent memory programs. In ASPLOS, 2021.
- [28] Sihang Liu, Korakit Seemakhupt, Yizhou Wei, Thomas F. Wenisch, Aasheesh Kolli, and Samira Manabi Khan. Cross-failure bug detection in persistent memory programs. In ASPLOS, 2020.
- [29] Sihang Liu, Yizhou Wei, Jishen Zhao, Aasheesh Kolli, and Samira Manabi Khan. Pmtest: A fast and flexible testing framework for persistent memory programs. In ASPLOS, 2019.
- [30] Robert Martin, John Demme, and Simha Sethumadhavan. Timewarp: rethinking timekeeping and performance monitoring mechanisms to mitigate side-channel attacks. In Proceedings of the 39th Annual International Symposium on Computer Architecture (ISCA), 2012.
- [31] Joshua Moerman, Matteo Sammartino, Alexandra Silva, Bartek Klin, and Michał Szynwelski. Learning Nominal Automata. In POPL, 2017.
- [32] Doron Peled, Moshe Y. Vardi, and Mihalis Yannakakis. Black box checking. J. Autom. Lang. Comb., 2001.
- [33] Peter Pessl, Daniel Gruss, Clémentine Maurice, Michael Schwarz, and Stefan Mangard. DRAMA: Exploiting DRAM addressing for Cross-CPU attacks. In 25th USENIX Security Symposium (USENIX Security 16), pages 565–581, Austin, TX, August 2016. USENIX Association. URL: https://www.usenix.org/conference/usenixsecurity16/technical-sessions/presentation/pessl.
- [34] Carl Petri and Wolfgang Reisig. Petri net, 2008. DOI: 10.4249/scholarpedia.6477. doi:10.4249/SCHOLARPEDIA.6477.
- [35] Jean Pichon-Pharabod and Peter Sewell. A concurrency semantics for relaxed atomics that permits optimisation and avoids thin-air executions. SIGPLAN Not., 2016.
- [36] Azalea Raad, Luc Maranget, and Viktor Vafeiadis. Extending intel-x86 consistency and persistency: formalising the semantics of intel-x86 memory types and non-temporal stores. Proc. ACM Program. Lang., 6(POPL), 2022. doi:10.1145/3498683.
- [37] Azalea Raad, John Wickerson, Gil Neiger, and Viktor Vafeiadis. Persistency semantics of the intel-x86 architecture. Proc. ACM Program. Lang., 4(POPL), 2020. doi:10.1145/3371079.
- [38] Azalea Raad, John Wickerson, and Viktor Vafeiadis. Weak persistency semantics from the ground up: formalising the persistency semantics of armv8 and transactional models. Proc. ACM Program. Lang., 3(OOPSLA), 2019. doi:10.1145/3360561.
- [39] Susmit Sarkar, Peter Sewell, Jade Alglave, Luc Maranget, and Derek Williams. Understanding POWER multiprocessors. In PLDI, 2011.
- [40] Steve Scargall. Persistent memory architecture. In Programming Persistent Memory: A Comprehensive Guide for Developers, pages 11–30. Apress, 2020.
- [41] Peter Sewell, Susmit Sarkar, Scott Owens, Francesco Zappa Nardelli, and Magnus O. Myreen. x86-TSO: a rigorous and usable programmer’s model for x86 multiprocessors. Commun. ACM, 53(7), 2010. doi:10.1145/1785414.1785443.
- [42] Ben Simner, Alasdair Armstrong, Jean Pichon-Pharabod, Christopher Pulte, Richard Grisenthwaite, and Peter Sewell. Relaxed virtual memory in armv8-a. In ESOP, 2022.
- [43] Pepe Vila, Pierre Ganty, Marco Guarnieri, and Boris Köpf. Cachequery: learning replacement policies from hardware caches. In Proceedings of the 41st ACM SIGPLAN Conference on Programming Language Design and Implementation (PLDI), 2020.
- [44] Glynn Winskel. Event structures. In Proceedings of an Advanced Course on Petri Nets: Central Models and Their Properties, Advances in Petri Nets 1986-Part II, 1986.