Real-Time System Evaluation Techniques:
A Systematic Mapping Study

Abstract
A systematic mapping study assesses a broad selection of research publications with the aim of categorizing them according to a research question. We present the first systematic mapping study on evaluation practices within the field of real-time systems, by analyzing publications from the top three conferences ECRTS, RTAS, and RTSS from 2017 until 2024. Our study provides a comprehensive view on the evaluation practices prevalent in our community, including benchmark software, task set and graph generators, case studies, industrial challenges, and custom solutions.
Based on our study, we construct and publish a dataset enabling quantitative analysis of evaluation practices within the real-time systems community.
Our analysis indicates shortcomings in current practice: custom case studies are abundant, while industrial challenges have very minor impact. Reproducibility has only been shown for a small subset of evaluations and there is no indication of change. Adoption of new and improved tools and benchmarks is very slow or even non-existent.
Evaluation must not be viewed as an obligation when publishing a paper, but as a key element in ensuring practicability, comparability, and reproducibility. Based on our study, we conclude that our community currently falls short on these objectives.
Keywords and phrases:
Systematic Mapping Study, Real-Time Systems, EvaluationCopyright and License:
2012 ACM Subject Classification:
Computer systems organization Real-time systemsSupplementary Material:
Dataset (CSV File, Python Script): https://github.com/TilmannUnte/ecrts2025-systematic-mapping-study/releases/tag/ecrts2025 [21]archived at
Acknowledgements:
We want to thank Marcus Völp for insightful commentary and critique from an outside perspective on a draft version of this paper.Funding:
This work was partially funded by the German Federal Ministry for Economic Affairs and Climate Action (BMWK) under grant number 01MN23013F - TwinSpace.Editors:
Renato MancusoSeries and Publisher:
1 Introduction
Evaluation is a key component of scientific publications. The intended goal of researchers conducting an evaluation, is to show the practical applicability or efficiency of the proposed theoretical model. Ideally, all scientific results are replicable, which means the theoretical model holds true in every valid scenario. Researchers should also ensure that all their evaluations are reproducible, i.e. the same result is achieved if the same conditions are met. To be reproducible an evaluation must be accessible by third party researchers to verify and potentially build upon it.
Practical evaluations are found in almost every publication within the real-time systems research community and there are many ways to ensure practicability, comparability, and reproducibility. For example, industrial challenges offer a realistic and universal case study, benchmark software provides a common ground for competing approaches, and artifact evaluation processes ensure that the evaluation is accessible and can be reproduced.
In this paper we provide a quantitative analysis of the evaluation practices within the real-time systems research community. This analysis is conducted on a dataset based on papers published at the three top conferences ECRTS, RTAS, and RTSS between 2017 and 2024. The analysis methods and dataset are published as supplementary material alongside this paper.
Our dataset is constructed by conducting a systematic mapping study. Systematic mapping studies are defined by Kitchenham et al. [17] as studies assessing a broad selection of publications with the aim of categorizing them based on a quantifiable research question. They are contrasted by systematic reviews, in which, typically, a small(er) selection of publications are analyzed in depth, with a much more narrow focus. Although both techniques are common in many fields of research, they are not yet common in the field of real-time systems. We have thus taken the guidelines on how to conduct a systematic mapping study [19] from the field of software engineering.
The objectives of our study are to:
-
Define and categorize the evaluation practices used in real-time systems research
-
Determine relative popularity of these practices and identify de-facto standards
-
Quantify the reproducibility of evaluations
-
Identify potential shortcomings in current evaluation practices
Related Work
One example of a systematic mapping study in the field of embedded systems research is presented by Haghighatkhah et al. in [15]. In contrast to our work, their study was concerned with one specific field within embedded systems research, namely automotive software. Narrowing down on this specific field proved challenging, as automotive vehicles are systems-of-systems and because different communities may use different terminology to describe the same underlying concepts. In this paper we consider a much more broad overview, in the sense that we want to capture all fields of real-time systems research. This includes real-time embedded systems, but we disregard embedded systems research outside this context.
There are numerous instances of novel evaluation tools being produced specifically for real-time systems research. These publications include a short overview of prior work and how it relates to the new tool being proposed. One example is the random task set generator Dirichlet–Rescale [11], which improves upon RandFixSum [8] and UUniFast–Discard [6]. Another example is the benchmark suite TACLeBench [9], which builds upon the Mälardalen benchmarks [13]. These publications only consider one approach to evaluation, namely task set generators or benchmarks, but they do not give an overview of various evaluation approaches combined. To the best of our knowledge, this is the first publication concerned with providing such a broad overview within the real-time systems research community.
Further, we have not found any other instance of a systematic mapping study within this community.
2 Categorizing and Differentiating Evaluation Practices
Almost all papers in our study contain a practical evaluation section. In these sections, the authors construct one or more scenarios in which experiments are conducted. A large variety of software tools, benchmarks, and reference material is used to build these scenarios. Therefore, we collectively call them components. As we are conducting a quantitative analysis, we are not concerned with how a component is being applied within a scenario, only whether it is being applied at all. For example, the task set generator UUniFast could be used in various configurations within a single evaluation to construct task sets with varying number of tasks and system utilization. However, we only focus on whether the component UUniFast is being used at all.
2.1 Categories of Evaluation Components
Components are grouped into categories, e.g. UUniFast is an example of a task set generator. In this section we define the categories of components we want to differentiate, roughly ordered from least to highest degree of design complexity:
- Microbenchmarks.
-
In our study, we use microbenchmark to refer to components with the following criteria:
-
custom made (not a benchmark suite)
-
manually made (not using a generator)
-
simplistic design (not a case study)
We use this term even when a component is not specifically referred to as a microbenchmark, but otherwise follows the above criteria. Microbenchmarks are applied to test basic functionalities or provide insights into extra-functional properties, such as memory access times. They are generally not published and do not carry a unique name.
-
- Benchmarks.
-
Benchmarks are generic example applications, often publicly distributed in larger collections with unique names. We also consider the following criteria:
-
not custom made (as opposed to a microbenchmark)
-
finalized example applications (as opposed to output of a generator)
-
generic system design (as opposed to a case study)
Individual benchmark programs may range from trivial to very high complexity. This is not considered in our categorization. We find that benchmarks can easily be told apart from microbenchmarks and case studies by how they are constructed and distributed.
-
- X Generators.
-
A generator is a tool which randomly produces a desired kind of output X, in which case we categorize it as an X generator. For example, in real-time systems research, it is common to use task set generators and graph generators. We have also seen specialized network traffic generators. These components follow these criteria:
-
automatically generated output (as opposed to manually made)
-
output lacks design goal (as opposed to a case study)
Besides using de-facto standard generators with recognizable names, many researchers also implement custom X generators, which may never be published or have a name.
-
- Specifications.
-
A specification is a collection of extra-functional properties derived from real systems. These are used as reference material to construct a scenario. They are differentiated further by not fitting into any of the other categories presented here:
-
not an application (as opposed to (micro-)benchmarks)
-
not generated, but may be used with a generator
-
not a case study, but may be used to construct a case study
-
- Case Studies.
-
Case studies consider complete exemplary systems with the following criteria:
-
can typically be assigned to a field of study
-
designed with intent (as opposed to generated)
-
non-trivial design (as opposed to (micro-)benchmarks)
Case studies are typically not generic, but instead exist within a field of study, e.g. the automotive field. Commonly, researchers set up their own systems to construct a realistic scenario, which we consider to be a custom case study. But a case study can also be directly taken from an industrial challenge. We group all kinds case studies based on their field of study.
Sometimes case studies are directly based on various pieces of open source software. However, a deeper look into the underlying design choices of case studies is out of scope for this paper. Again, we are only focusing on whether case studies are being used at all.
-
In Table 1 we provide the categories of a subset of components from our results. All of the components shown here are popular within real-time systems research and in fact, most of them originated there. Among the examples are several benchmark suites and common generators, for task sets and graphs respectively. If a paper is found to use UUniFast, it can be grouped with others papers using UUniFast, but also with other papers using any kind of task set generator.
IsolBench is a special case worth exploring in more detail: It is a very small benchmark suite with the highly specialized purpose of maximizing interference on multi-core systems. As such, it is to be expected that IsolBench is not used alone, but always in conjunction with other components with which it interferes. Since we are only interested at looking into which components are being used at all, we will not take into account how IsolBench is being combined with other components. We will only provide the complete list of components used per paper.
Real-World Automotive Benchmarks For Free (RWABFF) [18] has been categorized as a specification. In this paper, the authors provide insights into the extra-functional properties of automotive software. No benchmarks and no generator are provided.
| Category | Name | Comments | |||||
| Benchmark | Mälardalen [13] | C benchmarks, licensing issues [9] | |||||
| TACLeBench [9] |
|
||||||
| MiBench [14] |
|
||||||
|
|
||||||
| EEMBC Autobench [3] | Commercial license | ||||||
| IsolBench [22] |
|
||||||
| Task Set Generator | UUniFast [5] | Targets single-cores | |||||
| UUniFast–Discard [6] | Inefficient multi–core support [8] | ||||||
| RandFixSum [8] | Limited multi-core support [11] | ||||||
| Dirichlet–Rescale [11] | State-of-the-art multi-core support | ||||||
| Graph Generator | Erdös–Renyi |
|
|||||
| Specification |
|
|
2.2 Properties of Evaluation Components
Above we have already introduced two optional properties for any given evaluation components: a name and a field of study. Names are easily recognizable and an ideal candidate for our systematic mapping study. The field of study is not as explicit and will need to be determined subjectively. Nonetheless, it is an important characteristic to determine research trends over the years.
Some components, particularly case studies, are characterized by restricted access, i.e. a contractual non-disclosure agreement has been reached between researchers and a third party which sets limitations for distribution. However, if a component merely requires commercial of the shelf products, either hardware or software, we do not consider it to have access restrictions.
2.3 Artifact Evaluation
Many publication sites now optionally offer artifact evaluation. If authors opt in, their papers are not just assessed based on their contents. Additionally, the experiments are being retraced by at least one reviewer who gains access to the tools and systems used by the authors, which are collectively referred to as an artifact. This way, reproducibility is guaranteed in the review process. Papers which underwent artifact evaluation stand out as they receive a seal on their first page. Authors may choose to publish the artifact alongside the paper, which allows any readers to reproduce the results themselves.
However, there are cases in which artifact evaluation is infeasible. For example, in the field of real-time systems it is common that an evaluation scenario uses specialized hardware or commercial software, which may not be immediately available to any of the reviewers.
We assess the prevalence of both artifact evaluation and the public availability of artifacts. For our study, it is an important distinction that artifact evaluation cannot be attributed to components, but instead only to a paper.
3 Methodology
In this section we take a step-by-step look at every part of the process of our systematic mapping study. We start with defining a search space as well as in- and exclusion criteria. Next, we describe our process to categorize individual papers and to produce and verify the final dataset.
3.1 Selected Conferences
The international real-time systems research community is organized around three major conferences: ECRTS, RTAS, and RTSS. We conduct our study on papers from these conferences released between 2017 and 2024.
To support our selection, we have looked at TACLeBench [9], a benchmark suite for real-time systems research from 2016, close to the start of our considered time frame. In November 2023 we conducted a Google Scholar search to list the publications which have cited the TACLeBench paper and we grouped them by their publication sites.
Table 2 provides a subset of our top search results. We list the names of the publication sites according to the amount of citations of the TACLeBench paper in descending order. We also list the corresponding conference ranking according to CORE [1] and Qualis [2]. CORE uses the ranks A*, A, B, C, listed from excellent to satisfactory. Qualis uses A1 to A4, B1 to B4, and C. The shown ranks are the most recent at time of writing. Our selected conferences are top results in our search and highly regarded in both rankings throughout the entire time frame of our study.
There are several more conferences and journals which do not focus on real-time systems primarily, which we exclude and have omitted from the table. Further, we exclude conferences which have never received a CORE rank of A* or A within our time frame, namely ISORC and RTCSA. RTNS shows up high in the list, however CORE excludes it as a national conference and we have therefore excluded it as well. Journals, such as TECS, publish extended versions of papers previously seen at conferences. Extended papers include the same evaluations as prior publications. We want to avoid double-counting the exact same evaluation and therefore journals are excluded.
Another top contributor to the citations of TACLeBench is the WCET workshop. We have excluded workshops from our search space, as some workshop papers have been followed up with an extended conference paper. This carries the same double-counting risk as seen with journals.
| Publication Site | Citations (11/2023) | Qualis (2021) [2] | CORE (2023) [1] |
| ECRTS | 13 | A3 | B |
| RTAS | 10 | A2 | A |
| WCET | 9 | – | – |
| RTSS | 9 | A3 | A* |
| RTNS | 8 | – | National |
| ISORC | 6 | A4 | C |
| TECS | 6 | – | – |
| RTCSA | 5 | A3 | B |
3.2 Paper Exclusion Criteria
The selected conferences sometimes publish preliminary works or industry papers as part of their proceedings. Preliminary papers are excluded from further analysis to avoid double-counting of the same evaluation. Industry papers are excluded as our interest goes out to the methods and techniques used by researchers to evaluate real-time systems. Papers were excluded based on these keywords in their titles: Work-in-Progress, Work in Progress, Brief Industry Paper, Demo, Demo Abstract, Industrial Challenge.
ECRTS does not publish preliminary papers as part of the proceedings, but does offer separate tracks for them, such as the real-time pitches session. Separate tracks are not considered in our search space.
In Table 3 we break down how many papers per conference and year have been included or excluded, based on the above criteria. In total, we evaluate 677 papers for our systematic mapping study.
| Year | ECRTS | RTAS | RTSS | |||
| Included | Excluded | Included | Excluded | Included | Excluded | |
| 2017 | 26 | 0 | 29 | 11 | 32 | 13 |
| 2018 | 26 | 0 | 27 | 7 | 38 | 14 |
| 2019 | 27 | 0 | 30 | 0 | 41 | 23 |
| 2020 | 24 | 0 | 29 | 0 | 30 | 13 |
| 2021 | 16 | 0 | 31 | 29 | 39 | 13 |
| 2022 | 19 | 1 | 22 | 8 | 37 | 10 |
| 2023 | 19 | 0 | 25 | 8 | 32 | 10 |
| 2024 | 17 | 0 | 29 | 6 | 32 | 10 |
| 677 | 174 | 222 | 281 | |||
3.3 Evaluation Process
The papers were individually read and categorized. This process was set up in multiple phases: In the first phase the evaluation components were collected in human-readable format, inadequate for automated processing. From this first rough draft, we constructed a data layout which represents our findings according to the categories we introduced in Section 2.1.
We determined that a paper can use any number of evaluation components. A component is not necessarily limited to a single experiment. Sometimes it can serve for many experiments, other times multiple components must be combined for a single experiment. We abstract the number of experiments and the design of the underlying scenarios entirely and instead only pay attention to which components are used at all.
Each evaluation component is characterized by up to five data points:
- Qualifier.
-
The qualifier describes how the component is introduced. Viable options are: named, extended, referenced, custom, undetermined.
- Category.
-
The category which the applied component can be assigned to. We consider the categories defined in Section 2.1.
- Specifier.
-
If a component has a name, we store it in the specifier. In some cases, we use unique identifiers as placeholders for missing names. Otherwise the specifier remains empty.
- Field.
-
If a component applies to a specific (as opposed to generic) field of real-time systems research, it is stored here. Otherwise the field remains empty.
- Restricted?
-
In contrast to the other options, this one does not contain descriptors, but is instead a binary decision. If we are certain that the component has access restrictions (as defined in Section 2.2), this is set to true, otherwise it is false.
With the final data layout prepared, the first data set was cleaned and each component was re-evaluated. In a separate process, we analyzed whether the papers in the search space underwent artifact evaluation as part of their reviewing process, and whether the artifacts are publicly available. The format of our data set is represented by the layout shown in Table 4, alongside complete data for two example papers from the dataset. The two papers were selected for their simple, yet representative data points.
For each paper, the following data points are collected first: the conference name, the year of publication, the author name(s), and the title of the paper.
Further classification follows the flowchart shown in Figure 1. In stark contrast to the previous data points, the classification based on the flowchart is up to interpretation. Despite our efforts to delineate clear categories, edge cases may occur.
In the following, we walk through the decision points shown in Figure 1 and highlight some of the challenges we have met during the process.
- Does the paper feature an evaluation?
-
Some papers in our search space do not have an evaluation at all. These include surveys and papers of theoretical nature which present mathematical proofs.
For our study, we will not assign any components to these papers. Therefore, in our dataset the evaluation components section for these papers is entirely empty. These papers are still listed so that we can derive statistics on the number of papers with and without practical evaluations.
- Is the evaluation component not described succinctly?
-
In rare cases we faced great difficulty in determining whether an evaluation component is following established methods or is custom made. This is restricted to papers which use a random task set generator, which is a commonly applied category of component with many variants. If the authors do not provide the name of the algorithm or technique used, nor cite other works providing further details and finally do not succinctly describe the generation process we classified the component as undetermined task set generator.
Regarding this categorization, it is important to keep in mind that our approach is based on cursory reading. In our analysis, we make no distinction between custom task set generator and undetermined task set generator.
- Does the evaluation component have a name?
-
Established components typically carry a name and there is an original resource for them which can be cited. If authors have clearly stated the name in their evaluation, this name was added directly to our dataset.
However, some authors do not use the given name of an evaluation component and instead just reference it. In these cases, the provided reference material was used to help categorize it.
In summary, we categorize the evaluation component based on whether it has a name, not based on whether authors use the name.
- Is the component being extended?
-
Evaluation components with established names are typically of generic nature. This may be inadequate for a given system model.
In such cases authors may opt to extend the established components in some way. We categorize such components as extended. For example, in [4] the task set generator UUniFast is used in a greater context specific to the system model considered within the paper.
The differentiation between original and extended components is not trivial. Generally, we considered components to be used in their original state, unless it was clearly indicated that they are being extended.
- Is the component established in prior work?
-
As stated above, authors sometimes refer to evaluation components by citing other works. If these other works do not provide any further insights into the name of the component, we assume it to be nameless and categorize it as referenced. We opted to use a unique identifier in our dataset for such components. This allows us to group various papers together, despite the lack of a name. The unique identifier is derived from the last names of the authors of the referenced works introducing the evaluation component. This process is not guaranteed to be free of errors, because there is no guarantee that different papers cite the same paper as original resource for a component.
- Default: Custom Evaluation Techniques.
-
If the above categories are insufficient, we opt to refer to the presented evaluation component as custom. It is important to note that custom components may not have originated with the authors of the paper entirely. For example, it is common for researchers to combine various pieces of open-source software to assemble a custom case study.
We assign all case studies to a field of study as defined in Section 2.2. The fields we identified have a great deal of overlap and making a decision proved challenging. Generally, we tried to extract the field from the authors’ stated goals. If the authors are concerned with the implementation and stability of control systems within real-time contexts, we categorize their case studies as controllers. A drone is a system which requires a flight stability controller, which in isolation is a candidate for the controller field. If however the drone is being considered in a larger context, including e.g. communication with ground stations, we categorize the case study as belonging to the unmanned aerial vehicle (uav) field.
3.4 Validity Checks
To verify the integrity and quality of our dataset, we have performed checks to validate the reproducibility of the categorization process described in Figure 1 and the comprehensiveness of the entries.
One author has classified all 677 papers according to the categorization process. Afterwards, a random selection of 5% of the papers was drawn and reassessed again in a joint effort by both authors. Of the 34 papers used for this validity check, 17 were an exact match and an additional 7 only had minor differences. These differences can be linked to subjective interpretation, e.g. differentiating fields of study for custom case studies or trying to determine whether a task set generator is truly custom-made or based on UUniFast. For 9 of the remaining 10 papers, we found that the reassessment yielded additional components compared to the first assessment. This could be a result of a greater attention to detail being applied in the validity check, as opposed to a more time-oriented focus during the initial data gathering process. For each of these 9 papers at most one additional component was identified. There was one paper in which our validity check yielded a categorization error. In the initial assessment it was determined that it references the Mälardalen Benchmark Suite. However, during reassessment we found that it instead references a case study concerning autonomous vehicles which was also formulated at the Mälardalen University.
In summary, although we have discovered several minor differences between the original and the validation set, these differences were due to oversight only, whereas the process itself appears to be robust. The additional components were added and the categorization error was fixed in the final data set.
To increase the confidence in the remaining results, we have performed full-text searches for common benchmark names and for terms related to the categories. For instance, we searched all papers for the strings artifact evaluation, UUniFast, TACLeBench, and several spelling variations. We then compared the collected search results with our manual classification. Similarly, we searched for paper citations of common generators and benchmarks, such as [5, 9], as a citation indicates that the specific component has been applied in the evaluation. Interestingly, both the full-text search and citation analysis have only returned a subset of the original dataset, which indicates that these automated approaches are insufficient. Potential reasons include spelling inconsistencies we did not account for, or missing citations, or components only being described indirectly via several steps of references.
Nonetheless, our validity checks give us a high degree of confidence that our dataset is predominantly correct.
3.5 Lessons Learned
Conducting a systematic mapping study
We naively collected all of our data in a complete first pass without considering the time investment. If we had started with a small, but representative sample of the search space, we could have started the clustering of our data much earlier. This would have saved us time by reducing the amount of re-evaluation steps required. A detailed process for working with a small subset of the search space upfront can be found in [15].
Internal validity of the collected data is a bigger issue, than we anticipated. Minor mistakes not only required identification, but also careful edits after all the data was collected. It was helpful that some of our data is redundant. For example, a named evaluation technique must be accompanied by a name in the specifier field. Spelling mistakes and pieces of data entered in the wrong cell of a spreadsheet were easily be caught by automated grouping, e.g. by category.
Use of automated techniques
We used simple automated techniques to assist in our search and validity checks, such as precise match text search. These tools were not reliable enough to replace manual processing. For example, searching for names of evaluation techniques could not easily be automated due to spelling inconsistencies: The task set generator UUniFast is often misspelled, because authors omit the first letter U. RandFixSum is another task set generator, which is not consistently abbreviated, but may show up as RandomFixSum or RandFixedSum for example. The Erdös–Renyi algorithm and the Mälardalen benchmark suite are also troublesome because of umlaut characters. Generally speaking, capital letters within a given name (e.g. TACLeBench) are used inconsistently. One also cannot rely entirely on citations to papers introducing new evaluation techniques. For example, the paper introducing UUniFast [5] also introduces UUniSort, which corresponds to a similar yet different task set generation algorithm.
Further, information about papers that have passed artifact evaluation is difficult to find with an automated approach. Not all papers that have passed the evaluation have a seal on the front page. For some papers, the seal is in the form of a bitmap and thus cannot be found using a text search.
The problems regarding spelling inconsistencies could potentially be mitigated with fuzzy search tools, maybe with some effort required to set up a custom dictionary. Detecting specific bitmap images is also a possibility, but likely more complex to set up.
Threat to the double-blind reviewing process
During this process we realized that there appears to be a common pitfall in referencing evaluation components. Suppose an evaluation section starts with the following:
For our evaluation section we use the technique presented in [x].
In this case, the authors confidently assess that their scenario is identical to the one they have cited. One would assume that the cited works introduce a named evaluation component and a detailed description on how to use it.
Instead, we found that papers cited this way often concern themselves with a very similar system model and the novel evaluation is merely a small portion in the overall paper structure. In such cases, the authors of both papers are often identical.
Therefore, we fear that confidently asserting one uses the same nameless component as presented in a cited paper has very high unblinding potential.
As a counterexample, Guo et al. use a referenced component by introducing it as a “similar approach” [12] to the one presented by Ekberg et al. in [7]. The use of the word “similar” indicates a lower degree of confidence that the components are equivalent, which can be attributed to the fact that the two papers have different authors entirely.
Software availability
Many researchers choose to publish their tools as open-source software. Unfortunately, there does not seem to be a universally agreed upon strategy to provide access to these software resources. Some authors use the artifact evaluation process, some use links in footnotes, others use the bibliography, yet others place a link somewhere at the beginning (or end) of their paper. Hosting sites can vary as well.
The artifact evaluation process has the upside of being unified and reliable, but it does not offer an option to update and extend the software. This is both an up- and a downside, as the original state is preserved, but any extension requires another publication. Public code repositories are more versatile in this regard. The downside is that the software is hosted externally and may not be as persistent as hoped. For example, we found that some open-source projects referenced in older papers have disappeared. We made no attempts to find a different hosting site.
4 Analysis and Visualization
We visualize a subset of results gathered with our systematic mapping study using a set of standard charts. In addition to the charts presented in this section, the data set and evaluation scripts (using Python, Pandas and Matplotlib111https://www.python.org/
https://pandas.pydata.org/
https://matplotlib.org/) are available for further perusal in the supplementary material. In total, there are non-empty entries in our data set. However, even though papers without evaluations have empty fields, these entries can carry valuable information as well, such as giving insight on the amount of such papers.
Although we have used mostly standard charts, the data visualization demands further explanation:
We have set a threshold for the visualization and only show component categories and fields of study with at least occurrences. Otherwise, the graph would become too cluttered. Remaining entries are subsumed into a separate entry we call Misc(-ellaneous). Similarly, whenever we group data per author, it is limited to authors with at least publications within the data set, again for the sake of readability. In our charts, we have anonymized the authors’ names. Although the information is obviously public, here we are only interested in the grouping of evaluation techniques and not the work of individual researchers.
All presented charts are color-coded and legends are unique to each figure. Whenever legends cannot be placed immediately next to a section of the chart, we additionally use dashes, grids, or symbol patterns to assist in differentiation.
- Numerical Proportions: Pie Charts
-
show numerical proportions of the entire population, i.e. over all years and conferences. For example, according to Figure 6, UUniFast makes up more than of all instances of evaluation components and Figure 7 shows that about of all papers underwent the artifact evaluation process. We show absolute values within the pie chart in parentheses.
- Evolution of Proportions: Stacked Bar Charts
-
show the evolution of proportions per year and per conference. For instance, Figure 3 shows that case studies are increasingly more common at RTSS than at ECRTS.
- Distributions per Author: Heatmaps
-
show the distributions per author. If a paper has been written by more than one author above the threshold of publications, the paper contributes more than once to the heat map. For instance, Figure 4 shows that all authors with at least publications have used task set generators.
- Use over Time: Line Charts
-
show the absolute number of uses of components per year across all conferences. For example, the first graph in Figure 8 shows the uses of the task set generators UUniFast–Discard, RandFixSum, and Dirichlet–Rescale.
When interpreting results, we must be aware that the total population differs depending on the query. For instance, research fields are only defined for case studies, but a paper may contain more than one case study, or none at all. Hence, the total population in this case consists of all case studies, unrelated to the number of papers in the dataset. However, when we consider reproducibility we rely on the availability of artifacts. Therefore it can only be analyzed per paper, and not per instance of evaluation component, hence the total population of this query equals the total set of papers.
4.1 Cataloging Evaluation Components
We first start with an overview of the general evaluation categories as defined in Section 2.1. In total, we have recorded individual evaluation component uses, significantly more than the number of papers we have analyzed. Figure 2 shows how the individual evaluation components are distributed among the papers.
Nearly half of all papers exhibit only one evaluation component. Papers that exhibit more than one component, typically combine one, or even several, case studies with a more generic component, such as benchmarks or generators. Papers with a very high number of components often combine benchmarks from various sources. Although it can be argued that in such a case, the combined set of benchmarks may only serve for one experiment, we have not performed such an in-depth analysis, as we only account for whether a component is used at all. We give the authors the benefit of the doubt that each benchmark suite serves a different purpose, because of these limitations in our methodology.
More than of all component instances are categorized as a case study, closely followed by benchmarks, task set generators and microbenchmarks. The rest is much less common and includes, among others, various kinds of generators and specifications. Figure 3 shows no clear trends over the years, but some indication that benchmarks are more common at ECRTS than at RTSS, while case studies are more common at RTSS.
The heat map of evaluation components favored by prolific authors, shown in Figure 4, reveals that authors who published more than papers have all used task set generators. This serves as an indication, that task set generators as a category are de-facto standard practice within real-time systems research. Almost all papers without practical evaluation are co-authored by at least one of the most prolific authors.
In contrast, authors with fewer than 12 publications within our data set did not publish a paper without a practical evaluation, at least not without a more prolific member of our community as co-author.
In Figure 5, we analyze the distribution of fields of study. These fields are only defined per case study instance, hence, the total population in these figures consists of entries. The fields have significant overlap. One must not interpret Figure 5 to indicate that neural networks are competing for attention with the automotive field. Instead, we draw the conclusion that our community is broadly concerned with cutting edge automotive applications, such as autonomous driving which includes neural networks, e.g. for obstacle detection.
We have not been able to draw conclusive observations from the distribution of research fields to authors. Hence, no heat map regarding fields is provided here.
Figure 6 shows the distribution of instances of named components. This graph subsumes various categories, including benchmarks, task set generators, case studies, and specifications as long as the component is clearly identified by name. In the graph, generators are highlighted with dashes, specifications with grids, and for benchmarks we used dots, rings, and stars. The total population consists of 657 entries.
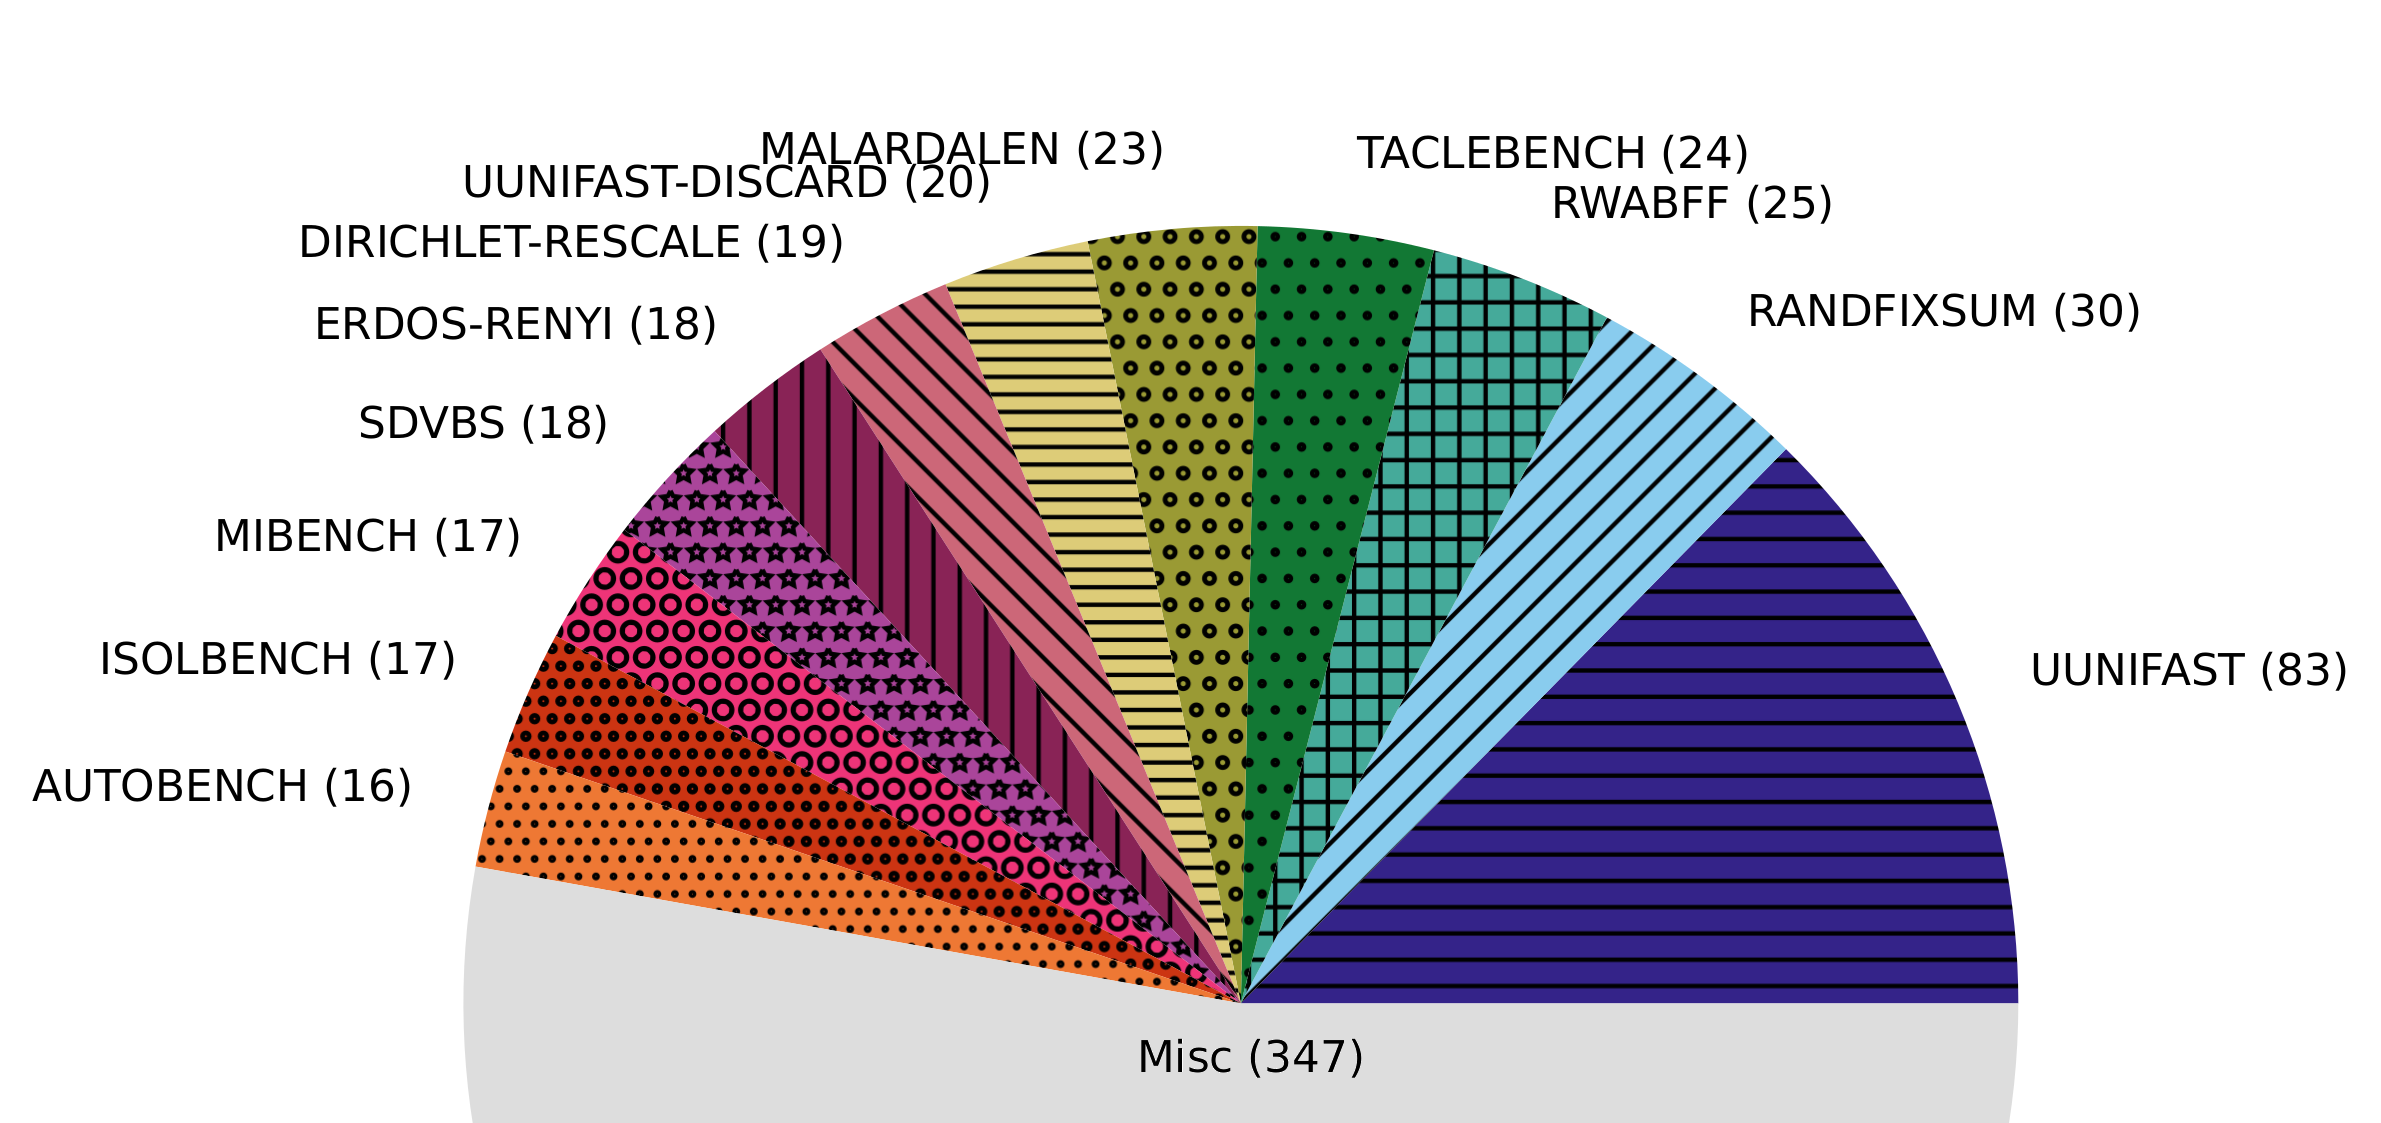
We have observed a large variety with over different names222Due to different versions of otherwise similar benchmarks, we estimate that the actual number of meaningfully distinct benchmarks or generators may in fact be slightly lower.. Given that we have studied papers, including some without a practical evaluation, nearly every third paper introduces a new named benchmark, case study or otherwise new evaluation component. Only about of these named evaluation components are used in at least papers. Instead, or about are used only once. These results are puzzling. On the one hand, we can hypothesize that this result is a positive indication of the large variety of real-time embedded system models that we cover in our research community. On the other hand, it is also a clear indicator for a lack of commonality. If nearly every paper uses unique evaluation components, the results will generally not be comparable.
The only clear exception, which we may call a de-facto standard, is UUniFast. This task set generator seems to provide common ground for the evaluation of scheduling techniques.
We can further conclude that the industrial challenges, such as those posed at the WATERS workshop and later on at ECRTS, have had only minor impact so far, as there are only uses within our dataset. This suggests that there may be significant barriers and/or a lack of interest in the research community to adopt a unified and realistic case study.
4.2 Replication, Reproducibility and Experimental Setup
As described in Section 1, ideally all scientific results are replicable, i.e. a proposed method works under any valid set of conditions. With artifact evaluation we at least have proof of reproducibility, i.e. the method works consistently within equal conditions. With this systematic mapping study, we are not able to provide conclusive evidence about the replicability. We do not only believe that this is out-of-scope of this paper, but also that the effort required would only allow for a replicability study of a very small set of papers.
We can, however, provide an estimate of how difficult it is to recreate an evaluation scenario to analyze the reproducibility. Recreating the very same evaluation scenario also is the requirement for analyzing the very same subject matter which allows for the comparison of experimental results.
First, all evaluation results of papers that have passed artifact evaluation have already been successfully reproduced. Evaluation artifacts are also easy to access and kept in their original state. For other papers, if all components of an evaluation are named, one can at least combine the corresponding benchmarks (or generators, …) in an attempt to reproduce the subject matter. On the other extreme, a custom evaluation can usually only be reproduced if it is comprehensively described. The access to restricted evaluation components is clearly expected to be even more difficult or outright impossible.
In Figure 7 we have categorized all papers that include at least one evaluation component into how easily accessible their components are and, thus, how easy it is to recreate the subject matter. The total size of the population of this figure is . We have used a strict definition in that a single restricted component suffices to classify a paper as restricted and all components must be named for a paper to be classified as named.
Artifact evaluation was available throughout the entire time frame of our study at ECRTS and RTSS. RTAS first offered the process in . For all three conference it appears that the artifact evaluation has saturated quickly with no clear trends of change throughout the years. Since artifact evaluation is not feasible for every publication, it therefore seems reasonable to assume that all authors who could participate, already do.
Considering reproducibility, nearly every fifth paper passes artifact evaluation and only of all papers use restricted evaluation components. On the other hand, roughly half of all papers require the reader to manually rebuild the evaluation scenario based solely on the description within them. We assume this process to be more cumbersome and potentially error-prone than simply using an artifact or even a named component.
4.3 Evolution and Adoption of Evaluation Components
Ideally, a benchmark is a permanently fixed piece of software, but in practice all software may contain bugs or require updates for compatibility with new systems. As performance demands are rising, benchmark suites may also require extension to stay relevant. Thus, benchmark suites undergo an evolution and change over time. The same can be said for other tools, such as task set generators. As the experience of our research community grows, older approaches may fall out of favor. We believe that as researchers we must hold ourselves accountable to stay informed and adopt new practices.
In Figure 8, we show the timeline of uses of newer components compared to the ones they are meant to surpass. In the first graph, we track the use of the multi-core task set generators UUniFast–Discard, RandFixSum, and Dirichlet–Rescale. UUniFast–Discard is very inefficient as it tends to generate invalid output, which must be discarded (hence the name). RandFixSum solves this, but constrains the user limiting its applications [8]. Dirichlet–Rescale improves on these usability issues and is state-of-the-art since 2020 [11]. We can see that the community partially adopts the new task set generator immediately following its introduction, but the older generators remain in use nonetheless.
A similar phenomenon is shown in the second graph: The benchmark suite TACLeBench from 2016 contains, among others, the benchmarks from Mälardalen, but with several fixes, extensions, and in uniform format [9]. Nonetheless, Mälardalen was at least equally popular until 2020 and remains in use since then.
In the first two graphs, the adoption of the improved component is slow, but still clearly visible. In the third graph we see an example of no adoption happening at all: The San Diego Vision Benchmark Suite (SDVBS) has been superseded in 2014 by the Cortex Suite, which contains several extensions to meet rising performance demands and to provide a more diverse range of example applications [20]. Yet in our study SDVBS was consistently exactly as or even more prevalent than Cortex Suite.
There may be justifiable reasons to use outdated components, even many years after they have been surpassed. Such justifications are not captured in our study and must be assessed individually in a paper review process. However, it is also possible that both authors and reviewers remain uninformed about changes to the state-of-the-art practices.
4.4 Discussion
Our quantitative analysis has yielded puzzling results prompting further research questions. For example, the specification Real-World Automotive Benchmarks For Free (RWABFF) based on realistic automotive systems was used much more commonly than complete automotive industrial challenges posed at the WATERS workshop. It is possible that the industrial challenges are deemed too restrictive by researchers and that in comparison a specification such as RWABFF offers more degrees of freedom. This is supported by the frequent use of custom case studies, which indicates that researchers are able and willing to deal with highly complex systems. In summary, more research is needed to determine which demands must be met to provide a unified, realistic case study to the real-time systems research community.
Our systematic mapping study provides the ground work for these research questions. We plan to tackle them by undertaking a systematic review, in which we narrow down on specific evaluation practices in more depth, by analyzing not just whether they have been applied at all, but also the specific methodology and conditions in detail.
5 Conclusions
This paper presents the first systematic mapping study on evaluation practices in the real-time systems research community. It covers the top real-time conferences ECRTS, RTSS, and RTAS from 2017 to 2024 and provides a quantitative view on how we evaluate our research results.
Our study provides insights into the popularity of evaluation components across conferences, time and author groups. It has shown that our community has a wide array of evaluation techniques at its disposal. On average, every third paper introduces a new technique, or at least a variant thereof. Although, we can interpret this wide array in a positive way, showcasing the diversity of our research subjects, it comes with a significant downside: The prevalence of custom-made evaluations diminishes the likelihood of reproducibility. It also indicates that plenty of our research papers target distinct subjects matters, further reducing comparability of research results.
To our dismay, industrial challenges, which offer unified, realistic case studies, have only had minor impact to remedy this shortcoming. The artifact evaluation process can ensure the reproducibility of evaluations and the continued availability of software resources. The approach was quickly adopted by authors following its initial introduction, however it has saturated at a relatively low level of participation overall.
Last but not least, our mapping study shows our community is slow in adopting new evaluation techniques. Instead, we keep relying on older, deprecated benchmarks and generators beyond of what seems reasonable.
In summary, evaluation techniques are not just an obligation to get a paper published. They serve an actual purpose: to show the practicability, comparability, and reproducibility of our research. Reproducible evaluations are also desirable to achieve a collaborative and accessible research environment. We sincerely hope that this study raises awareness and will lead to improved evaluation practices in our research community.
References
- [1] Icore conference portal. https://portal.core.edu.au/conf-ranks/. Accessed: 2025-04-30.
- [2] Qualis conference ranks. https://sucupira-legado.capes.gov.br/sucupira/public/consultas/coleta/qualisEventos/listaQualisEventos.xhtml. Accessed: 2025-02-28.
- [3] Standard performance evaluation corporation (spec) eembc benchmarks. https://www.eembc.org/products/. Accessed: 2025-02-28.
- [4] Ankit Agrawal, Renato Mancuso, Rodolfo Pellizzoni, and Gerhard Fohler. Analysis of dynamic memory bandwidth regulation in multi-core real-time systems. In 2018 IEEE Real-Time Systems Symposium, RTSS 2018, Nashville, TN, USA, December 11-14, 2018, pages 230–241. IEEE Computer Society, 2018. doi:10.1109/RTSS.2018.00040.
- [5] Enrico Bini and Giorgio C. Buttazzo. Measuring the performance of schedulability tests. Real-Time Systems, 30(1-2):129–154, May 2005. doi:10.1007/s11241-005-0507-9.
- [6] Robert I. Davis and Alan Burns. Priority assignment for global fixed priority pre-emptive scheduling in multiprocessor real-time systems. In Theodore P. Baker, editor, Proceedings of the 30th IEEE Real-Time Systems Symposium, RTSS 2009, Washington, DC, USA, 1-4 December 2009, pages 398–409. IEEE Computer Society, 2009. doi:10.1109/RTSS.2009.31.
- [7] Pontus Ekberg and Wang Yi. Bounding and shaping the demand of generalized mixed-criticality sporadic task systems. Real-Time Systems, 50(1):48–86, January 2014. doi:10.1007/s11241-013-9187-z.
- [8] Paul Emberson, Roger Stafford, and Robert I. Davis. Techniques for the synthesis of multiprocessor tasksets. In 1st International Workshop on Analysis Tools and Methodologies for Embedded and Real-time Systems (WATERS), pages 6–11, July 2010.
- [9] Heiko Falk, Sebastian Altmeyer, Peter Hellinckx, Björn Lisper, Wolfgang Puffitsch, Christine Rochange, Martin Schoeberl, Rasmus Bo Sørensen, Peter Wägemann, and Simon Wegener. Taclebench: A benchmark collection to support worst-case execution time research. In Martin Schoeberl, editor, 16th International Workshop on Worst-Case Execution Time Analysis, WCET 2016, July 5, 2016, Toulouse, France, volume 55 of OASIcs, pages 2:1–2:10, Dagstuhl, Germany, 2016. Schloss Dagstuhl – Leibniz-Zentrum für Informatik. doi:10.4230/OASIcs.WCET.2016.2.
- [10] Anam Farrukh and Richard West. Jump2start: Time-aware stop-start technology for a software-defined vehicle system. In Rodolfo Pellizzoni, editor, 36th Euromicro Conference on Real-Time Systems, ECRTS 2024, July 9-12, 2024, Lille, France, volume 298 of LIPIcs, pages 1:1–1:27, Dagstuhl, Germany, 2024. Schloss Dagstuhl – Leibniz-Zentrum für Informatik. doi:10.4230/LIPIcs.ECRTS.2024.1.
- [11] David Griffin, Iain Bate, and Robert I. Davis. Generating utilization vectors for the systematic evaluation of schedulability tests. In 41st IEEE Real-Time Systems Symposium, RTSS 2020, Houston, TX, USA, December 1-4, 2020, pages 76–88. IEEE, 2020. doi:10.1109/RTSS49844.2020.00018.
- [12] Zhishan Guo, Kecheng Yang, Sudharsan Vaidhun, Samsil Arefin, Sajal K. Das, and Haoyi Xiong. Uniprocessor mixed-criticality scheduling with graceful degradation by completion rate. In 2018 IEEE Real-Time Systems Symposium, RTSS 2018, Nashville, TN, USA, December 11-14, 2018, pages 373–383. IEEE Computer Society, 2018. doi:10.1109/RTSS.2018.00052.
- [13] Jan Gustafsson, Adam Betts, Andreas Ermedahl, and Björn Lisper. The mälardalen WCET benchmarks: Past, present and future. In Björn Lisper, editor, 10th International Workshop on Worst-Case Execution Time Analysis, WCET 2010, July 6, 2010, Brussels, Belgium, volume 15 of OASIcs, pages 136–146, Brussels, Belgium, July 2010. Schloss Dagstuhl – Leibniz-Zentrum für Informatik, Germany. doi:10.4230/OASIcs.WCET.2010.136.
- [14] Matthew R. Guthaus, Jeffrey S. Ringenberg, Dan Ernst, Todd M. Austin, Trevor Mudge, and Richard B. Brown. Mibench: A free, commercially representative embedded benchmark suite. In Proceedings of the Fourth Annual IEEE International Workshop on Workload Characterization. WWC-4 (Cat. No.01EX538), pages 3–14, 2001. doi:10.1109/WWC.2001.990739.
- [15] Alireza Haghighatkhah, Ahmad Banijamali, Olli-Pekka Pakanen, Markku Oivo, and Pasi Kuvaja. Automotive software engineering: A systematic mapping study. Journal of Systems and Software, 128:25–55, 2017. doi:10.1016/j.jss.2017.03.005.
- [16] Mohamed Hassan and Rodolfo Pellizzoni. Analysis of memory-contention in heterogeneous COTS mpsocs. In Marcus Völp, editor, 32nd Euromicro Conference on Real-Time Systems, ECRTS 2020, July 7-10, 2020, Virtual Conference, volume 165 of LIPIcs, pages 23:1–23:24, Dagstuhl, Germany, 2020. Schloss Dagstuhl – Leibniz-Zentrum für Informatik. doi:10.4230/LIPIcs.ECRTS.2020.23.
- [17] Barbara A. Kitchenham, David Budgen, and O. Pearl Brereton. The value of mapping studies - A participant-observer case study. In Mark Turner and Mahmood Niazi, editors, 14th International Conference on Evaluation and Assessment in Software Engineering, EASE 2010, Keele University, UK, 12-13 April 2010, Workshops in Computing. BCS, January 2010. URL: http://ewic.bcs.org/content/ConWebDoc/34782.
- [18] Simon Kramer, Dirk Ziegenbein, and Arne Hamann. Real world automotive benchmarks for free. In 6th International Workshop on Analysis Tools and Methodologies for Embedded and Real-time Systems (WATERS), volume 130, 2015.
- [19] Kai Petersen, Sairam Vakkalanka, and Ludwik Kuzniarz. Guidelines for conducting systematic mapping studies in software engineering: An update. Information and Software Technology, 64:1–18, 2015. doi:10.1016/j.infsof.2015.03.007.
- [20] Shelby Thomas, Chetan Gohkale, Enrico Tanuwidjaja, Tony Chong, David Lau, Saturnino Garcia, and Michael Bedford Taylor. Cortexsuite: A synthetic brain benchmark suite. In 2014 IEEE International Symposium on Workload Characterization, IISWC 2014, Raleigh, NC, USA, October 26-28, 2014, pages 76–79. IEEE Computer Society, 2014. doi:10.1109/IISWC.2014.6983043.
- [21] Tilmann L. Unte and Sebastian Altmeyer. ECRTS2025 Systematic Mapping Study on Real-Time System Evaluation Techniques. Dataset, version ECRTS2025., BMWK 01MN23013F - TwinSpace, swhId: swh:1:dir:0c81b5e7c6347c45052e14d92cb96a9335f43fdf (visited on 2025-06-23). URL: https://github.com/TilmannUnte/ecrts2025-systematic-mapping-study/releases/tag/ecrts2025, doi:10.4230/artifacts.23679.
- [22] Prathap Kumar Valsan, Heechul Yun, and Farzad Farshchi. Taming non-blocking caches to improve isolation in multicore real-time systems. In 2016 IEEE Real-Time and Embedded Technology and Applications Symposium (RTAS), Vienna, Austria, April 11-14, 2016, pages 161–172. IEEE Computer Society, 2016. doi:10.1109/RTAS.2016.7461361.
- [23] Sravanthi Kota Venkata, Ikkjin Ahn, Donghwan Jeon, Anshuman Gupta, Christopher M. Louie, Saturnino Garcia, Serge J. Belongie, and Michael Bedford Taylor. SD-VBS: the san diego vision benchmark suite. In Proceedings of the 2009 IEEE International Symposium on Workload Characterization, IISWC 2009, October 4-6, 2009, Austin, TX, USA, pages 55–64. IEEE Computer Society, 2009. doi:10.1109/IISWC.2009.5306794.