Assessing Map Reproducibility with Visual Question-Answering: An Empirical Evaluation

Abstract
Reproducibility is a key principle of the modern scientific method. Maps, as an important means of communicating scientific results in GIScience and across disciplines, should be reproducible. Currently, map reproducibility assessment is done manually, which makes the assessment process tedious and time-consuming, ultimately limiting its efficiency. Hence, this work explores the extent to which Visual Question-Answering (VQA) can be used to automate some tasks relevant to map reproducibility assessment. We selected five state-of-the-art vision language models (VLMs) and followed a three-step approach to evaluate their ability to discriminate between maps and other images, interpret map content, and compare two map images using VQA. Our results show that current VLMs already possess map-reading capabilities and demonstrate understanding of spatial concepts, such as cardinal directions, geographic scope, and legend interpretation. Our paper demonstrates the potential of using VQA to support reproducibility assessment and highlights the outstanding issues that need to be addressed to achieve accurate, trustworthy map descriptions, thereby reducing the time and effort required by human evaluators.
Keywords and phrases:
map comparison, computational reproducibility, visual question answering, large language models, GeoAIFunding:
Eftychia Koukouraki: Erasmus+ programme, Erasmus Mundus action 2021-2027, project number 101049796.Copyright and License:
2012 ACM Subject Classification:
Information systems Question answering ; Computing methodologies Spatial and physical reasoning ; Human-centered computing Geographic visualization ; Applied computing CartographyEditors:
Katarzyna Sila-Nowicka, Antoni Moore, David O'Sullivan, Benjamin Adams, and Mark GaheganSeries and Publisher:
1 Introduction and Background
Maps play a key role in information visualisation, serving as an essential tool for communicating insights from geographic and spatial data. Geographic maps are published in various outlets, from scientific journals to newspapers, which makes them accessible to a wide range of audiences. Maps in scientific outlets, in particular, should represent the world truthfully and accurately within known limits of precision [14], and ideally be reproducible in order to provide reliable evidence for findings and facilitate the communication of science to society. Take, for instance, the field of environmental sciences, where climate change debates have grown increasingly polarised. Maps can be powerful tools in these discussions, but they can also be used to promote competing agendas. If inaccurate or misleading, maps can lead to serious consequences, including poor decision making and hindered climate action. This example illustrates a larger point: the need for transparent and reproducible map making standards that can be applied across domains to support informed decision making and maintain scientific integrity. Current practices of overpublishing that favour quantity over quality in research publications [1], combined with the explosion of generative artificial intelligence (AI), have made reproducibility increasingly important for establishing the credibility of published research, for verifying results, and for enabling current studies to be reused and built upon.
Reproducibility is defined as the ability to reach the same results previously obtained by other researchers after repeating a scientific experiment based on the same data and methods [18]. This can only be achieved if the data and software that underpinned a study are transparent and accessible, but even then it is often not possible in practice to achieve exactly the same results as the original study, especially when it comes to reproducing visualisations. Inadequate documentation, the use of different software packages, and the reliance on implicit system configurations are common causes of discrepancies between the reproduced results and the original findings [15, 16, 19]. To ensure that a study is reproducible, the reproduced results must be evaluated against the original results [12, 15, 17, 24].
Basing the evaluation of reproduced results on numerical values is generally a straightforward process: if all numbers are identical, the reproduction is considered successful. However, visualised results, e.g. in the form of diagrams or maps, are easier to grasp for human observers, but pose several challenges when used to assess reproducibility. Variations in graph curves, missing key numbers, and different aspect ratios can make it difficult for readers to determine if reproduced figures accurately reflect the original results, even when the numerical data is identical [15]. In addition, an increased effort required for map reading can negatively impact the evaluator’s assessment of the success of the map reproduction [17]. Therefore, computational support is essential for assessing reproduced maps in order to increase efficiency and accuracy, as well as to facilitate the examination of geovisualisations illustrating complex datasets. Besides, multiple maps can be derived from a single dataset during scientific exploration. Nonetheless, reproducible map making focuses on creating a faithful visual copy of an original map, without introducing any significant variations that alter the map’s interpretation [16]. Hence, only two maps are of interest during reproducibility assessment: the original and its copy. The goal is to identify similarities or differences between them - using supporting data, software, and documentation - without concern for the map’s ontological status (e.g. as truth, social construct, or mappings [13]). Of course, graphical excellence and graphical integrity [21] remain essential to ensure that both the original and the copy do not distort effects in the underlying source data.
Question-answering (QA) can serve as a method for extracting and evaluating map content [20]. Visual question-answering (VQA), the computer vision task of teaching machines to comprehend the content of a picture and to answer questions about it in natural language, can now be supported by vision language models (VLMs), which are multimodal large language models (LLMs) capable of processing and understanding both text and image. For example, Bendeck and Stasko [3] explored the potential of VLMs for the visual interpretation of charts, confirming their capabilities while also highlighting their current limitations in this task. Thus, we can infer that maps, as a specialised type of chart with explicit spatial relationships between the depicted elements, could also benefit from these advancements.
In order to investigate to what degree this is true in practice, we examined the ability of five state-of-the-art models to support tasks related to map reproduction assessment. Our goal was to assess whether VLMs can assist an independent reproducing researcher or a reproducibility reviewer to verify that a map has been successfully reproduced. In particular, we examined three tasks: map discrimination (distinguishing between map and non-map images), map interpretation (answering questions about a map image accurately), and map comparison (assessing the similarity of two maps based on a set of questions).
Recent studies in GIScience have explored the understanding of LLMs for spatial concepts. For instance, Ji and Gao [11] evaluated the ability of LLMs (GPT-2, BERT) to represent geometries and their spatial relations using LLM-generated embeddings. The results showed the potential of LLMs to capture geometry types and spatial relations, while there is room for improvement in estimating numerical values and retrieving spatially related objects. The capacity of LLMs for spatial reasoning was also confirmed by Cohn and Blackwell [6]. However, they concluded that LLMs are not reliable for drawing conclusions about cardinal directions and perform better in factual recall tasks rather than in spatial reasoning tasks. Hojati and Feick [9] tested the performance of various LLMs in answering spatial questions and providing methodological steps for arriving at each answer, both in natural language and in SQL. Feng et al. [7] connected the prompt to an external knowledge base to develop a Geographic Question Answering (GeoQA) pipeline, thereby extending the capabilities of LLMs. Moving from text-only to multimodal input (i.e. text accompanied by images), Xu and Tao [23] found that GPT-4V could retrieve information and perform basic analysis tasks with maps. Griffin and Robinson [8] used the ChatGPT prompt to generate accessibility descriptions for map input. While the aforementioned studies demonstrate encouraging results, multimodal input has yet to be systematically tested for spatial concepts.
Our research addresses this challenge, setting the context of QA in relation to the assessment of map reproducibility. The key contribution of this paper is the empirical evaluation of five state-of-the-art VLMs for three key tasks related to map reproducibility assessment: map discrimination, interpretation and comparison. Our findings demonstrate that, albeit with certain limitations, VLM-enabled VQA can streamline the verification of reproduced scientific results displayed on maps. In addition to its benefits in automating reproducibility assessment, map VQA also has the potential to improve accessibility as it opens up new possibilities for visually impaired readers to access information in figures.
2 Experimental Design
To examine the interpretation capabilities of VLMs for maps, we selected five state-of-the-art VLMs based on performance and diversity. Specifically, we considered the models with the highest scores on the vision leaderboard in the Chatbot Arena [5], ensuring that no two models were from the same provider (e.g. Google or OpenAI). We did not consider models that might be subject to rate limits or withdrawn without prior notice, such as those labelled as experimental or preview. The selection was done at the beginning of January 2025 and this led to the following five models: Gemini 2.0 Flash-001, GPT-4o (2024-11-20), Claude 3.5 Sonnet (20240620), Pixtral Large (latest), and Qwen-VL-Max. We narrowed down the scope of this study by focusing solely on thematic maps and followed a three-step approach to evaluate the map reasoning skills of the selected VLMs:
- Step 1 – Map Discrimination
-
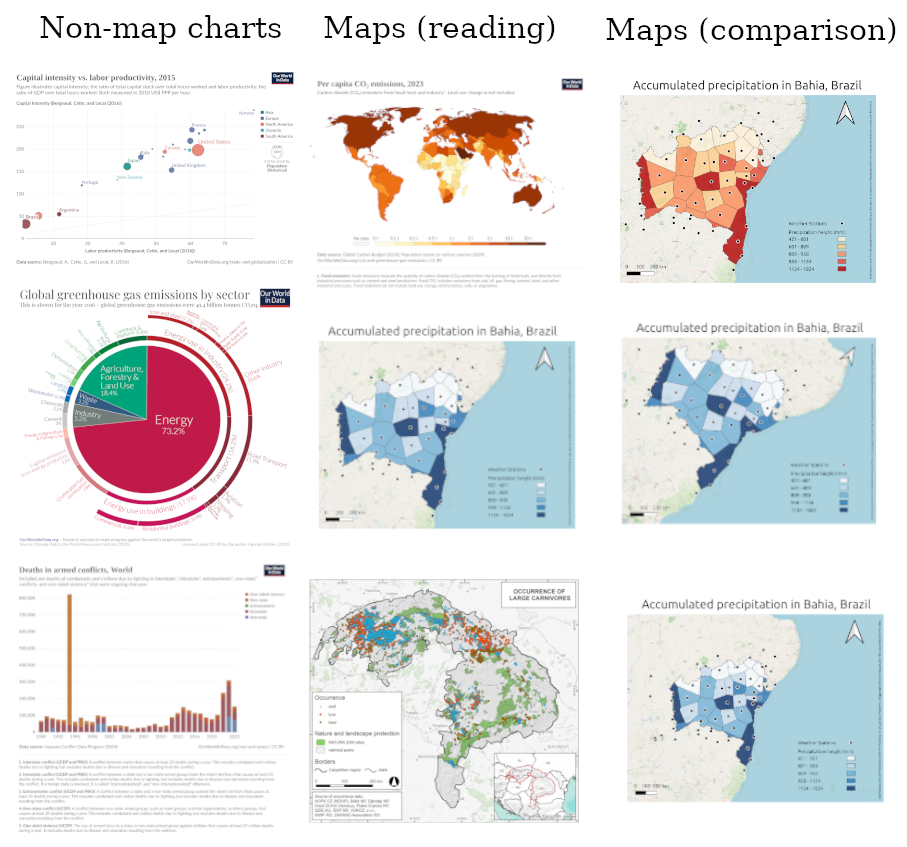
The ability to distinguish between different types of charts -between maps and non-maps in this case - is necessary for automating the reproducibility assessment of visualisations. We considered this step a prerequisite for confirming that the VLM understands the concept of a geographic map and can therefore be used to automate subsequent tasks related to the reproducibility assessment of geovisualisations. Hence, we tested the ability of the models to differentiate between maps and other types of charts. We assembled a dataset of 40 images, consisting of 20 maps and 20 charts of other types, including pie, line, bar and point charts, and posed the question Is this image showing a map?. To account for the diversity of maps encountered in different outlets, we sourced maps from Our World in Data, which targets broader audiences, and from the scientific Journal of Maps. The selected maps cover a range of geographic scopes, from regional to global; different layout and legend styles; and different applications, from geological to socio-economic indicators. All the images we sourced were licensed under CC BY.
- Step 2 – Map Interpretation
-
Extracting and evaluating information from maps is essential for assessing the equivalence between one map and another. Therefore, we tested the VLM’s ability to read and interpret geographic maps. We asked eight questions about map interpretation on the map subset from the map discrimination task, each question addressing one of the following dimensions: map type, spatial scale, geographic scope, orientation, visualised data, symbology, legend recognition, and legend-data consistency.
- Step 3 – Map Comparison
-
The final step in assessing reproducibility is to compare the reproduced result with the original, as mentioned in Section 1. Therefore, we evaluated the VLMs’ map comparison capabilities. For this step, we used a dataset of 20 maps that differ from each other in only one dimension, such as orientation, symbology, or legend, to assess whether the models can identify subtle visual nuances that are relevant in geographic information visualisation. We provided two maps as input to the models and asked six questions about their differences, following the guidelines on the importance of visual differences in assessing map reproducions provided by [17]. The questions addressed similarities in the topic, geographic extent, orientation, positions of the visualised data, legend, and symbology. All questions were formulated to be answerable with yes or no, so that a human evaluator could quickly skim through the automated responses and determine whether any significant differences were identified.
The aforementioned steps were implemented using the models’ APIs in Python scripts. In the API calls, we set the models’ attributes temperature to “0” and, if applicable, seed to the same random integer (“123”) to make the model as deterministic as possible. We also set the maximum number of tokens in the model’s response to 128, assuming that this number of tokens should be sufficient to provide a focused answer. If the model exhausted this limit for most answers, we reran the test and set a new maximum number of 160 tokens. We did not extend the token limit beyond this number. Additionally, we measured the time each model took to respond to each prompt and calculated the mean completion time per output token.
A sample of the dataset for all three steps is shown on Figure 1. The entire dataset and the scripts created for this experiment can be accessed at https://doi.org/10.17605/OSF.IO/W4BQG.
Evaluation
We evaluated the accuracy of the map discrimination task based on the model’s ability to correctly answer yes or no, without further analysing the responses. For the map interpretation and comparison tasks, we evaluated the models’ constrained response accuracy by classifying an answer as correct if all the information provided within the specified token limit was accurate; otherwise, it was classified as incorrect. This metric indicates the model’s ability to provide an accurate answer to the question within the specified token limit, without including any false information. For example, if the model gave a correct answer but provided a false justification or included any incorrect information along with the answer, we marked it as incorrect. Similarly, if the model provided several true facts but failed to explicitly answer the question within the token limit, we also marked it as incorrect. Our guiding principle for the evaluation was whether the model could be trusted to provide accurate information without requiring our supervision. During the evaluation process, we kept a log of issues that arose and could help further characterise the use of VLMs for this purpose, but that could not be quantified in terms of correct/incorrect percentages. We also did this to gain a qualitative impression of the models’ strengths and weaknesses.
Prototype
As mentioned in Section 1, automated tests are a desirable asset for map reproducibility assessment. With the best performing model, we built a browser-based tool that allows users to upload two map images, run the evaluation process, and determine if the second image has been successfully reproduced. The evaluation process is based on the questionnaire we created for the map comparison task. Additionally, we implemented a simple overall evaluation function that counts the number of yes and no answers, and returns a successful status if more than half of the questions were answered with yes and unsuccessful otherwise. We also integrated the calculation of cosine similarity based on the image embeddings of the two input images as an initial quantitative indicator of their similarity. The code of the prototype can be found at https://doi.org/10.17605/OSF.IO/W4BQG.
3 Results
We ran all the experiments from the same Ethernet cable endpoint, which theoretically provides a 1000 Mbps Internet connection. In practice, we measured 936.71–937.38 Mbps for download and 874.27–933.74 Mbps for upload. We found the average completion time per output token, from shortest to longest, to be as follows: Pixtral Large (0.06 seconds), Gemini 2.0 Flash (0.08 seconds), Qwen-VL-Max (0.10 seconds), Claude Sonnet 3.5 (0.11 seconds), and GPT-4o (0.15 seconds). However, Gemini 2.0 Flash had the fastest overall completion time, as it provided shorter answers compared to the other models.
In the map discrimination task, all models were able to differentiate perfectly between maps and non-maps. It is worth mentioning that one of the geographic maps in this dataset included pie charts illustrating the ratio of mountain area to land surface for each continent, and all five models correctly classified this image as a map. It should also be noted that Qwen-VL-Max rejected nine of the 20 map images used as input for the map discrimination and map interpretation tasks. The error message returned was: “Input data may contain inappropriate content.” We were unable to identify any pattern related to map topic, geographic extent, or image resolution.
For the map interpretation task, we found the constrained response accuracy, from highest to lowest, to be as follows: Gemini 2.0 Flash (80%), GPT-4o (77%), Claude Sonnet 3.5 (76%), Qwen-VL-Max (69%), and Pixtral Large (58%). The lower performance of Pixtral Large is mostly due to an inability to give concise answers within the token limit, rather than providing factually inaccurate information. Qwen-VL-Max and Pixtral Large appear to rely heavily on Optical Character Recognition (OCR), as they seem to repeatedly use the text extracted from the image in their responses. This, combined with the text generation module, can lead to vague answers. Pixtral Large also tends to continue describing the entire image even after answering the question. The constrained response accuracy per question for the map interpretation task is shown in Table 1. We can observe that almost all models performed worst on the question What is the spatial scale of the map?. We accepted answers related to the scale bar as correct; however, the models often ignored the scale bar, misinterpreted it, or referred to the geographic extent instead. Conversely, the models achieved the highest average constrained response accuracy on the question regarding the geographic scope.
The models were able to identify and distinguish between several types of maps beyond thematic, including choropleth, topographic, tectonic, proximity, land cover and habitat suitability maps. GPT-4o provided the most diverse responses to this question. All models were able to identify inset maps, although they were not explicitly asked to do so. Moreover, the models are already performing some level of fact-checking, such as identifying the location of the highest mountain peaks. The generative nature of VLMs is also evident, as they tend to elaborate on aspects that were not the subject of the question. Gemini 2.0 Flash exhibited this behaviour the least.
To answer the question What data are visualised on the map?, the models essentially parsed and repeated the legend. They showed a good understanding of what a legend is and were able to recognise different legend formats. However, mapping visual symbols to their corresponding values is not always straightforward, especially in horizontal legends where each colour represents a range of values. We found Claude Sonnet 3.5 to be particularly effective at legend interpretation, providing many details.
| Gemini 2.0 Flash | GPT-4o | Claude Sonnet 3.5 | Pixtral Large | Qwen-VL-Max | Average per question | |
| What type of map is this? | 90% | 80% | 65% | 55% | 91% | 76% |
| What is the geographic scope of the map? | 95% | 95% | 70% | 75% | 82% | 83% |
| What is the orientation of the map? | 95% | 90% | 90% | 85% | 45% | 81% |
| What data are visualised on the map? | 90% | 70% | 95% | 80% | 73% | 82% |
| What symbols are used to visualise the data on the map? | 80% | 65% | 80% | 45% | 64% | 67% |
| Does this map contain a legend? | 70% | 95% | 85% | 50% | 82% | 76% |
| Is the legend consistent with the visualised data? | 90% | 90% | 75% | 40% | 64% | 72% |
| What is the spatial scale of the map? | 30% | 30% | 50% | 35% | 55% | 40% |
| Average per model | 80% | 77% | 76% | 58% | 69% |
For the map comparison task, we found the constrained response accuracy, from highest to lowest, to be as follows: GPT-4o (86%), Gemini 2.0 Flash (85%), Qwen-VL-Max (81%), Pixtral Large (74%), and Claude Sonnet 3.5 (73%). The constrained response accuracy per question for the map comparison task is shown in Table 2. We can observe that the performance in this task is better than in map interpretation. This could either be because the second image acts as additional context or reference, helping the model to provide accurate answers, or because the maps used for this task are less complex. The models achieved the highest average accuracy for the question on legend similarity, further reinforcing the impression that VLMs can effectively identify the map legend as a distinct object. All models scored lowest on the question Do the two maps visualise the same data in the same positions?. Our dataset included a map with data points shifted by several pixels compared to the original, but no model identified the difference. Claude Sonnet 3.5 responded that there was a difference in the data positions, but justified its answer by mentioning a difference in the distribution of colours. Moreover, when we presented two maps that show the same data but differ slightly in geographic extent (i.e. one map looks “zoomed in” compared to the other), Pixtral Large and GPT-4o interpreted this difference as a change in the visualised data pattern. This suggests they may be counting pixels rather than using object-based area quantification.
All models detected a difference in the units of measurement in the legend (cm instead of mm). GPT-4o, Pixtral Large, and Claude Sonnet 3.5 correctly identified a difference in the font, while GPT-4o and Gemini 2.0 Flash detected a change in the base map. All of these differences were detected by the models without explicitly asking for them in the prompt.
| Gemini 2.0 Flash | GPT-4o | Claude Sonnet 3.5 | Pixtral Large | Qwen-VL-Max | Average per question | |
| Are these maps about the same topic? | 100% | 100% | 63% | 79% | 74% | 83% |
| Do the maps have the same geographic extent? | 74% | 84% | 68% | 74% | 89% | 78% |
| Do the maps have the same orientation? | 89% | 79% | 84% | 74% | 79% | 81% |
| Do the two maps visualise the same data in the same positions? | 74% | 68% | 58% | 53% | 63% | 63% |
| Do the two maps have the same legend? | 89% | 95% | 89% | 74% | 89% | 87% |
| Do the two maps use the same symbols for the visualised data? | 84% | 89% | 74% | 89% | 89% | 85% |
| Average per model | 85% | 86% | 73% | 74% | 81% |
4 Discussion and Outlook
Our results show that VQA is a promising tool for assessing map reproducibility. No model performed equally well on all questions, but the accuracy values obtained during the evaluation suggest capabilities to assess the content of a reproduced map that go beyond pixel-wise comparison. Another advantage of using VQA to assess reproducibility is its independence from specific tools, as it is only the data format of the final cartographic product that matters and not whether we have used scripts or desktop GIS to produce it. The use of VQA for content-based map comparison offers a new approach to assessing the equivalence of geovisualisations, not only in the context of reproducibility, but also in other scenarios, such as creating equivalent visualisations for different audiences (e.g. the scientific community, policy makers, the general public).
Questions where the response accuracy values are particularly low (Tables 1, 2) indicate areas for future research so that the models can come to the point where they can be confidently used in automated assessment workflows. Also, the reasons that affect the performance of a model (e.g. impact of the number of parameters, training process) should be systematically investigated in future work before its integration into these workflows.
Furthermore, two key conceptual issues must be addressed before integrating a VQA approach into automated systems. First, ensuring transparency throughout the entire assessment process is essential, which poses a challenge when working with VLMs/LLMs. If integrated into an automated assessment system, a model should be explainable to ensure fairness in automated decisions and to promote trust [2]. At the moment, the best model is Gemini 2.0 Flash, based on both speed and constrained response accuracy. However, relying on closed-source, proprietary models for such tasks contradicts the principles of open science. An automated reproducibility assessment system should itself be verifiable before it is used to verify scientific outcomes. To achieve this, we need open-source models with better performance. Another issue to resolve before automating the reproducibility evaluation process is determining the threshold for success. In this paper, we have based this evaluation on the similarity of the reproduced map to the original. While this comparison is necessary to confirm reproducibility, it is not sufficient on its own; factors such as the accessibility of materials and the computational effort required for reproduction also indicate how reproducible a study is. While moving beyond pixel-based comparisons is a step forward, the question remains: how should reproducibility and reproduction success be quantified?
Future research should continue to advance our understanding of map comparison and VQA capabilities. One potential avenue for exploration involves investigating alternative comparison strategies other than the yes/no question approach that we followed. For example, we could perform text similarity computations on the answers, and examine additional comparison dimensions such as the units of measurement or the basemap. The set of questions used in this study was deliberately kept simple in order to have a consistent evaluation of the VLMs’ responses across the different maps in our dataset and to establish an initial baseline for VLM evaluation. Developing more sophisticated and context-specific questions is part of our future work. Additionally, exploring the ability to accurately retrieve specific data values from different positions on the map presents another promising area for future research. It is also worth investigating the extent to which VLM responses are based on the textual elements on the maps and how well VQA would perform on maps with no or very little text.
Overall, the ability to get accurate descriptions of maps with VQA is remarkable not only for map reproducibility assessment, but also because it opens up new ways for visually impaired people to access information for the first time. It is also a step towards the democratisation of science, where VQA can be used by the public to get explanations of scientific geovisualisations [4].
Limitations
There are several limitations to our work. Firstly, we set the maximum number of output tokens to 128, with an option to extend it to 160. This means that the models might have hallucinated more (i.e. presented false information as fact [10]) or might have come to a different conclusion if we had allowed a higher limit. It is necessary to assess the sensitivity of the results to the maximum number of output tokens by setting different limits, evaluating the outcomes, and determining whether the results remain consistent across different limits. Furthermore, constrained response accuracy is only an initial measure of the models’ performance. We did not develop specific metrics for conciseness, focus, or completeness, only qualitative notes were taken during the evaluation. Finally, the comparison task focused on maps varying along a single dimension, as mentioned in Section 2. The performance of VLMs on maps that differ across multiple dimensions, which adds complexity to this task, remains to be tested.
5 Summary
In this paper, we investigated the ability of five popular VLMs (Gemini 2.0 Flash, GPT-4o, Claude Sonnet 3.5, Pixtral Large, Qwen-VL-Max) to discriminate, interpret, and compare geographic maps using VQA. We compiled a set of 40 chart images (20 maps and 20 charts of other types) to test whether the VLMs can distinguish between maps and non-maps. Subsequently, we evaluated the VLMs using only the map images by asking questions covering eight dimensions of map interpretation. After confirming the potential of these models for interpreting geographic maps, we proceeded to evaluate their map comparison capabilities by providing two maps as input and asking questions about their identified differences across six dimensions relevant to assessing map reproduction [17]. For the comparison task, we used 20 maps that differ in only one dimension. While preliminary, our results show that all five VLMs already possess spatial understanding and map reading skills. Our next steps in this line of research will aim to improve the models’ performance and to develop more sophisticated strategies for comparing maps and quantifying their differences. Ultimately, we are working towards integrating VQA into systems that automate map reproduction assessment and support scientific fact-checking, enabling reproducibility reviewers to quickly verify scientific results.
References
- [1] Andrew R. Akbashev and Sergei V. Kalinin. Tackling overpublishing by moving to open-ended papers. Nature Materials, 22(3):270–271, March 2023. Publisher: Nature Publishing Group. doi:10.1038/s41563-023-01489-1.
- [2] Alejandro Barredo Arrieta, Natalia Díaz-Rodríguez, Javier Del Ser, Adrien Bennetot, Siham Tabik, Alberto Barbado, Salvador Garcia, Sergio Gil-Lopez, Daniel Molina, Richard Benjamins, Raja Chatila, and Francisco Herrera. Explainable Artificial Intelligence (XAI): Concepts, taxonomies, opportunities and challenges toward responsible AI. Information Fusion, 58:82–115, June 2020. doi:10.1016/j.inffus.2019.12.012.
- [3] Alexander Bendeck and John Stasko. An Empirical Evaluation of the GPT-4 Multimodal Language Model on Visualization Literacy Tasks. IEEE Transactions on Visualization and Computer Graphics, 31(1):1105–1115, January 2025. Conference Name: IEEE Transactions on Visualization and Computer Graphics. doi:10.1109/TVCG.2024.3456155.
- [4] Sibusiso Biyela, Kanta Dihal, Katy Ilonka Gero, Daphne Ippolito, Filippo Menczer, Mike S. Schäfer, and Hiromi M. Yokoyama. Generative AI and science communication in the physical sciences. Nature Reviews Physics, 6(3):162–165, March 2024. doi:10.1038/s42254-024-00691-7.
- [5] Wei-Lin Chiang, Lianmin Zheng, Ying Sheng, Anastasios N. Angelopoulos, Tianle Li, Dacheng Li, Banghua Zhu, Hao Zhang, Michael I. Jordan, Joseph E. Gonzalez, and Ion Stoica. Chatbot arena: an open platform for evaluating LLMs by human preference. In Proceedings of the 41st International Conference on Machine Learning, volume 235 of ICML’24, pages 8359–8388, Vienna, Austria, July 2024. JMLR.org.
- [6] Anthony G Cohn and Robert E Blackwell. Evaluating the Ability of Large Language Models to Reason About Cardinal Directions. In Benjamin Adams, Amy L. Griffin, Simon Scheider, and Grant McKenzie, editors, 16th International Conference on Spatial Information Theory (COSIT 2024), volume 315 of Leibniz International Proceedings in Informatics (LIPIcs), pages 28:1–28:9, Dagstuhl, Germany, 2024. Schloss Dagstuhl – Leibniz-Zentrum für Informatik. ISSN: 1868-8969. doi:10.4230/LIPIcs.COSIT.2024.28.
- [7] Yu Feng, Linfang Ding, and Guohui Xiao. GeoQAMap - Geographic Question Answering with Maps Leveraging LLM and Open Knowledge Base. In Roger Beecham, Jed A. Long, Dianna Smith, Qunshan Zhao, and Sarah Wise, editors, 12th International Conference on Geographic Information Science (GIScience 2023), volume 277 of Leibniz International Proceedings in Informatics (LIPIcs), pages 28:1–28:7, Dagstuhl, Germany, 2023. Schloss Dagstuhl – Leibniz-Zentrum für Informatik. ISSN: 1868-8969. doi:10.4230/LIPIcs.GIScience.2023.28.
- [8] Amy L. Griffin, , and Anthony C. Robinson. How do people understand maps and will AI ever understand them? International Journal of Cartography, 0(0):1–8, 2025. Publisher: Taylor & Francis. doi:10.1080/23729333.2025.2481692.
- [9] Majid Hojati and Rob Feick. Large Language Models: Testing Their Capabilities to Understand and Explain Spatial Concepts. In Benjamin Adams, Amy L. Griffin, Simon Scheider, and Grant McKenzie, editors, 16th International Conference on Spatial Information Theory (COSIT 2024), volume 315 of Leibniz International Proceedings in Informatics (LIPIcs), pages 31:1–31:9, Dagstuhl, Germany, 2024. Schloss Dagstuhl – Leibniz-Zentrum für Informatik. ISSN: 1868-8969. doi:10.4230/LIPIcs.COSIT.2024.31.
- [10] Lei Huang, Weijiang Yu, Weitao Ma, Weihong Zhong, Zhangyin Feng, Haotian Wang, Qianglong Chen, Weihua Peng, Xiaocheng Feng, Bing Qin, and Ting Liu. A Survey on Hallucination in Large Language Models: Principles, Taxonomy, Challenges, and Open Questions. ACM Transactions on Information Systems, 43(2):1–55, March 2025. arXiv:2311.05232 [cs]. doi:10.1145/3703155.
- [11] Yuhan Ji and Song Gao. Evaluating the Effectiveness of Large Language Models in Representing Textual Descriptions of Geometry and Spatial Relations. In Roger Beecham, Jed A. Long, Dianna Smith, Qunshan Zhao, and Sarah Wise, editors, 12th International Conference on Geographic Information Science (GIScience 2023), volume 277 of Leibniz International Proceedings in Informatics (LIPIcs), pages 43:1–43:6, Dagstuhl, Germany, 2023. Schloss Dagstuhl – Leibniz-Zentrum für Informatik. ISSN: 1868-8969. doi:10.4230/LIPIcs.GIScience.2023.43.
- [12] Peter Kedron, Sarah Bardin, Joseph Holler, Joshua Gilman, Bryant Grady, Megan Seeley, Xin Wang, and Wenxin Yang. A Framework for Moving Beyond Computational Reproducibility: Lessons from Three Reproductions of Geographical Analyses of COVID-19. Geographical Analysis, 56(1):163–184, 2024. doi:10.1111/gean.12370.
- [13] Rob Kitchin. The practices of mapping. Cartographica, 43(3):211–215, September 2008. doi:10.3138/carto.43.3.211.
- [14] Rob Kitchin, Chris Perkins, and Martin Dodge. Thinking about maps. In Rethinking Maps: New Frontiers in Cartographic Theory. Routledge, New York, NY, USA, 2009.
- [15] Markus Konkol, Christian Kray, and Max Pfeiffer. Computational reproducibility in geoscientific papers: Insights from a series of studies with geoscientists and a reproduction study. International Journal of Geographical Information Science, 33(2):408–429, February 2019. Publisher: Taylor & Francis. doi:10.1080/13658816.2018.1508687.
- [16] Eftychia Koukouraki and Christian Kray. Map Reproducibility in Geoscientific Publications: An Exploratory Study. In Roger Beecham, Jed A. Long, Dianna Smith, Qunshan Zhao, and Sarah Wise, editors, 12th International Conference on Geographic Information Science (GIScience 2023), volume 277 of Leibniz International Proceedings in Informatics (LIPIcs), pages 6:1–6:16, Dagstuhl, Germany, 2023. Schloss Dagstuhl – Leibniz-Zentrum für Informatik. ISSN: 1868-8969. doi:10.4230/LIPIcs.GIScience.2023.6.
- [17] Eftychia Koukouraki and Christian Kray. A systematic approach for assessing the importance of visual differences in reproduced maps. Cartography and Geographic Information Science, 0(0):1–16, 2024. Publisher: Taylor & Francis. doi:10.1080/15230406.2024.2409920.
- [18] National Academies of Sciences, Engineering, and Medicine. Reproducibility and Replicability in Science. National Academies Press, Washington, D.C., September 2019. Pages: 25303. doi:10.17226/25303.
- [19] Frank O. Ostermann, Daniel Nüst, Carlos Granell, Barbara Hofer, and Markus Konkol. Reproducible Research and GIScience: An Evaluation Using GIScience Conference Papers. In Krzysztof Janowicz and Judith A. Verstegen, editors, 11th International Conference on Geographic Information Science (GIScience 2021) - Part II, volume 208 of Leibniz International Proceedings in Informatics (LIPIcs), pages 2:1–2:16, Dagstuhl, Germany, 2021. Schloss Dagstuhl – Leibniz-Zentrum für Informatik. ISSN: 1868-8969. doi:10.4230/LIPIcs.GIScience.2021.II.2.
- [20] Scheider Simon, Jim Jones, Alber Ipia, and Carsten Keßler. Encoding and Querying Historic Map Content. In Joaquín Huerta, Sven Schade, and Carlos Granell, editors, Connecting a Digital Europe Through Location and Place, 2014. doi:10.1007/978-3-319-03611-3_15.
- [21] Edward Tufte. The visual display of quantitative information. Cheshire: Graphic Press, 2001.
- [22] Kristýna Vlková, Vladimír Zýka, Cristian Remus Papp, and Dušan Romportl. An ecological network for large carnivores as a key tool for protecting landscape connectivity in the Carpathians. Journal of Maps, 20(1):2290858, December 2024. Publisher: Taylor & Francis. doi:10.1080/17445647.2023.2290858.
- [23] Jinwen Xu and Ran Tao. Map Reading and Analysis with GPT-4V(ision). ISPRS International Journal of Geo-Information, 13(4):127, April 2024. Number: 4 Publisher: Multidisciplinary Digital Publishing Institute. doi:10.3390/ijgi13040127.
- [24] Lu Ying, Yingcai Wu, and Jean-Daniel Fekete. Exploring the Reproducibility for Visualization Figures in Climate Change Report. In Helen-Nicole Kostis, Mark SubbaRao, Yvonne Jansen, and Robert Soden, editors, IEEE VIS 2024 Workshop on Visualization for Climate Action and Sustainability, October 2024. URL: https://inria.hal.science/hal-04744236.