Guiding Geospatial Analysis Processes in Dealing with Modifiable Areal Unit Problems

Abstract
Geospatial analysis has been widely applied in different domains for critical decision making. However, the results of spatial analysis are often plagued with uncertainties due to measurement errors, choice of data representations, and unintended transformation artifacts. A well known example of such problems is the Modifiable Areal Unit Problem (MAUP) which has well documented effects on the outcome of spatial analysis on area-aggregated data. Existing methods for addressing the effects of MAUP are limited, are technically complex, and are often inaccessible to practitioners. As a result, analysts tend to ignore the effects of MAUP in practice due to lack of expertise, high cognitive loads, and resource limitations. To address these challenges, this paper proposes a machine-guidance approach to augment the analyst’s capacity in mitigating the effect of MAUP. Based on an analysis of practical challenges faced by human analysts, we identified multiple opportunities for the machine to guide the analysts by alerting to the rise of MAUP, assessing the impact of MAUP, choosing mitigation methods, and generating visual guidance messages using GIS functions and tools. For each of the opportunities, we characterize the behavior patterns and the underlying guidance strategies that generate the behavior. We illustrate the behavior of machine guidance using a hotspot analysis scenario in the context of crime policing, where MAUP has strong effects on the patterns of crime hotspots. Finally, we describe the computational framework used to build a prototype guidance system and identify a number of research questions to be addressed. We conclude by discussing how the machine guidance approach could be an answer to some of the toughest problems in geospatial analysis.
Keywords and phrases:
Machine Guidance, Geo-Spatial Analysis, Modifiable Areal Unit Problem (MAUP)Copyright and License:
2012 ACM Subject Classification:
Information systems Geographic information systems ; Information systems Spatial-temporal systems ; Computing methodologies Artificial intelligenceEditors:
Katarzyna Sila-Nowicka, Antoni Moore, David O'Sullivan, Benjamin Adams, and Mark GaheganSeries and Publisher:
1 Introduction
Geospatial analysis plays a critical role in a range of domains [30]. For example, public health professionals used geospatial analysis to track disease outbreaks and plan interventions. During the COVID-19 pandemic, analysts used GISystems to map infection hotspots, model transmission patterns, and allocate healthcare resources efficiently [38]. Practical applications of geospatial analysis in these professional domains involve complicated processes of managing multiple datasets, selecting appropriate spatial scales and methods for analysis, and interpreting geographic patterns. This can be extremely challenging for people without adequate GIS expertise [54] and spatial thinking skills [31, 36, 34].
Due to the unique nature of geographical data, spatial analysis results often suffer from uncertainties in data accuracies, measurement frameworks, transformation artifacts, and spatial heterogeneity [40]. Addressing these uncertainties is essential for ensuring reliable conclusions and decisions. In particular, the Modifiable Areal Unit Problem (MAUP) [20, 51] is a well-known issue that often makes the results of a spatial analysis unreliable. Although the concept of MAUP and related factors is well documented, most analysts choose to ignore MAUP effects in practice due to lack of expertise, high cognitive loads, and resource constraints [50, 26]. Even if analysts are committed to addressing the effects of MAUP, there is very little help and guidance on how to decide the proper strategies and methods in a specific problem-solving context.
To bridge this skill gap for addressing modifiable area unit problem in spatial analysis, we propose a machine guidance approach that captures the knowledge and experience necessary for dealing with MAUP into an intelligence agent. While human analysts conduct spatial analysis, a machine guidance agent is capable of monitoring the progression of the spatial analysis process and volunteers help and guide in two ways: (1) detect situations where MAUP takes effect and (2) direct users to take proactively measures to mitigate its impact on analytical results. Designing such a machine guidance agent requires that we answer a number of research questions:
-
1.
Why do analysts tend to ignore MAUP in spatial analysis? We identified seven (7) reasons why people failed to address MAUP effectively (see Section 3.3). This analysis provides us insights on opportunities for machine guidance.
-
2.
What factors contribute to the level of MAUP effects? The effects of MAUP on analytical results could range from negligible to serious depending on the degree of spatial autocorrelation and spatial heterogeneity, data aggregation methods, and the choices of scale and area units (see Section 3.1). Understanding these causal factors leads to ideas and methods to mitigate MAUP effects.
-
3.
What are the methods and tools available to address the effects of MAUP? We synthesize the scattered literature and identify eight methods that are used to help analysts understand the nature and extent of MAUP effects and minimize the effects on the analysis (see Section 3.2). Using these methods requires a significant level of GIS expertise and is cognitively challenging.
-
4.
What are the opportunities and strategies of machine guidance in addressing MAUP? Machine guidance exhibits helpful behavior that should be offered only when MAUP arises and when users need help mitigating the effects of MAUP. We identify seven recognizable opportunities and prescribe guidance strategies for them (see Section 4).
-
5.
How would users (analysts) experience machine guidance? We demonstrate how users experience guidance by presenting a scenario of use in the context of crime hotspot analysis where the machine guidance agent helps the analyst in dealing with the MAUP. Through the scenario, we gain insight into the expected behaviors of machine guidance.
-
6.
How can we enable machine guidance computationally? We show how machine guidance can be enabled computationally by a software agent that can engage with users in collaborative problem solving. Our computational framework was inspired by guidance research in visual analytics [10, 11], advances in mixed-initiative interfaces [53], and intention-based interactions with GIS [9].
By answering the above research questions systematically, this paper contributes to a theoretical foundation of machine guidance in GIScience research. Developing machine guidance tools for geospatial analysis is our long-term goal, and we provide here an initial framework for exploring the design challenges in both conceptual and computational levels.
2 Machine Guidance Approach to Address the MAUP
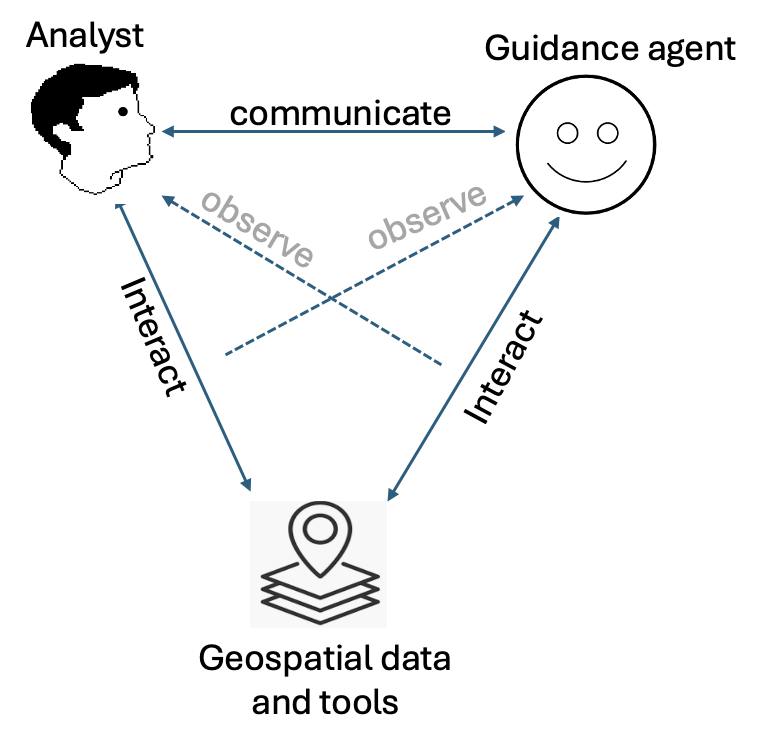
Machine guidance is an active process of addressing the cognitive challenges and expertise gaps of users that hinder their analytical progress [11]. This approach argues for solving complex and difficult problems by bringing human and computer into a collaborative work relationship [61]. Collaboration is a process in which two or more agents work together to achieve a shared goal. In our case, we introduce a machine guidance agent to partner with a human agent in spatial analytic activities.
Figure 1 shows the collaborative relationship between human analysts and the guidance agent. A machine guidance agent is an intelligent computational agent that actively assists users during analytical processes by offering contextual guidance, recommendations, and feedback [12]. It can recognize when the analyst encounters difficulties and how to help [11] by integrating reasoning, planning, and communication.
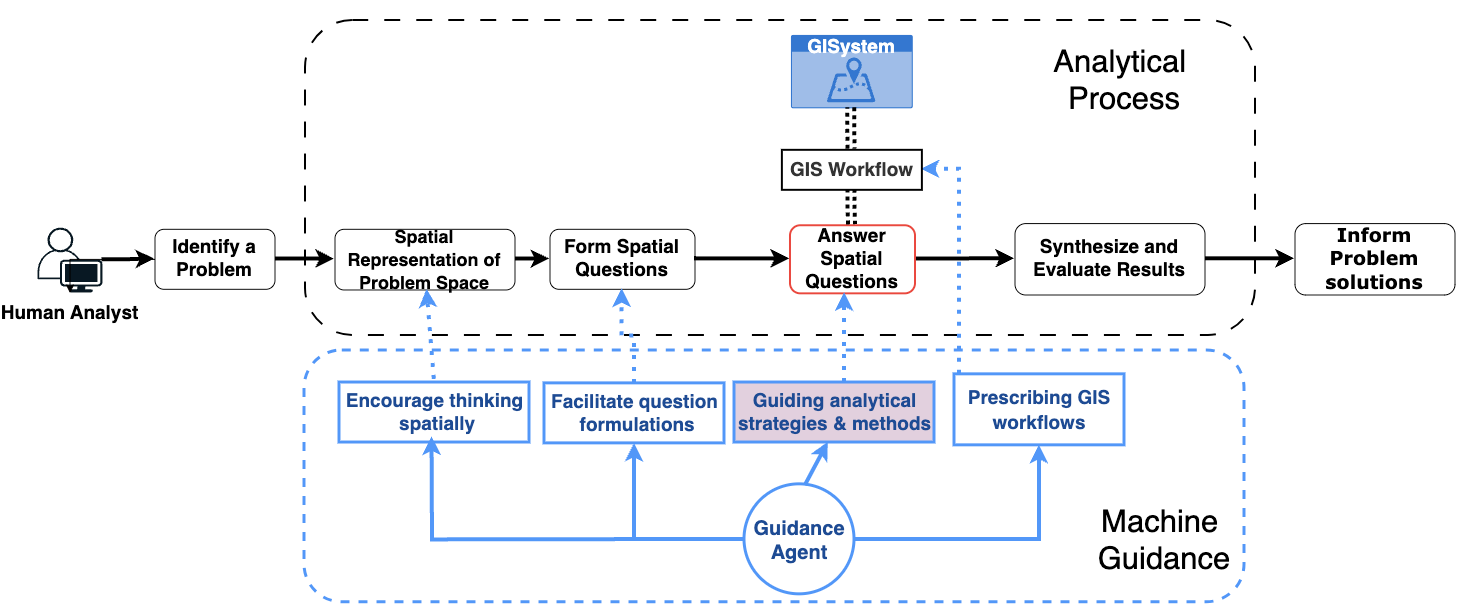
A key capability of a machine guidance agent is to monitor the progression of a spatial analysis process and to volunteer help and guide when needed. As illustrated in Figure 2, the process of solving a domain-specific problem using geospatial analysis generally starts with developing a spatial representation of the problem, followed by the formulation of spatial questions and the assembly of analytical GIS workflows. Throughout this process, a machine guidance agent works alongside to assert necessary guidance when the human analyst gets lost in navigating the problem and solution space and to steer users away from any dangers and risks under uncertainties.
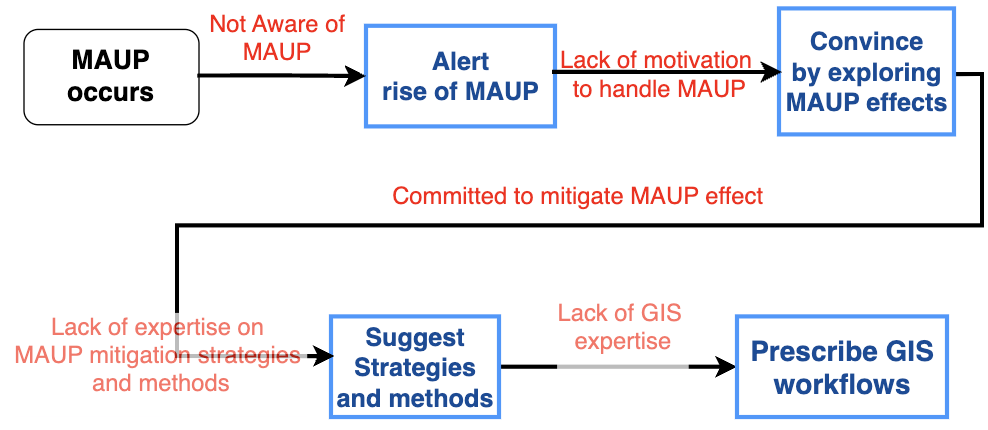
The task of guiding analysts in dealing with MAUP effects is the responsibility of the box labeled Guiding Analytical Strategies and Methods. Zooming into this box, our current work aims at the following two objectives (also summarized in Figure 3):
-
Obj-1
Building awareness of MAUP effects. The guidance agent actively monitors the analytical process to identify indicators of MAUP occurrences (such as the use of area-aggregated data for analysis). When an MAUP issue occurs, the guidance agent should alert its dangers and potential effects. If the analyst ignores it or is reluctant to address it, the guidance agent plays a role in convincing the analyst to do more exploration to understand the effects on the analytical conclusions.
-
Obj-2
Bridging the gaps of expertise in mitigating MAUP effects. If the analyst is committed to addressing the MAUP effects, the guidance agent will direct or assist the process of experimenting with multiple spatial units and scales, applying various methods to verify and confirm the choices of area units, and prescribing GIS workflows for proper implementation. Machine guidance simplifies this process by automating repetitive tasks, providing statistical references, and offering immediate feedback on potential solutions. This allows analysts to focus on steering the analysis to achieve confident results.
Given the above objectives, it is important to establish a deep understanding of how MAUP arises in spatial analysis, what factors contribute to the serenity of MAUP effects, and what methods and tools are available to explore and mitigate MAUP effects. We will answer the above questions through synthesizing the literature.
3 Nature of the Modifiable Areal Unit Problem (MAUP)
Many applications of geospatial analysis use area-aggregated data as the primary unit of analysis [64, 33]. Data aggregation by area units smooths out local variations, potentially masking important spatial patterns and heterogeneity within areal units. Spatial analysis using area-aggregated data often relies on the assumption of internal uniformity within each area unit. This assumption is rarely true in real world contexts, where factors such as population density, land use, and environmental conditions can vary considerably within a single region. A key issue stems from the wide variety of potential spatial units available for analysis, including administrative boundaries, census tracts, natural zones, and regular grids. The results of spatial analyses can differ markedly depending on which of these areal units is selected. Openshaw [49] demonstrated this phenomenon by showing how correlation coefficients changed when smaller spatial units were aggregated into larger ones. His findings revealed that correlation values can fluctuate between different spatial scales. This effect, known as the Modifiable Areal Unit Problem (MAUP), undermines the credibility of analyses based on arbitrarily chosen spatial units, casting doubt on the reliability and validity of the resulting conclusions.
The effects of MAUP on analytical results could range from negligible to very serious. This variability of MAUP effects can be explored by comparing analytical results on different spatial scales (thus the scale effect [27]) or using different zoning schemes (thus zoning effects [18]). Fotheringham and Wong [25] demonstrated that spatial aggregation introduces biases that vary depending on the chosen scale. This highlights how the choice of spatial scale significantly impacts analytical outcomes, emphasizing the importance of selecting an appropriate scale for an analysis. The zoning effect, on the other hand, arises from the specific configuration of spatial units. Even with the same number of zones, different boundary arrangements can produce drastically different statistical outcomes. Openshaw and Taylor [50] experimented with the use of alternative configurations of counties to compute the strength of correlation and they showed that the results of correlation coefficients ranging from 0.265 to 0.862, highlighting the inherent instability in spatial analysis.
3.1 Factors that Cause MAUP Effects
Although MAUP is a general concern in spatial analysis, the actual effect of MAUP on the validity of spatial analysis results could be negligible in some cases and highly problematic in other cases. It is very important to understand the key factors that contribute to the magnitudes of MAUP effects. Here, we synthesize the literature and highlight four major factors.
-
F1
The Nature of Boundaries of Area Units. The boundaries of area units could be functional (e.g., natural regions, watersheds, transportation zones) or arbitrary (for example, grids, hexigon). Spatial analysis should avoid arbitrary delineated area boundaries and align with natural boundaries when possible [63]. For example, in crime mapping, the use of square grids can cut through natural neighborhoods, distorting patterns. Instead, mapping crime hotspots using police districts or neighborhoods tends to generate more reliable results.
-
F2
Data Aggregation Methods. Data aggregation methods, such as summing, averaging, or interpolation, determine how data values are combined within spatial units. Different aggregation methods affect both the scale effect (how the results change with different levels of aggregation) and the zoning effect (how results change with different boundary configurations) [37]. The choice of data aggregation methods directly influences the representation and interpretation of spatial patterns, adding another layer of complexity to the MAUP.
-
F3
The Degree of Spatial Autocorrelation. Spatial autocorrelation reflects the similarity between nearby observations. When strong positive spatial autocorrelation is present, neighboring areas tend to have similar values. Aggregating them into larger units inflates spatial dependence, potentially exaggerating trends [41]. The size of areal units significantly influences the strength of spatial autocorrelation, with larger units generally exhibiting lower levels of autocorrelation compared to smaller ones [14]. If data is aggregated into arbitrary zones, highly autocorrelated spatial data can produce misleading results, as patterns depend on the aggregation scheme rather than the underlying process [47].
-
F4
The Scales and Complexities of Spatial Processes. Spatial processes are mechanisms that generate observable patterns. Examples include natural processes (e.g. erosion and climate change) [19, 52] or human-driven processes (such as migration and urban expansion) [4, 3]. These processes shape spatial patterns across geographical spaces [17]. Since each process operates in a certain scale, the pattern they generate is likely to be in similar scale. Therefore, choosing area units for analysis should consider the alignment with the scales of the underlying processes of the observed patterns [24]. If the chosen area unit in a spatial analysis is inconsistent with the scale of the processes, the effect of MAUP would be worse. What complicates the above rule is that the patterns of real-world phenomena may be the result of multiple processes at different scales interacting in space [65]. This could make any choice of area units seem arbitrary [25].
-
F5
Impact of Spatial Heterogeneity. Spatial heterogeneity refers to the variation in spatial patterns, relationships, and statistical properties at different locations in a study area. This implies that the processes governing spatial phenomena do not operate uniformly across space, leading to location-dependent variations in data distributions and relationships. Spatial heterogeneity violates the stationarity assumptions by many statistical models, such as Ordinary Least Squares (OLS) regression, which assume that the relationships between variables are constant across space. The degree of spatial heterogeneity can change depending on the spatial scale or level of aggregation. Aggregating data into larger units (e.g., counties versus census tracts) may mask local variations and distort spatial patterns, which could lead to larger MAUP effects [37].
3.2 Methods for Addressing MAUP
Methods for addressing the MAUP target its underlying causes identified in the last section. Some of the methods (such as sensitivity analysis and multi-scale analysis) help analysts to understand the extent of MAUP effects. Other methods help to choose appropriate area units to mitigate the effects of MAUP by tackling the causal factors of MAUP (as listed in Section 3.1). We discuss a few commonly used methods and their contexts of use.
-
M1
Multi-Scale Analysis conducts analyses at multiple spatial scales. A multi-scale analysis typically begins with small-scale spatial units and then aggregates to larger units as necessary. This strategy ensures that event concentrations at both micro and macro levels are captured, aligning with the analytical context and addressing practical limitations such as data availability and collection challenges [5]. For example, Jelinski [37] used this method to assess how changes in spatial resolution from census tracts to counties affect statistical results.
-
M2
Sensitivity Analysis. Sensitivity analysis runs the same analysis at multiple times by systematically varying the boundary configurations (e.g., administrative zones vs. equal-area grids vs. hexagons) of area units to test the stability of results [49]. For example, voting analysis may be repeated on changing district boundaries to see if electoral outcomes remain stable under different zoning schemes. The method can help to draw the analyst’s attention to the serenity of MAUP effects [50].
-
M3
Fitness of Use. Instead of seeking a single “best” unit, analysts should consider the fitness for use as the principle when choosing area units for aggregation. For example, analyzing crime hotspots for policing decisions should consider what spatial zones used for deciding police dispatching decisions. If police ward precincts areas are used for dispatching police, then, analysis should use ward precincts areas if possible. The condition is that the choice is adequate for fulfilling the analytical objectives in a given context [42, 15].
-
M4
Respect Scales and Boundaries of Spatial Processes. Based on our understanding of the relationship between the nature of spatial processes and MAUP effects (F4), the choice of area unit and aggregation scale should reflect the properties of the underlying processes that created the patterns in the data [24]. Because application domains are concerned with different phenomena and different analytical goals, the choice of spatial units is likely to be domain-specific and goal-specific. If we know that a process is operating at a particular scale, then, the choice of spatial units for analysis should respect that scale. Similarly, if the process underlying a pattern create certain boundary conditions, the choice of area unit boundaries for analysis should also respect the this property to minimize the effect of MAUP due to (F1). For example, Buzzelli [7] used census data to study the correlation of patterns between residents of chinese origin and indian origin and he hinted on the need for interpretive skills of a human geographer to draw insights from residential segregation processes.
-
M5
Spatial Smoothing Techniques. Spatial smoothing techniques help mitigate the effects of the Modifiable Areal Unit Problem (MAUP) by reducing abrupt variations caused by arbitrary spatial unit definitions. For example, Kelsall and Wakefield [39] used kernel density estimation to create continuous surfaces from discrete areal data. Spatial interpolation techniques (e.g., Kriging and Inverse Distance Weighting) predicts values at unsampled locations, reducing dependency on arbitrary zone definitions. This method is to used to mitigate the effect of MAUP due to (F3).
-
M6
Measuring Spatial Non-Stationarity and Local Variations. To address the impact of spatial heterogeneity to MAUP effect, measures of spatial non-stationarity and Local Variations, such as Geographically Weighted Regression (GWR) [6], Local Moran’s I [2], and Getis-Ord Gi [28], provide insight on the level of local variations. This insight could help the analysts to choose spatial units for analysis to reduce the impact of MAUP.
-
M7
Exploratory Spatial Data Analysis (ESDA) techniques. ESDA methods can be used to detect and mitigate MAUP effects by evaluating spatial patterns at multiple scales and aggregations. For example, by computing and visualizing Moran’s I [2] for different aggregation levels, analysts can get a sense if spatial autocorrelation remains stable across scales. If stable, the results are less affected by MAUP. If Moran’s I fluctuates, it suggests strong MAUP effects. ESDA techniques provides insights into the spatial structure and helps identify appropriate scales for analysis. Visualization methods can be used to compare and analyze differences and variations in results [50, 25].
3.3 Practical Challenges of Addressing Modifiable Areal Unit Problems
Despite the rich set of methods to understand and mitigate the MAUP effect (as reviewed in Section 3.2), the effect of MAUP in practical spatial analysis is often overlooked, ignored, or not adequately addressed [25, 18]. This behavior can be explained by understanding the challenges faced by human analysts when dealing with MAUP effects. Here, we discuss seven (7) challenges that explain why people fail to address MAUP effectively.
-
C1
Lack of Awareness. Human analysts keep their attention on answering analytical questions [31]. They may not be aware at the time when an MAUP issue arises. When a stage of spatial analysis involves the use of area-aggregated data, an analyst may not understand how MAUP can affect their analysis. This happens to people even if they have learned MAUP in geography and GIS courses [16, 47].
-
C2
Perceived Insignificance of MAUP. Even when analysts are fully aware of the presence of MAUP-related issues in their analysis, they may choose to ignore them, believing that the impact is too minor to justify the effort required to address it. This belief was partially established by prior research findings. For example, Openshaw [50] showed that the effects of MAUP are often subtle and context-dependent, making it easy to dismiss its importance. Dark and Bram [18] found that the analyst often hold a wrong belief that the conclusions drawn on one scale or zoning scheme will hold on for the other, although this is rarely the case. This has led some analysts to choose not to act on MAUP issues.
-
C3
Data Availability. Exploring the effect of MAUP on spatial analytic outcome requires the availability of data at different scales of area aggregation and different zoning schemes. In reality, data are often available only at specific administrative or aggregated levels (e.g., census tracts, districts), limiting the ability to analyze at finer resolutions. High-resolution data and individual-level data can be difficult to obtain [20, 25, 60]. Wong [64] noted that researchers frequently rely on preaggregated data due to privacy concerns, cost, or logistical constraints, which restricts their ability to address MAUP.
-
C4
Practical Constraints. Applying GIS methods (as discussed in section 3.2) to mitigate the MAUP effects costs time, computing resources, and human effort. In real world practices, analysts are often under pressure to deliver actionable results and have limited time and resources, making it impractical for analysts to fully explore how scale or zoning choices influence results [18].
-
C5
Convenience of Choice on Default Spatial Units. Analysts often use default spatial units (e.g. administrative boundaries) for convenience without considering their appropriateness for the analysis. Dark and Bram [18] argue that administrative boundaries are often arbitrary and may not be aligned with the underlying spatial processes being studied.
-
C6
Lack of Expertise in Applying Complex Methods. As noted in Section 3.2, addressing MAUP requires a thorough understanding of the available methods, the conditions under which specific methods can be applied, and how to implement them using matched tools in a GIS. The expertise in choosing and applying the appropriate methods to practical problems is rarely available to most analysts.
-
C7
Lack of Tool Support. Methods for mitigating MAUP effects are challenging to practice because they require support from GIS tools. Although relevant analytical tools are available in popular GISystems, such as ArcGIS, they are not structured and streamlined for the purpose of dealing with MAUP effects. The application-dependent nature of MAUP effects makes it difficult to design tool support.
Machine guidance can help human analysts overcome each of the above challenges to achieve reliable and confident analytical results. Machine guidance can monitor the spatial analytical process and alert analysts when the MAUP effect comes into play (C1), convince them by showing them the danger of not addressing MAUP (C2, C3, C4, C5), and provide suggestions on proper methods and tools to mitigate MAUP effects (C6, C7).
4 When and How to Guide?
Given the inherent complexities and challenges of addressing MAUP, there are critical moments where machine guidance can effectively assist analysts. In this section, we use the seven key challenges in addressing MAUP (as outlined in Section 3.3) to pinpoint critical moments when guidance is needed. Table 1 characterizes the possible guidance opportunities corresponding to the seven user challenges. For example, guidance can be inserted when the system detects that the analysis involves the use of area-aggregated data in geostatistical analysis (G1).
[Note: C1–C7 correspond to the user challenges described in Section 3.3. S1–S11 are guidance strategies described in Table 2.]
| User Challenges | Opportunities |
| C1: The analyst is unaware of the MAUP. | G1: The guidance should inform the analyst that the MAUP effects can be involved (S1) and thus encourage the analyst to explore more on its effects (S2, S3). |
| C2:The analyst does not know whether MAUP is critical in the current situation. | G2:The guidance assesses whether there is a significant effect of the MAUP. If yes, the analyst will be convinced to address the MAUP by showing what are the possible consequences if MAUP is not addressed (S2, S3). |
| C3: Limited data availability for exploring and mitigating the MAUP effects. | G3:The guidance can help the analyst by 1) looking for other data sets that are disaggregated and can be applied in the context (S4), and by 2) directing the analyst to consider other data processing and modeling methods (S5, S6). |
| C4: The analyst has limited time and resources. | G4:The guidance could recommend suitable methods that are less time consuming for the analyst to pursue (S4, S8, S9). The guidance could take initiative to generate results of multi-scale analysis and present them visually as an effort to alert and convince the analyst (S1, S2). |
| C5:The MAUP is not addressed due to convenience of use. | G5:The guidance examines whether applied units are appropriate by considering: 1) whether units are aligned with the spatial process in a given context (S9), 2) how much effects are involved based on statistical variations (S6), 3) simulating and comparing results using other units (S7). |
| C6:The analyst has trouble applying suitable methods to address the MAUP. | G6:Guidance can help the analyst determine which methods are helpful at the moment and automate the processing steps to reduce the complexities (S6, S7). |
| C7:The analyst has difficulties implementing suitable methods with GIS tools. | G7:Guiding the analyst by recommending proper GIS workflows tools to use (S11). If the analyst has a preference but does not know how to perform it, the guidance will assist the trasnlation of workflows into GIS procedures for a particular platform (S3, S6). |
To take advantage of the guidance opportunities identified in Table 1, the guidance agent must form intention to volunteer guidance and formulate a strategy to generate guidance messages. Table 2 describes the guidance strategies we use as design rationales for our guidance agent. For each strategy, we specify the goals that can be achieved and prescribe a recipe for action. These guidance strategies are consistent with the guidance objectives described in Figure 3. It is important to note that the guidance agent does not dictate how the analyst deals with the MAUP issue. If the agent believes that the effect of MAUP should be handled, the guidance agent will convince the analyst to do more explorations and suggest suitable methods and operations to mitigate the MAUP effects according to the prescribed action recipes.
| Strategy | Goal | Recipe for Action | Required Machine Knowledge |
| S1 | Alert the existence of MAUP | Use maps to show variations when different spatial units are used (M8). | Data availability Aggregation and visualization methods |
| S2 | Convince the analyst to explore more | Visualize the patterns of the spatial phenomenon and interacted factors (M8). | Data availability Knowledge on domain and phenomenon |
| S3 | Convince the analyst to explore more | Calculate and use statistical indicators to measure and inform possible effects (M8). | Data availability Aggregation and statistical methods |
| S4 | Mitigate the MAUP effects | Use disaggregated data instead (M5). | Data availability |
| S5 | Mitigate the MAUP effects | Use smoothing techniques (M6). | Data availability Spatial smoothing methods |
| S6 | Mitigate the MAUP effects | Use spatial models and statistics to consider the local variations (M7). | Data availability Spatial modeling methods |
| S7 | Recommend suitable units | Recommend suitable units by considering the statistical variations when using different units (M1, M2). | Analytical methods |
| S8 | Recommend suitable units | Choose units that are aligned with the analytical goal (M3). | Contextual knowledge Knowledge on domain and phenomenon |
| S9 | Recommend suitable units | Choose units that are aligned with the spatial process (M4). | Data availability Knowledge on domain and phenomenon Spatial process |
| S10 | Recommend suitable units | Measure the local variations to find suitable units (M7, M8). | Aggregation and statistical methods |
| S11 | Recommend suitable tools and workflow | Recommend suitable tools or workflow in addressing the MAUP. | Data availability Knowledge on domain and phenomenon Analytical methods |
It is important to emphasize that the set of strategies prescribed in Table 2 is a significant finding of this paper. It fills a knowledge gap between mitigation goals (Table 1) and GIS methods (described in Section 3.2). Despite the abundance of methods available to address MAUP, there has been little understanding of how to effectively match and apply these methods to specific mitigation goals. For example, multi-scale analysis (M1) and sensitivity analysis (M2) are frequently cited as methods useful for dealing with MAUP, but exactly how to apply them is a knowledge inaccessible to most analysts.
5 How Users Experience Machine Guidance?
To illustrate how a human analyst experiences interacting with the guidance system, we present a hypothetical scenario in which a public safety analyst uses geospatial analysis of crime hotspots to inform police actions.
Danny, a public safety analyst at the Baltimore City Police Department, is responsible for planning crime prevention strategies. He is charged with developing a police petrol plan on how to dispatch officers to neighborhoods based on crime hotspot patterns. Since the department has a limited number of police force to dispatch, it must ensure that the dispatch plan generates a measurable reduction in crime rates. It is very important that Danny derives reliable and trustworthy results from his analysis. He has access to ArcGIS Desktop and crime data from the last few months.
Danny is familiar with basic concepts and methods of GIS analysis, but he is not an expertise in GIS tools and algorithms. Danny is representative of a class of analysts who are experts in their fields but have limited or no knowledge of geospatial analysis methods and tools [48, 62]. These analysts lack specialized training in GIScience or have only surface knowledge of MAUP.
Danny has access to a crime incident dataset that contains ten types of crime (see the picture of MG 1 in Table 3). Each type of crime has different underlying mechanisms and processes that produce the crime patterns. Criminogenic situations can vary in scale, duration and impact, affecting entire regions or specific groups [23]. This raises challenges with respect to the selection of an appropriate spatial unit to identify hotspot areas [44].
| Dialogue | Guidance Visual Messages | |||||||||||||||
|
User 1: Let us take a look if crime patterns in Baltimore City have changed recently.
MG 1: We found 4,983 crime incidents in Baltimore City happened in the last two months. The map (MG 1) shows ten types of crime. User 2: Our police officers typically divide their responsibilities by neighborhoods. Let us find out where are the crime hot spots by neighborhoods. MG 2: As show on the map (MG 2), crime hotspots are noted by red circles. They are derived from crime density patterns by neighborhoods. User 3: Ok, that is what I need. I will proceed on using this hot spot patterns for police dispatch. MG 3: Wait! I would like to remind you that the pattern shown on MG 2 may not be reliable! Let me explain. If you aggregate crimes by census tracts (instead of neighborhoods), the hotspot pattern will look like the one in MG 3-a, which is significantly different. This is a well known problem in spatial analysis on area-aggregated data. MG 3-b shows strong local spatial dependencies, which indicates that your analytical results could be very unstable and could be misleading. User 4: This is so important to know! How can I make sure my results are reliable? MG 4: Let me help you to explore more. One way to find out if the hotspots on MG 2 are trustful is view crime density as continuous surface. MG 4 shows a Kernal Density pattern where A lighter color indicates higher density and vice versa. You may compare MG 2 with this density surface and make adjustment of hotspot regions. User 5: Thanks! I was able to determine those hotspots with good confidence. However, there are too many neighborhoods in the hotspot regions, and I need to prioritize those neighborhoods that are most troubled. MG 5: Sure. I can further gauge the strength of those hotspots using a measure called Getis-Ord Gi. The map (MG 5) shows the Gi measure for each neighborhood, indicating their relative degree of confidence as a hot spot. |
|
![[Uncaptioned image]](PicInSystem/Incidents.png)
![[Uncaptioned image]](PicInSystem/Nei-Density.png)
![[Uncaptioned image]](PicInSystem/CT-Density.png)
![[Uncaptioned image]](PicInSystem/NeiAuto1.png)
![[Uncaptioned image]](PicInSystem/KEDOverlap1.png)
![[Uncaptioned image]](PicInSystem/Hotspots.png)
Based on the narrative of the scenario above, we present a hypothetical sequence of interactions between the User (Danny) and the guidance agent (MG) in Table 3. This hypothetical dialogue showcases how machine guidance can systematically address MAUP by raising awareness, recommending alternative methods, and providing statistical support to improve decision making under practical constraints.
As Danny analyzes crime hotspots in neighborhoods, the guidance agent actively monitors the process and detects potential MAUP effects due to spatial aggregation. At step (User 3), the system sensed that the user is unaware of the MAUP problem, an alert guidance is initiated to warn the user about the danger. To help the user understand the risk of MAUP effects, the guidance agent repeated the analysis using an alternative spatial unit, census tracts, and showed the user that the result is significantly different(MG 3-a). To further convince the user to take steps to mitigate risk, the agent computed LISA (as a prescribed strategy S8), suggesting strong MAUP effects (MG 3-b). These maps and messages convinced Danny to commit serious effort to mitigate the MAUP effect.
At step (User 4), Danny acknowledges the rise of a MAUP issue and decides to explore the likely effects. However, Danny does not know how to proceed. He asks for help directly and the guidance agent suggests using disaggregated data where available (S4) and offers KDE (S5) as an alternative method for density calculations, mitigating the distortions introduced by arbitrary spatial units. In this stage, Danny was guided to choose mitigation methods. He was also assisted in executing a proper GIS workflow for exploratory analysis. For practical reasons, Danny is not free to choose any area units other than neighborhood boundaries. The guidance agent adapted a strategy to verify the hotspots using kernal density surface representation (MG 4). MG 5 was generated using the Incremental Spatial Autocorrelation tool 111https://desktop.arcgis.com/en/arcmap/latest/tools/spatial-statistics-toolbox/incremental-spatial-autocorrelation.htm to determine an appropriate spatial scale (M8), which is then applied as the distance banding parameter for Hotspot Analysis 222https://desktop.arcgis.com/en/arcmap/latest/tools/spatial-statistics-toolbox/hot-spot-analysis.htm with Gi* statistics (M8). Such statistical validation is used as additional evidence to convince Danny that he should take measures to minimize uncertainty and improve the reliability of their conclusions.
6 Computational Framework of Machine Guidance
Our approach would not be complete without discussing the feasibility of achieving our design goals through machine intelligence. To demonstrate the feasibility of machine guidance, we are developing a prototype design that supports the guidance behavior demonstrated in the scenario of Table 3. A full discussion on that prototype implementation is beyond the scope of this paper. However, we do want to briefly describe the computational frameworks employed and shed light on the practicality of implementing machine guidance.
6.1 An Agent-based Computational Framework
Our implementation of a guidance agent is primarily based on the SharedPlan model of human-computer collaboration [35, 53]. This model is capable of representing the intentional structures of agent collaborations and reasoning for planning future actions under uncertainty. This adaptability is crucial in guiding geospatial analysis, where problem-solving evolves dynamically with new information.
Our guidance agent is a specialized type of collaborative interface agent [46]. The guidance agent is able to communicate and observe the actions of the human analyst and vice versa. A crucial part of successful collaboration is knowing when a particular analytical action has been performed and what are the intended analytical goals. SharedPlan model has been successfully applied in geo-analytical tasks, helping GISystems infer user intent beyond direct commands and reducing ambiguity through dialogue-based interactions [8]. Cai [9] showed that the analytical intentions of the analyst can be recognized with certain domain knowledge. Using the SharePlan model in a conversational agent, basic GIS analysis tasks can be done through conversations with the interface agent. Our work extends this agent framework for mixed-initiative guidance.
Another source of inspiration is research on guidance in the field of visual analytics [11, 12, 10, 55]. Guidance was defined as a computational system that actively assists users during analytical processes by offering contextual guidance, recommendations, and feedback [11, 12]. Machine guidance identifies when help is needed and determines the type of assistance to provide [11] by integrating reasoning, planning, and domain knowledge. Recent works such as Lotse [58] and AdViCE [29] bridge theoretical concepts with practical applications and allow analysts to receive better assistance in data exploration and visualization tasks. However, designing guidance systems that scale across different data domains and user expertise levels remains a significant challenge [22]. Practical applications to support geospatial analysis remain limited, despite similar challenges, such as the need to make critical decisions while lacking the expertise and tools.
6.2 Knowledge Representation and Reasoning
Design of guidance agents must answer a number of questions: (1) What is knowledge and expertise represented? (2) What reasoning abilities are needed? (3) What kinds of sensing skills are needed to monitor changes in contexts? (4) What communication behaviors are expected? These questions can be partially answered by observing the communication and interaction patterns in the scenario presented in Table 3.
-
The system must actively monitor the analytical process, identify the current analysis stage, detect whether MAUP is involved, and recognize when the analyst encounters difficulties. This requires the system to have a sensing capability and be able to keep track of the analytical process to determine when help is needed and what form of guidance should be provided.
-
Guidance should not merely follow the analyst’s actions but must take the initiative to intervene when necessary. This requires that the system must be able to form intention to act based on reasoning about what is helpful to do for the user.
-
It is important to convince the analyst to address the MAUP effect before suggesting mitigation methods and strategies. Thus, the system must be able to plan complex actions based on reasoning about strategies, methods, and tools.
-
The system must be adaptive and context aware, tailoring guidance based on specific analytical domains, available data, and the analytical goals of the analyst. This involves dynamically inferring the analyst’s intentions, understanding the current analytical context, and determining how to deliver relevant guidance.
7 Discussion and Conclusion
The Modifiable Areal Unit Problem (MAUP) continues to pose a significant challenge in GIScience, yet discussions surrounding its causes, consequences, and solutions remain fragmented. Although existing research has primarily emphasized the scientific implications of MAUP, practical strategies for addressing it in real-world applications are still limited and underdeveloped [50, 25]. Our analysis reveals that many analysts tend to overlook MAUP or underestimate its impact, underscoring a critical disconnect between theoretical understanding and practical implementation.
Our work contributes to a practical approach to address MAUP in geospatial analysis. We proposed to introduce an intelligent agent to guide analysts in mitigating the effect of MAUP. As the first step toward this long-term goal, this paper established a preliminary theory of machine guidance by answering a number of fundamental research questions. We identified multiple opportunities for the machine to guide the analysts by alerting to the rise of MAUP, assessing the impact of MAUP, choosing mitigation methods, and generating visual guidance messages using GIS functions and tools. In terms of choosing what guidance features to be designed, we set two sets of objectives machine guidance in MAUP: (1) building awareness (2) supplement user’s expertise in mitigating MAUP effects. This level of understanding allows for further refinement and formalization of the related expertise in computational systems.
MAUP in geospatial analysis poses challenges in identifying its causes, selecting mitigation strategies, and interpreting scale-dependent results [63, 50]. Machine guidance has the potential to provide a proactive solution for addressing MAUP by alerting analysts to potential consequences, offering suitable methods, and facilitating executions in the GISystem. Given the resolution-dependent nature of geographic data [32], the selection of appropriate methods is crucial. Visual guidance, such as standardized map comparisons (Table 3), helps analysts interpret MAUP effects more effectively [57, 13], reducing the likelihood of overlooking its impact [21, 59, 1]. Addressing MAUP through machine guidance demonstrates its potential to enhance geospatial analysis in various domains by expanding its knowledge base and integrating domain-specific solutions [45, 43, 56].
The work presented in this paper is the first step towards the goal of active machine guidance when analysts encounter MAUP during geospatial analysis. Although we made a convincing argument for the feasibility of machine guidance and its capacity to address MAUP, the scientific merit of this approach needs to be assessed by the usefulness of the tool (machine guidance agent) when it is implemented, refined, and tested. Our ongoing research focuses on evaluating and refining the proposed strategies to ensure practical applicability. Observing how participants interact with the system, our aim is to gain a deeper understanding of when and how the guidance should be introduced when addressing the MAUP. We are collecting data on user experience and feedback and identify areas for improvement. We apply a human-centered approach to further refine both the conceptual and computational components. The findings of the study of machine guidance are likely to inspire and inform researchers in both GIS and Human-Computer Interaction (HCI) regarding the design of interactive components in GISystems.
References
- [1] Natalia Andrienko and Gennady Andrienko. Exploratory analysis of spatial and temporal data: a systematic approach. Springer Science & Business Media, 2006.
- [2] Luc Anselin. Local indicators of spatial association—lisa. Geographical analysis, 27(2):93–115, 1995.
- [3] Luc Anselin. Spatial econometrics: methods and models, volume 4. Springer Science & Business Media, 2013.
- [4] Michael Batty. Cities and complexity: understanding cities with cellular automata, agent-based models, and fractals. The MIT press, 2007.
- [5] Patricia L Brantingham, Paul J Brantingham, Mona Vajihollahi, and Kathryn Wuschke. Crime analysis at multiple scales of aggregation: A topological approach. Putting crime in its place: Units of analysis in geographic criminology, pages 87–107, 2009.
- [6] Chris Brunsdon, A. Stewart Fotheringham, and Martin E. Charlton. Geographically Weighted Regression: A Method for Exploring Spatial Nonstationarity. Geographical Analysis, 28(4):281–298, October 1996.
- [7] Michael Buzzelli. Modifiable areal unit problem. International encyclopedia of human geography, page 169, 2019.
- [8] Guoray Cai, Hongmei Wang, Alan M MacEachren, and Sven Fuhrmann. Natural conversational interfaces to geospatial databases. Transactions in GIS, 9(2):199–221, 2005. doi:10.1111/J.1467-9671.2005.00213.X.
- [9] Guoray Cai, Bo Yu, and Dong Chen. Modeling and communicating the conceptual intent of geo-analytical tasks for human-gis interaction. Transactions in GIS, 17(3):353–368, 2013. doi:10.1111/TGIS.12040.
- [10] Davide Ceneda, Natalia Andrienko, Gennady Andrienko, Theresia Gschwandtner, Silvia Miksch, Nikolaus Piccolotto, Tobias Schreck, Marc Streit, Josef Suschnigg, and Christian Tominski. Guide me in analysis: A framework for guidance designers. In Computer Graphics Forum, volume 39(6), pages 269–288. Wiley Online Library, 2020. doi:10.1111/CGF.14017.
- [11] Davide Ceneda, Theresia Gschwandtner, Thorsten May, Silvia Miksch, Hans-Jörg Schulz, Marc Streit, and Christian Tominski. Characterizing guidance in visual analytics. IEEE transactions on visualization and computer graphics, 23(1):111–120, 2016. doi:10.1109/TVCG.2016.2598468.
- [12] Davide Ceneda, Theresia Gschwandtner, Thorsten May, Silvia Miksch, Marc Streit, and Christian Tominski. Guidance or no guidance? a decision tree can help. In EuroVA@ EuroVis, pages 19–23, 2018. doi:10.2312/EUROVA.20181107.
- [13] Spencer Chainey, Svein Reid, and Neil Stuart. When is a hotspot a hotspot? a procedure for creating statistically robust hotspot maps of crime. Innovations in GIS, 9:21–36, 2002.
- [14] Andrew David Cliff and J Keith Ord. Spatial processes: models & applications. (No Title), 1981.
- [15] Alexis Comber and Paul Harris. The importance of scale and the maup for robust ecosystem service evaluations and landscape decisions. Land, 11(3):399, 2022.
- [16] National Research Council, Life Studies, Board on Earth Sciences, Geographical Sciences Committee, Committee on Support for Thinking Spatially, and The Incorporation of Geographic Information Science Across the K-12 Curriculum. Learning to think spatially. National Academies Press, 2005.
- [17] Noel Cressie. Statistics for spatial data. John Wiley & Sons, 2015.
- [18] Shawna J Dark and Danielle Bram. The modifiable areal unit problem (maup) in physical geography. Progress in Physical Geography, 31(5):471–479, 2007.
- [19] William E Dietrich, Dino G Bellugi, Leonard S Sklar, Jonathan D Stock, Arjun M Heimsath, and Joshua J Roering. Geomorphic transport laws for predicting landscape form and dynamics. Geophysical Monograph-American Geophysical Union, 135:103–132, 2003.
- [20] Jennifer L Dungan, JN Perry, MRT Dale, Pousty Legendre, S Citron-Pousty, M-J Fortin, A Jakomulska, M Miriti, and MS2002 Rosenberg. A balanced view of scale in spatial statistical analysis. Ecography, 25(5):626–640, 2002.
- [21] Karin Eberhard. The effects of visualization on judgment and decision-making: a systematic literature review. Management Review Quarterly, 73(1):167–214, 2023.
- [22] Alex Endert, William Ribarsky, Cagatay Turkay, BL William Wong, Ian Nabney, I Díaz Blanco, and Fabrice Rossi. The state of the art in integrating machine learning into visual analytics. In Computer Graphics Forum, volume 36(8), pages 458–486. Wiley Online Library, 2017. doi:10.1111/CGF.13092.
- [23] Ihor Fedchak, Oleksandr Kondratiuk, Anatolii Movchan, and Svyatoslav Poliak. Theoretical foundations of hot spots policing and crime mapping features. Social and Legal Studios, 1(7):174–183, 2024.
- [24] A Stewart Fotheringham and Mehak Sachdeva. Scale and local modeling: new perspectives on the modifiable areal unit problem and simpson’s paradox. Journal of Geographical Systems, 24(3):475–499, 2022. doi:10.1007/S10109-021-00371-5.
- [25] A Stewart Fotheringham and David WS Wong. The modifiable areal unit problem in multivariate statistical analysis. Environment and planning A, 23(7):1025–1044, 1991.
- [26] Andrew U Frank. Qualitative spatial reasoning: Cardinal directions as an example. International journal of geographical information science, 10(3):269–290, 1996. doi:10.1080/02693799608902079.
- [27] Charles E Gehlke and Katherine Biehl. Certain effects of grouping upon the size of the correlation coefficient in census tract material. Journal of the American Statistical Association, 29(185A):169–170, 1934.
- [28] Arthur Getis and J Keith Ord. The analysis of spatial association by use of distance statistics. Geographical analysis, 24(3):189–206, 1992.
- [29] Oscar Gomez, Steffen Holter, Jun Yuan, and Enrico Bertini. Advice: Aggregated visual counterfactual explanations for machine learning model validation. In 2021 IEEE Visualization Conference (VIS), pages 31–35. IEEE, 2021. doi:10.1109/VIS49827.2021.9623271.
- [30] MF Goodchild and PA Longley. The future of gis and spatial analysis. Geographical information systems, 1:567–580, 1999.
- [31] Michael F Goodchild. Geographical information science. International journal of geographical information systems, 6(1):31–45, 1992. doi:10.1080/02693799208901893.
- [32] Michael F Goodchild. Scale in gis: An overview. Geomorphology, 130(1-2):5–9, 2011.
- [33] Michael F Goodchild, Luc Anselin, Richard P Appelbaum, and Barbara Herr Harthorn. Toward spatially integrated social science. International Regional Science Review, 23(2):139–159, 2000.
- [34] Michael F Goodchild and Robert P Haining. Gis and spatial data analysis: Converging perspectives. Papers in Regional Science, 83(1):363–385, 2004.
- [35] Barbara J Grosz and Sarit Kraus. Collaborative plans for complex group action. Artificial Intelligence, 86(2):269–357, 1996. doi:10.1016/0004-3702(95)00103-4.
- [36] Robert Haining. Designing spatial data analysis modules for geographical information systems. Spatial analysis and GIS, pages 45–64, 1994.
- [37] Dennis E Jelinski and Jianguo Wu. The modifiable areal unit problem and implications for landscape ecology. Landscape ecology, 11:129–140, 1996.
- [38] Dayun Kang, Hyunho Choi, Jong-Hun Kim, and Jungsoon Choi. Spatial epidemic dynamics of the covid-19 outbreak in china. International journal of infectious diseases, 94:96–102, 2020.
- [39] Julia Kelsall and Jonathan Wakefield. Modeling Spatial Variation in Disease Risk: A Geostatistical Approach. Journal of the American Statistical Association, 97(459):692–701, September 2002.
- [40] Mei-Po Kwan. The uncertain geographic context problem. Annals of the Association of American Geographers, 102(5):958–968, 2012.
- [41] Sang-Il Lee, Monghyeon Lee, Yongwan Chun, and Daniel A Griffith. Uncertainty in the effects of the modifiable areal unit problem under different levels of spatial autocorrelation: A simulation study. International Journal of Geographical Information Science, 33(6):1135–1154, 2019. doi:10.1080/13658816.2018.1542699.
- [42] Stefan Leyk, Andrea E Gaughan, Susana B Adamo, Alex De Sherbinin, Deborah Balk, Sergio Freire, Amy Rose, Forrest R Stevens, Brian Blankespoor, Charlie Frye, et al. The spatial allocation of population: a review of large-scale gridded population data products and their fitness for use. Earth System Science Data, 11(3):1385–1409, 2019.
- [43] Paul A Longley, Michael F Goodchild, David J Maguire, and David W Rhind. Geographic information science and systems. John Wiley & Sons, 2015.
- [44] Cehong Luo. The modifiable areal unit problem (maup) in the spatial analysis of crime and socio-economic indicators, 2023.
- [45] Alan M MacEachren and Menno-Jan Kraak. Research challenges in geovisualization. Cartography and geographic information science, 28(1):3–12, 2001.
- [46] Pattie Maes. Agents that reduce work and information overload. Communications of the ACM, 37(7):30–40, 1994. doi:10.1145/176789.176792.
- [47] David Manley. Scale, aggregation, and the modifiable areal unit problem. In Handbook of regional science, pages 1711–1725. Springer, 2021.
- [48] Timothy L Nyerges. Cognitive issues in the evolution of gis user knowledge. In Cognitive aspects of human-computer interaction for geographic information systems, pages 61–74. Springer, 1995.
- [49] Stan Openshaw. A million or so correlated coefficients: three experiment on the modifiable areal unit problem. Statistical applications in the spatial sciences, 1979.
- [50] Stan Openshaw. Ecological fallacies and the analysis of areal census data. Environment and planning A, 16(1):17–31, 1984.
- [51] S Openshow. A million or so correlation coefficients, three experiments on the modifiable areal unit problem. Statistical applications in the spatial science, pages 127–144, 1979.
- [52] Camille Parmesan and Gary Yohe. A globally coherent fingerprint of climate change impacts across natural systems. nature, 421(6918):37–42, 2003.
- [53] Charles Rich, Candace L Sidner, and Neal Lesh. Collagen: Applying collaborative discourse theory to human-computer interaction. AI magazine, 22(4):15–15, 2001.
- [54] Joacim Rocklöv and Henrik Sjödin. High population densities catalyse the spread of covid-19. Journal of travel medicine, 27(3):taaa038, 2020.
- [55] Floarea Serban, Joaquin Vanschoren, Jörg-Uwe Kietz, and Abraham Bernstein. A survey of intelligent assistants for data analysis. ACM Computing Surveys (CSUR), 45(3):1–35, 2013. doi:10.1145/2480741.2480748.
- [56] Terry A Slocum, Connie Blok, Bin Jiang, Alexandra Koussoulakou, Daniel R Montello, Sven Fuhrmann, and Nicholas R Hedley. Cognitive and usability issues in geovisualization. Cartography and geographic information science, 28(1):61–75, 2001.
- [57] Terry A Slocum, Robert B McMaster, Fritz C Kessler, and Hugh H Howard. Thematic cartography and geovisualization. CRC Press, 2022.
- [58] Fabian Sperrle, Davide Ceneda, and Mennatallah El-Assady. Lotse: A practical framework for guidance in visual analytics. IEEE Transactions on Visualization and Computer Graphics, 29(1):1124–1134, 2022. doi:10.1109/TVCG.2022.3209393.
- [59] John Sweller. Cognitive load during problem solving: Effects on learning. Cognitive science, 12(2):257–285, 1988. doi:10.1207/S15516709COG1202_4.
- [60] Andrew Swift, Lin Liu, and James Uber. Maup sensitivity analysis of ecological bias in health studies. GeoJournal, 79:137–153, 2014.
- [61] Loren G Terveen. Overview of human-computer collaboration. Knowledge-Based Systems, 8(2-3):67–81, 1995. doi:10.1016/0950-7051(95)98369-H.
- [62] Carol Traynor. Putting power in the hands of end users: a study of programming by demonstration, with an application to geographical information systems. In CHI 98 conference summary on Human factors in computing systems, pages 68–69, 1998. doi:10.1145/286498.286533.
- [63] David Wong. The modifiable areal unit problem (maup). In The SAGE Handbook of Spatial Analysis, pages 105–123. SAGE Publications, Ltd, London, 2009.
- [64] D.W. Wong. Modifiable areal unit problem. In Rob Kitchin and Nigel Thrift, editors, International Encyclopedia of Human Geography, pages 169–174. Elsevier, Oxford, 2009.
- [65] Jianguo Wu, K Bruce Jones, and Orie L Loucks. Scaling and uncertainty analysis in ecology. Springer, 2006.