U-Prithvi: Integrating a Foundation Model and U-Net for Enhanced Flood Inundation Mapping

Abstract
In recent years, large pre-trained models, commonly referred to as foundation models, have become increasingly popular for various tasks leveraging transfer learning. This trend has expanded to remote sensing, where transformer-based foundation models such as Prithvi, msGFM, and SatSwinMAE have been utilized for a range of applications. While these transformer-based models, particularly the Prithvi model, exhibit strong generalization capabilities, they have limitations on capturing fine-grained details compared to convolutional neural network architectures like U-Net in segmentation tasks. In this paper, we propose a novel architecture, U-Prithvi, which combines the strengths of the Prithvi transformer with those of U-Net. We introduce a RandomHalfMaskLayer to ensure balanced learning from both models during training. Our approach is evaluated on the Sen1Floods11 dataset for flood inundation mapping, and experimental results demonstrate better performance of U-Prithvi over both individual models, achieving improved performance on out-of-sample data. While this principle is illustrated using the Prithvi model, it is easily adaptable to other foundation models.
Keywords and phrases:
GeoAI, flood mapping, foundation model, U-Net, PrithviFunding:
Jenna Abrahamson: Funded by a National Science Foundation Graduate Research Fellowship Grant No. DGE-2137100.Copyright and License:
2012 ACM Subject Classification:
Computing methodologies Image segmentationSupplementary Material:
Software (Source Code): https://github.com/kostejnv/prithvi_segmentationarchived at
Editors:
Katarzyna Sila-Nowicka, Antoni Moore, David O'Sullivan, Benjamin Adams, and Mark GaheganSeries and Publisher:
1 Introduction
Floods are one of Earth’s most devastating natural disasters, and their impact is expected to intensify in a warmer climate. Variations in extreme temperatures and heavy rain events are expected to increase the frequency and intensity of floods, with implications for infrastructure stability, water quality, and human safety [16]. Understanding when and where floods occur is important not only for disaster response management, but also for understanding global hydrological and biogeochemical cycles [5]. Satellite remote sensing has been used since the 1970’s to map surface water across the globe [15], including water from flood events. The public release of satellite data archives [36], combined with improvements in computing power and artificial intelligence algorithms, has led to large advancements in recent years for mapping flood events across space and time [34]. Both optical and radar data have proven useful for capturing floods, and the amount of available public and commercial satellite data continues to grow in both of these domains.
This rapid increase in available data has led to the adoption of deep-learning techniques for flood mapping. Deep learning algorithms are inspired by the structure and function of brain neural networks, where the computer learns a hierarchy of concepts, each concept defined through its relationship to simpler concepts in a deep graph with many layers [11]. Deep learning for remote sensing of flood extents is commonly approached as a semantic segmentation task, using methods such as Convolutional Neural Networks (CNNs) like DeepLab [7], SegNet [9], and U-Net [29], a review of which can be found in [2]. Although deep learning has greatly improved the accuracy with which flood extents can be classified, it requires substantial amounts of labeled data, can be expensive to train, and does not always generalize globally across space and time, necessitating the training of application- or location-specific models. These shortcomings have spurred the recent development of novel geospatial foundation models. A foundation model is a large, generalizable deep learning model that is pre-trained on a massive, unlabeled dataset to be a generalist model that can then be fine-tuned to a variety of downstream tasks using smaller labeled datasets [17].
The applicability and accuracy of these foundation models compared to other deep learning methods are still being tested, especially in the geospatial field. Recently, NASA and IBM teamed up to release the novel Prithvi geospatial foundation model, which was pre-trained on data for the United States from the Harmonized Landsat-Sentinel (HLS) satellite data catalog. The HLS data catalog consists of harmonized data from both Landsat and Sentinel-2 satellite missions, with an average revisit period of cloud-free imagery every 8.4 days at 30 m spatial resolution [8]. Initial experiments of adapting the Prithvi model to flood mapping [19] compared the foundation model to a U-Net model using Sentinel-2 satellite imagery at 10 m spatial resolution. In this study, the authors of [19] found that the U-Net model outperformed the Prithvi model when evaluated on in-sample test data; however, Prithvi was found to perform better than the U-Net when evaluated on out-of-sample data from an unseen region in Bolivia. In their results, the authors show that both models performed poorly in at least one of the test sets (in-sample/out-of-sample). This finding suggests that a mixed approach could take advantage of both generalization capabilities and region-specific learning.
Building on Prithvi’s strong generalization capabilities, this paper proposes U-Prithvi, a novel fusion model combining Prithvi with U-Net for flood extent mapping in satellite imagery. This fusion approach aims to leverage cross-modal learning between the two models, capitalizing on Prithvi’s generalist strengths and U-Net’s detailed segmentation capabilities within local datasets. Using the Sen1Floods11 hand-delineated flood dataset, we: (1) trained a U-Net and Prithvi fusion architecture; (2) fine-tuned our proposed U-Prithvi model; and (3) fine-tuned and trained standalone U-Net and Prithvi models for performance comparison against our results and those reported in the literature. We evaluated these models against in-sample and out-of-sample test datasets from Sen1Floods11, assessing their flood extent mapping accuracy using Sentinel-2 imagery. Following an overview of each model and related work, we detail their architectures. Finally, we present our findings on how novel foundation models like Prithvi can be combined with established models like U-Net to improve global flood extent mapping accuracy.
2 Related Work
2.1 Deep Learning & Flood Mapping
Deep learning approaches have been implemented for a variety of remote sensing classification problems pertaining to land cover, agriculture, open water bodies, and floods. Floods present a unique problem in that they can be spectrally very complex depending on the geographic area and terrain that the flood is covering. Examples of deep learning in the literature for flood mapping include various applications of CNNs, Multi-Layer Perceptrons, and Recurrent Neural Networks applied to Sentinel-2, Sentinel-1, and CubeSat data [6, 22, 31], a full review of which can be found in [4]. Specific flood mapping architectures have also been developed, such as Siam-DWENet [38] , which takes advantage of transfer learning and an attention mechanism, and DeepFlood, which employs feature-level fusion and classification of optical and radar data [18]. An architecture that is increasingly common for flood-mapping applications is U-Net, which has been used to classify floods based on satellite imagery and Twitter data [30], and for flood segmentation using radar data in southeastern Mexico [27].
2.2 U-Net Architecture
The U-Net architecture was first introduced by Ronneberger et. al 2015 [29] as an improvement of fully-convolutional neural networks for biomedical image segmentation applications. The U-Net consists of a series of contracting convolutional layers that gradually reduce spatial dimensionality and increase feature dimensionality. The feature-dense bottleneck is then upscaled with skip connections that help map from a condensed feature space using higher resolution information available in the encoder hidden layers.
The U-Net architecture has been extensively used for medical image segmentation [3]. However, models trained to perform natural image segmentation, like those in medical images or classic computer vision tasks, do not translate directly to remote sensing applications [33]. Recent advances in applying U-Net for remote sensing segmentation problems include combinations of DenseNet and Dilated Convolutions [33] and attention mechanisms [37], as well as specific applications to flood detection using SAR imagery [20].
2.2.1 U-Net Extensions
Although U-Net is highly effective in capturing both global and local context, it has limited capacity to learn long-range spatial dependencies [13]. This limitation has motivated research into integrating transformers with U-Net to enhance its performance. One notable architecture, UNETR, was proposed for 3D medical image segmentation and incorporates a Vision Transformer (ViT) with a U-shaped CNN structure. In this model, the transformer encoder is directly connected to the U-Net-style decoder through skip connections at different resolutions [13]. Other studies have modified U-Net by adding an additional transformer encoder, then combining its features with those of the CNN. This approach has been applied successfully in medical image segmentation with the FT-UNet architecture [35] and in remote sensing image segmentation with the ST-UNet architecture [14]. Petit et al. [28] introduced a U-Net variant with an attention mechanism for medical image segmentation. They incorporated self-attention into the bottleneck layer and cross-attention into the skip connections.
2.3 Foundation Models and Prithvi
Deep learning approaches require substantial amounts of ground truth data for training from scratch, which can be costly to obtain. This need for data, combined with the recent popularity of foundation models, large pre-trained models that have greatly impacted fields such as natural language processing and multimodal tasks, has driven research into foundation models specifically for the geospatial field. As evidence of this trend, research on transfer learning for geospatial tasks saw a ten-fold increase in published articles between 2017 and 2022 [21]. The use of foundation models in geospatial tasks can generally be divided into three categories: (1) models trained on natural image datasets, (2) models trained on geospatial datasets, and (3) hybrid models that integrate both approaches [23].
The first category typically involves models trained on datasets like ImageNet [10]. Although this dataset is quite different from geospatial datasets, studies have shown that this approach can still be effective for specific satellite image tasks, such as land-use classification, urban zone classification, or burnt area detection [25, 26]. In the second category, numerous foundation models have been developed specifically for remote sensing data. Some of these models are trained on single-time images but incorporate data from multiple remote sensors [12], while others are trained on multi-temporal datasets, such as the Prithvi model [17] and SatSwinMAE [24].
Several hybrid models combining natural and remote sensing image modalities have emerged in recent years. For instance, the GFM model [23] employs a two-stage pretraining process. It is initially trained on the ImageNet22k dataset and subsequently on the custom GeoPile remote sensing dataset. This approach aims to enhance performance compared to models trained solely on natural image datasets, while also mitigating the expense of training foundation models from scratch on remote sensing data.
2.3.1 Prithvi
Prithvi is a foundation model developed by IBM and NASA, specifically trained from scratch on geospatial data. Its encoder architecture is based on a Vision Transformer and was trained using a Masked AutoEncoder strategy. The training dataset for Prithvi Version 1 (the most recent version during the time of writing) comprises over 1 TB of multispectral satellite imagery from the HLS dataset, which was collected using a stratified sampling procedure to ensure a set of diversified data from the United States. As a multi-temporal model, Prithvi can process entire image sequences, allowing for time-series analysis of geospatial data [17].
2.4 Current Limitations and Our Contributions
Flood segmentation mapping using GeoAI foundation models has demonstrated effective generalization. However, these models often underperform on in-sample test datasets compared to U-Net models [19]. Let us formally define in-sample and out-of-sample test data. An in-sample test dataset consists of samples drawn from the same distribution as the training data (e.g., from the same regions). An out-of-sample test dataset contains samples from a different distribution but shares the same features (e.g., a different region), where the trained models have not seen any samples from that region. We hypothesize that combining Prithvi and U-Net will improve performance for both in-sample and out-of-sample use cases. Therefore, we developed a novel fusion model integrating Prithvi features into a U-Net architecture. We validated this hypothesis by comparing our model’s generalization and predictive capacity against existing approaches on both in-sample and out-of-sample test datasets. Our experiments show that this combined architecture balances these two performance metrics while requiring fewer training epochs. Finally, we discuss the potential extension of this approach to other foundation models and applications.
3 Methodology
This section describes the proposed approach, focusing on a novel architecture that combines the U-Net and Prithvi models. By merging U-Net’s ability to capture fine-grained details with Prithvi’s capacity to model global context, we aim to achieve superior segmentation accuracy for flood mapping. To evaluate this architecture, we will compare it against both models used independently. The following sections detail each model’s architecture before describing our fusion approach, U-Prithvi.
3.1 Prithvi Architecture
Prithvi is a Vision Transformer model trained using a Masked Autoencoder strategy. While its original decoder is designed for input reconstruction and may not be optimal for segmentation tasks [17], we utilize only Prithvi’s encoder and pair it with a custom decoder similar to that of U-Net.
Our implementation, illustrated in Figure 1, begins with Prithvi’s encoder, producing a 14x14 feature map with 768 filters. This feature map is processed through a single block without parameter modification, then upsampled using four transposed convolutional layers to achieve the original input shape. A final convolutional layer with Softmax activation serves as the classifier. Prithvi and U-Net serve as baselines in our experiments.

3.2 Proposed Fusion Model: U-Prithvi
U-Prithvi, the proposed model, integrates the strengths of both the Prithvi model and the U-Net architecture, combining Prithvi’s capability for capturing global context with U-Net’s proficiency in fine-detail segmentation. The schematic representation of the U-Prithvi architecture is illustrated in Figure 2.
The input passes through both the U-Net and Prithvi encoders, generating two 14x14 feature maps with 768 filters each. These feature maps are aggregated and subsequently passed into the decoder component, which comprises four upsampling blocks with skip connections to the U-Net encoder.

To address the potential training imbalance between the pretrained Prithvi encoder and the untrained U-Net encoder, we introduce a novel RandomHalfMaskLayer (RHM layer). This layer, positioned after the concatenation step, probabilistically masks either Prithvi’s or U-Net’s feature maps – or leaves both unmasked – during training. During inference, the layer has no effect on the input. We anticipate that this approach will promote balanced training and ensure optimal contributions from both components in the final segmentation.
Despite the existence of several approaches that combine transformer and U-Net architectures, most of these train the architecture from scratch and do not account for using fixed pretrained architectures. The Prithvi foundation model, being a ViT-based architecture, does not include multiple stages with varying resolutions, making it incompatible with the methods presented in the related work section 2.2.1. A significant advantage of our approach is its flexibility: Prithvi can be substituted with any other foundation model without requiring substantial modifications to the architecture.
4 Experimental Design and Results
Our experiments explored the following key research questions:
-
1.
Do foundation models like Prithvi generalize well to out-of-sample data, while custom models like U-Net perform better on in-sample data?
-
2.
Can we combine Prithvi and U-Net to exploit cross-modal relationships and improve performance on both in-sample and out-of-sample test datasets?
-
3.
Can the U-Net architecture be improved to match Prithvi’s out-of-sample performance?
-
4.
Can cross-modal learning be controlled?
We also conducted ablation experiments to investigate fusion strategies.
4.1 Data and Performance Metrics
Using the Sen1Floods11 [1] dataset, we evaluated the performance of our U-Prithvi architecture and compared it against standalone U-Net and Prithvi-decoder models from [19]. The Sen1Floods11 dataset contains 446 image samples paired with hand-labeled masks identifying flooded (water and flood) and non-flooded areas across various regions, including Ghana, India, the Mekong River, Nigeria, Pakistan, Paraguay, Somalia, Spain, Sri Lanka, and the USA. Each sample has a resolution of 10 meters and a pixel size of . Six Sentinel-2 bands (RGB, NIR, SWIR1-2) are used as input to our models to align with the Prithvi encoder’s input requirements.
Our preprocessing pipeline includes data normalization (mean 0, variance 1), random cropping to (to meet Prithvi encoder’s input requirements), and random horizontal and vertical flips to augment the data. For performance evaluation, we use two sets provided in the dataset: (1) an in-sample test set with samples from the same regions as the training data, and (2) an out-of-sample test set containing samples from Bolivia, which were not used during training. To compare model performance, we use Intersection over Union (IoU) as our primary metric and accuracy (Acc) as a secondary metric. For each metric, we calculate both the mean (mIoU, mAcc) across classes and individual values for each class (IoU, IoU, Acc, Acc). These values are derived from true positive (TP), false positive (FP), true negative (TN), and false negative (FN) counts as follows:
| (1) |
| (2) |
| (3) |
| (4) |
| IoU | Accuracy | ||||||
|---|---|---|---|---|---|---|---|
| Model | Data Set | Avg. | Flood | Non-Flood | Avg. | Flood | Non-Flood |
| U-NetBase [19] | Test | 90.80 | 84.03 | 97.57 | 94.80 | 90.74 | 98.86 |
| PrithviBase [19] | Test | 89.59 | 81.98 | 97.21 | 94.35 | 90.12 | 98.58 |
| Prithvi | Test | 86.25 | 76.39 | 96.10 | 93.90 | 90.40 | 97.40 |
| U-Prithvi | Test | 89.73 | 82.21 | 97.24 | 94.81 | 91.15 | 98.46 |
| U-NetBase [19] | Bolivia | 82.54 | 70.57 | 94.52 | 86.45 | 73.73 | 99.18 |
| PrithviBase [19] | Bolivia | 86.02 | 76.62 | 95.43 | 90.38 | 82.12 | 98.65 |
| Prithvi | Bolivia | 82.89 | 72.42 | 93.36 | 93.24 | 91.61 | 94.88 |
| U-Prithvi | Bolivia | 87.70 | 79.68 | 95.71 | 93.31 | 88.84 | 97.78 |
4.2 Results
The first experiment is designed to answer our first research question. The baseline performance of Prithvi versus U-Net for this application of flood inundation mapping was established in the paper published by [19]. We utilized the same in-sample and out-of-sample test sets as well as computed accuracy metrics to maintain consistency and comparability. These results show that U-NetBase outperforms PrithviBase across all accuracy metrics when evaluated on in-sample test set as shown in Table 1. However, PrithviBase outperforms U-NetBase when evaluated on out-of-sample Bolivia set. These results will be used as our baseline to compare to when analyzing the results of our experiments.
Our second experiment is designed to address our second and most important research question. By integrating the U-Net and Prithvi models, we anticipate that the U-Prithvi model will perform effectively on both same-distribution and unseen data, while demonstrating fast convergence for both scenarios. Table 1 presents our performance results compared to U-NetBase and PrithviBase, evaluated on both the in-sample test set and the out-of-sample Bolivia dataset. Our findings indicate that the U-Prithvi model outperforms both approaches on out-of-sample data. For in-sample data, the performance of U-Prithvi falls between the two models, with U-Net dominating in this context. This suggests that the U-Prithvi architecture combines the ability to achieve strong predictive performance on datasets similar to the training set with the capacity to leverage the pre-trained foundation model for superior generalization on unseen data, without requiring additional training cycles.


4.2.1 Qualitative analysis
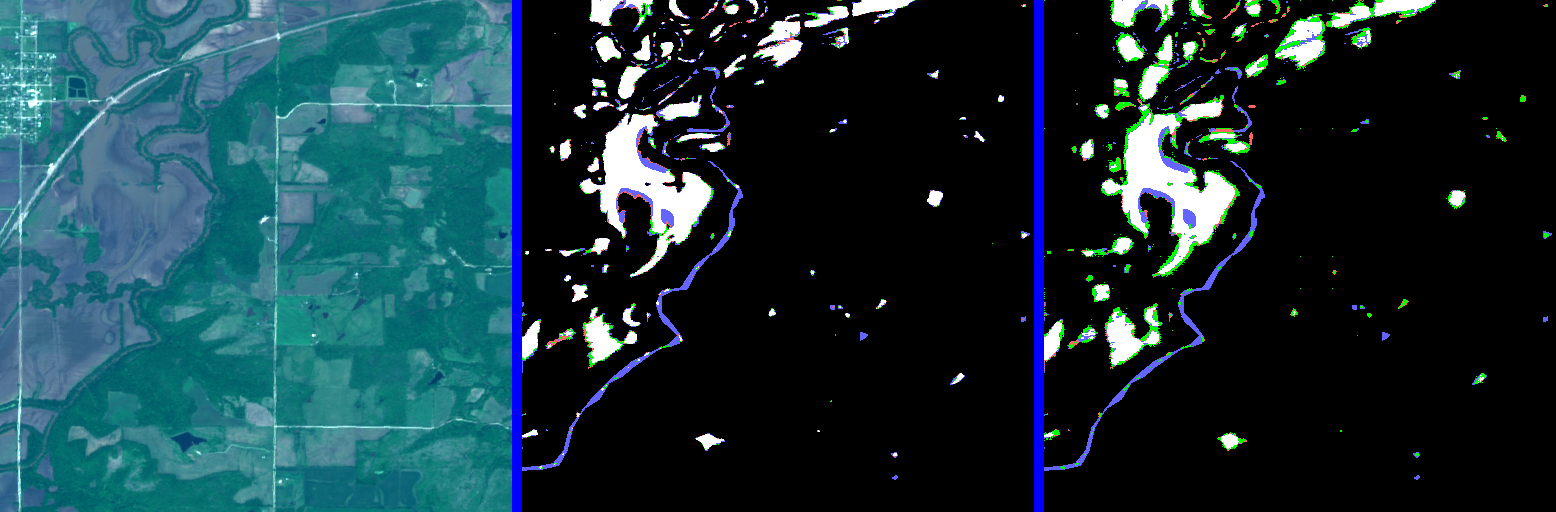
In Figure 3, we present a comparison of U-Prithvi with each of the competing models for three testing instances. In each figure, the left pane represents the satellite input, the middle pane a comparison between U-Net and U-Prithvi, and the right pane a comparison between Prithvi and U-Prithvi classification outputs. In each classification pane, we color-coded the pixels to highlight relative performance. In particular, green pixels means correctly classified by U-Prithvi and incorrectly classified by the competing model, red pixels are the opposite and blue pixels represent incorrect classifications for both. Figures 3(a) and 3(b) show test samples from the same-distribution dataset while Figure 3(c) shows an example of the Bolivia dataset.
We find that in most situations, U-Prithvi shows better performance in fine-detail areas, such as the borders of the floods in Figures 3(a) and 3(c). This is especially noticeable when compared to the Prithvi model. Additionally, Figure 3(b) shows an example where U-Prithvi correctly identified entire non-flooded regions that the Prithvi model incorrectly classified. The ability to improve over the Prithvi predictions in areas with fine spatial details while still performing well against the U-Net model is one of the advantages of using this fusion architecture.
Some features are still difficult for the models to capture. For instance, none of the models correctly classified the river and some inland areas in figure 3(a). Finally, Table 1 includes our implementation of the Prithvi model. Because [19] does not report the exact parameters of their model, we are not able to reproduce the model. Our implementation of the Prithvi-decoder architecture shows weaker performance than that reported in [19].
4.3 Improving the U-Net Architecture
Our third research question is addressed in this section. The U-Net architecture is widely used in semantic segmentation [32] and is less computationally and data-intensive to train compared to U-Prithvi. Because of this, we expanded the architecture from [19] and found that increasing the size of the U-Net model can yield similar performance for the benchmark dataset.
Our U-Net implementation, shown in Figure 4, comprises three main components: Encoder, Bottleneck, and Decoder. Each component includes several blocks, each consisting of a convolutional layer, Batch Normalization, and a ReLU activation function. The stride and type of convolution (normal or transposed) determine whether the block reduces, maintains, or increases feature map resolution.
The encoder downscales the input into a compact feature representation, using four downsampling blocks (stride 2) that reduce the resolution from 224 to 14 while increasing filter depth from 6 bands to 768. A single bottleneck block preserves the resolution and feature count. The decoder then upscales the feature map back to the input image resolution through four upsampling blocks, each concatenated with the corresponding encoder block. A final convolutional layer provides the desired output shape. This yields a total of over 37 million trainable parameters, compared to the 29 million reported in [19].
The performance of our revised U-Net model is presented in Table 2 alongside the performance of U-Prithvi in both datasets. Our results show that for the Sen1Floods11 dataset, it is possible to achieve results comparable to the performance of U-Prithvi using the U-Net model with a higher count of parameters. This is true for both in-sample and out-of-sample test sets. In the case of the Bolivia dataset, we find that performance is practically identical compared to the U-Prithvi model. This implies that a larger model is still able to capture the dynamics of the data, even compared to a foundation model. Nevertheless, it is unclear if this result would also be evidenced using a different dataset.

| IoU | Accuracy | ||||||
|---|---|---|---|---|---|---|---|
| Model | Data Set | Avg. | Flood | Non-Flood | Avg. | Flood | Non-Flood |
| U-Netours | Test | 88.84 | 80.69 | 96.99 | 94.21 | 90.06 | 98.35 |
| U-Prithvi | Test | 89.73 | 82.21 | 97.24 | 94.81 | 91.15 | 98.46 |
| U-Netours | Bolivia | 87.77 | 79.88 | 95.65 | 94.1 | 90.85 | 97.34 |
| U-Prithvi | Bolivia | 87.70 | 79.68 | 95.71 | 93.31 | 88.84 | 97.78 |
4.4 Prithvi Architecture Fine-Tuning
This section addresses our fourth research question and describes several additional experiments conducted to investigate fine-tuning the architectures. We conducted a series of experiments with various parameter configurations to find the optimal performance of our model. The following sections provide a detailed analysis of these parameters and their impact on the model’s performance.
4.4.1 Balancing Learning Between Prithvi Features and U-Net Features
The proposed U-Prithvi architecture creates a bottleneck by concatenating the encoded features from both the U-Net and the Prithvi encoder. By merging these two representations, we aim to enable the model to learn effectively from the training data while also generalizing well to out-of-sample data. However, since the Prithvi model is pre-trained while the U-Net component is not, there is a risk that the model may rely solely on one branch of features while ignoring the other, potentially slowing down the learning process.
To mitigate this issue, we introduced the RHM layer, which randomly activates or deactivates the outputs of the Prithvi and U-Net encoders. Specifically, with an equal probability of 1/3, the Prithvi encoder output is masked, the U-Net encoder output is masked, or both remain unchanged. We assess the performance of our U-Prithvi architecture with and without this layer.
| IoU | Accuracy | ||||||
|---|---|---|---|---|---|---|---|
| Model | Set | Avg. | Flood | Non-Flood | Avg. | Flood | Non-Flood |
| U-Prithvi | Test | 89.73 | 82.21 | 97.24 | 94.81 | 91.15 | 98.46 |
| U-Prithvi (No RHM layer) | Test | 89.35 | 81.54 | 97.17 | 94.14 | 89.69 | 98.59 |
| U-Prithvi | Bolivia | 87.70 | 79.68 | 95.71 | 93.31 | 88.84 | 97.78 |
| U-Prithvi (No RHM layer) | Bolivia | 87.85 | 79.97 | 95.72 | 93.80 | 90.02 | 97.57 |
Table 3 shows the results of this experiment. Performance with the RHM layer is better when measured using the in-sample test set, but worse when measured using the out-of-sample test set. Based on the results reported on [19], this would be indicative that without the RHM layer, the U-Prithvi model prioritizes the Prithvi encoded features over the U-Net features, since generalization performance is better on in-sample data compared to out-of-sample data. Nonetheless, the difference in performance between the two configurations is much smaller than the difference in performance between the Prithvi-decoder and the U-Prithvi architecture (as shown in Table 1). In addition, the RHM layer makes the model more likely to balance its use of the bottleneck features.
| IoU | Accuracy | |||||||
|---|---|---|---|---|---|---|---|---|
| Model | Set | Epochs | Avg. | Flood | Non-Flood | Avg. | Flood | Non-Flood |
| U-Prithvi | Test | 89.01 | 80.87 | 97.14 | 92.95 | 86.97 | 98.93 | |
| U-Prithvi | Test | 89.73 | 82.21 | 97.24 | 94.81 | 91.15 | 98.46 | |
| U-Prithvi | Test | 89.71 | 82.21 | 97.21 | 94.03 | 89.38 | 98.67 | |
| U-Prithvi | Test | 89.86 | 82.34 | 97.38 | 93.40 | 87.74 | 99.07 | |
| U-Prithvi | Bolivia | 83.07 | 71.72 | 94.42 | 87.60 | 76.49 | 98.72 | |
| U-Prithvi | Bolivia | 87.70 | 79.68 | 95.71 | 93.31 | 88.84 | 97.78 | |
| U-Prithvi | Bolivia | 87.81 | 79.68 | 95.93 | 93.19 | 88.28 | 98.10 | |
| U-Prithvi | Bolivia | 87.07 | 78.39 | 95.75 | 90.75 | 82.50 | 98.99 | |
4.4.2 Performance vs. Computational Effort
The U-Prithvi architecture is more complex than both the U-Net and the Prithvi-decoder architecture, which increases the computational effort required to train it. We explore the trade-off between computational effort and predictive performance by changing the number of epochs allowed for training. Table 4 shows the error metrics of the U-Prithvi model when training for different numbers of epochs. We find that a small number of epochs is enough to achieve stable performance in the case of the test set. For instance, the average IoU when training is within 1% of the model trained epochs. However, a minimum of is required to achieve most of the model potential in terms of generalization performance.
In both cases, training for more epochs keeps improving the predictive capacity, albeit at much smaller rates. In order to keep our architecture competitive in terms of computational complexity, we will use epochs of training when comparing it to other models.
4.4.3 Hyper-Parameter Tuning for U-Prithvi
| Bolivia set | IoU | Accuracy | |||||
|---|---|---|---|---|---|---|---|
| Parameter | Avg | Floods | Non-Floods | Avg | Floods | Non-Floods | |
| Combination operation | Add | 86.97 | 78.24 | 95.69 | 90.82 | 82.76 | 98.88 |
| Multiply | 86.39 | 77.40 | 95.38 | 91.27 | 84.26 | 98.29 | |
| Concat | 87.70 | 79.68 | 95.71 | 93.31 | 88.84 | 97.78 | |
| No-mask probability | 66% | 88.14 | 80.25 | 96.02 | 92.27 | 85.91 | 98.64 |
| 33% | 87.70 | 79.68 | 95.71 | 93.31 | 88.84 | 97.78 | |
| 16% | 87.95 | 79.96 | 95.94 | 92.29 | 86.07 | 98.52 | |
| Prithvi / U-Net Ratio | 0.5 : 0.5 | 85.51 | 76.01 | 95.01 | 91.06 | 84.20 | 97.92 |
| 1 : 2 | 87.07 | 78.34 | 95.80 | 90.34 | 81.45 | 99.23 | |
| 1 : 1 | 87.70 | 79.68 | 95.71 | 93.31 | 88.84 | 97.78 | |
| 2 : 1 | 87.42 | 79.34 | 95.50 | 94.06 | 90.94 | 97.17 | |
| Test set | |||||||
| Parameter | Avg | Floods | Non-Floods | Avg | Floods | Non-Floods | |
| Combination operation | Add | 89.57 | 81.82 | 97.31 | 93.12 | 87.16 | 99.08 |
| Multiply | 89.85 | 82.35 | 97.36 | 93.66 | 88.34 | 98.97 | |
| Concat | 89.73 | 82.21 | 97.24 | 94.81 | 91.15 | 98.46 | |
| No-mask probability | 66% | 89.20 | 81.19 | 97.22 | 92.73 | 86.38 | 99.09 |
| 33% | 89.73 | 82.21 | 97.24 | 94.81 | 91.15 | 98.46 | |
| 16% | 89.33 | 81.43 | 97.22 | 93.27 | 87.61 | 98.93 | |
| Prithvi / U-Net Ratio | 0.5 : 0.5 | 89.35 | 81.52 | 97.17 | 94.08 | 89.54 | 98.61 |
| 1 : 2 | 89.08 | 80.94 | 97.22 | 92.18 | 85.08 | 99.28 | |
| 1 : 1 | 89.73 | 82.21 | 97.24 | 94.81 | 91.15 | 98.46 | |
| 2 : 1 | 89.53 | 81.82 | 97.23 | 94.01 | 89.31 | 98.70 | |
We conducted experiments to determine the optimal hyperparameter configuration for U-Prithvi, testing three additional parameters: the combination operation, the mask probability for the RHM layer, and the ratio of feature embedding sizes between Prithvi and U-Net. Table 5 presents the performance of U-Prithvi under various configurations.
For the combination operation, we evaluated three alternatives: the original strategy of concatenating Prithvi and U-Net embeddings, as well as two additional approaches where embeddings were either summed or multiplied. Notably, these operations are feasible only because the embedding dimensions are identical. Our results indicate that concatenation yields the best performance on the out-of-sample Bolivia set, whereas multiplication performs best on the in-sample test set. However, the performance gains are too small to be statistically significant.
In the second experiment, we explored different probabilities for masking encoder outputs. The default no-mask probability of 33 % means that, with this probability, no part of the encoder outputs was masked. This setting provided the best results for the in-sample test set, whereas a higher no-mask probability of 66% was optimal for the out-of-sample Bolivia set. Similar to the combination operation, the differences between configurations were too minor to be considered statistically significant.
Finally, we examined the effect of varying the embedding size ratio between Prithvi and U-Net. In both test sets, using equal embedding sizes was preferable. We also tested reducing both embeddings by half and doubling each dimension in separate experiments. While performance on the Bolivia set dropped significantly when embedding sizes were halved, it improved only slightly when the Prithvi embedding dimension was doubled.
5 Conclusion
While the advent of geospatial foundational models will undoubtedly give way to novel and innovative methods for analyzing satellite imagery, work is still being done to assess their usefulness against CNN-based models. We contribute to a better understanding of this problem by not only comparing the strengths and weaknesses of the two approaches but also by suggesting a synergistic pathway that can leverage both through our novel U-Prithvi model. Our experiments for flood inundation mapping helped us answer our research questions. First, custom models such as U-Net outperform foundation models like Prithvi on in-sample data, yet the opposite is true for out-of-sample data. Then, we find that combining both architectures improves the performance of the Prithvi model on in-sample data without decreasing its capacity to generalize. Next, increasing the complexity of the U-Net model can produce results matching those of Prithvi. Finally, the proposed RandomHalfMask Layer produces significant performance improvements by balancing the learning between U-Net and Prithvi features. However, careful fine-tuning is necessary for this to yield optimal results. Based on this, we believe that combining a CNN-based deep learning model with a transformer-based foundational model, such as the one we’ve proposed with U-Prithvi, allows us to leverage the strengths of architectures like U-Net along with the generalizability of a foundation model. U-Net’s multi-scale feature learning helps capture finer spatial details in image classification, while the extensive training dataset used for the foundation model enhances the fused model’s ability to generalize to previously unseen areas in satellite imagery.
This work not only increases our understanding of transformer-based foundation models compared to more commonly used CNN models in the geospatial field, but also enhances our capabilities for flood inundation mapping. The ability of U-Prithvi to accurately capture flood extents while generalizing to any geographic region has important applications for real-time flood mapping and disaster response management. Incorporating a pre-trained, open-source model like Prithvi, which abstracts away the high compute costs of training on massive amounts of satellite imagery, makes flood mapping more accessible and feasible for governments, companies, and non-profit organizations alike to leverage its capabilities. Moreover, our approach could be applied in near-real-time as satellite images are collected to aid in post-hurricane or post-tsunami disaster response to not only understand the extent of potential damage but also to coordinate response efforts to where it is most needed on the ground. Beyond its significance in disaster response, accurately mapping flood extents has significant value for modeling and understanding Earth’s biogeochemical cycles, especially as climate change is anticipated to result in more frequent storm surges and increased sea level rise. Knowing exactly when and where areas are flooded, or inundated, has important implications for Earth’s carbon cycles. For example, wetland ecosystems emit methane when flooded, a potent greenhouse gas. Thus, understanding the total extent of flooding is vital to modeling and predicting total methane emissions arising from these ecosystems to develop more robust climate mitigation strategies. Overall, the method we developed here can be applied to a variety of environmental, human safety, and climate-related challenges.
Future work could strengthen this model by increasing the amount of data used for training and fine-tuning, incorporating alternate data sources such as SAR data via a multi-modal approach, or by configuring the framework to be able to ingest higher resolution commercial CubeSat data to achieve results at higher spatial and temporal resolutions. This study focuses specifically on the Prithvi model, but future research could explore integrating it with other geospatial foundation models. Moreover, increased testing on the results of foundation models versus other common machine learning and deep learning models would also be beneficial to the community. While the application studied here is flood inundation mapping, we anticipate this framework could be applied to similar remote sensing and geospatial classification tasks such as land cover mapping, fire detection, or crop monitoring with reasonable accuracy.
References
- [1] November 2024. URL: https://github.com/cloudtostreet/Sen1Floods11.
- [2] Akhyar Akhyar, Mohd Asyraf Zulkifley, Jaesung Lee, Taekyung Song, Jaeho Han, Chanhee Cho, Seunghyun Hyun, Youngdoo Son, and Byung-Woo Hong. Deep artificial intelligence applications for natural disaster management systems: A methodological review. Ecological Indicators, 163:112067, June 2024. doi:10.1016/j.ecolind.2024.112067.
- [3] Reza Azad, Ehsan Khodapanah Aghdam, Amelie Rauland, Yiwei Jia, Atlas Haddadi Avval, Afshin Bozorgpour, Sanaz Karimijafarbigloo, Joseph Paul Cohen, Ehsan Adeli, and Dorit Merhof. Medical image segmentation review: The success of u-net. IEEE Transactions on Pattern Analysis and Machine Intelligence, 46(12):10076–10095, 2024. doi:10.1109/TPAMI.2024.3435571.
- [4] Roberto Bentivoglio, Elvin Isufi, Sebastian Nicolaas Jonkman, and Riccardo Taormina. Deep learning methods for flood mapping: a review of existing applications and future research directions. Hydrology and Earth System Sciences, 26(16):4345–4378, August 2022. doi:10.5194/hess-26-4345-2022.
- [5] Amrendra Bhushan, Vikas Chandra Goyal, and Arun Lal Lal Srivastav. Greenhouse gas emissions from inland water bodies and their rejuvenation: a review. Journal of Water and Climate Change, page jwc2024561, October 2024. doi:10.2166/wcc.2024.561.
- [6] Derrick Bonafilia, Beth Tellman, Tyler Anderson, and Erica Issenberg. Sen1floods11: a georeferenced dataset to train and test deep learning flood algorithms for sentinel-1. In 2020 IEEE/CVF Conference on Computer Vision and Pattern Recognition Workshops (CVPRW), pages 835–845, June 2020. doi:10.1109/CVPRW50498.2020.00113.
- [7] Liang-Chieh Chen, George Papandreou, Iasonas Kokkinos, Kevin Murphy, and Alan L. Yuille. Deeplab: Semantic image segmentation with deep convolutional nets, atrous convolution, and fully connected crfs. IEEE Transactions on Pattern Analysis and Machine Intelligence, 40(4):834–848, April 2018. doi:10.1109/TPAMI.2017.2699184.
- [8] Martin Claverie, Junchang Ju, Jeffrey G. Masek, Jennifer L. Dungan, Eric F. Vermote, Jean-Claude Roger, Sergii V. Skakun, and Christopher Justice. The harmonized landsat and sentinel-2 surface reflectance data set. Remote Sensing of Environment, 219:145–161, December 2018. doi:10.1016/j.rse.2018.09.002.
- [9] Jesline Daniel, J. T. Anita Rose, F. Sangeetha Francelin Vinnarasi, and Venkatesan Rajinikanth. Vgg-unet/vgg-segnet supported automatic segmentation of endoplasmic reticulum network in fluorescence microscopy images. Scanning, 2022(1):7733860, 2022. doi:10.1155/2022/7733860.
- [10] Jia Deng, Wei Dong, Richard Socher, Li-Jia Li, Kai Li, and Li Fei-Fei. ImageNet: A large-scale hierarchical image database. In 2009 IEEE Conference on Computer Vision and Pattern Recognition, pages 248–255, June 2009. ISSN: 1063-6919. doi:10.1109/CVPR.2009.5206848.
- [11] Ian Goodfellow, Yoshua Bengio, and Aaron Courville. Deep Learning. MIT Press, 2016. URL: http://www.deeplearningbook.org.
- [12] Boran Han, Shuai Zhang, Xingjian Shi, and Markus Reichstein. Bridging Remote Sensors with Multisensor Geospatial Foundation Models, April 2024. arXiv:2404.01260. doi:10.48550/arXiv.2404.01260.
- [13] Ali Hatamizadeh, Yucheng Tang, Vishwesh Nath, Dong Yang, Andriy Myronenko, Bennett Landman, Holger Roth, and Daguang Xu. UNETR: Transformers for 3D Medical Image Segmentation, October 2021. arXiv:2103.10504. doi:10.48550/arXiv.2103.10504.
- [14] Xin He, Yong Zhou, Jiaqi Zhao, Di Zhang, Rui Yao, and Yong Xue. Swin Transformer Embedding UNet for Remote Sensing Image Semantic Segmentation. IEEE Transactions on Geoscience and Remote Sensing, 60:1–15, 2022. doi:10.1109/TGRS.2022.3144165.
- [15] Chang Huang, Yun Chen, Shiqiang Zhang, and Jianping Wu. Detecting, extracting, and monitoring surface water from space using optical sensors: A review. Reviews of Geophysics, 56(2):333–360, 2018. doi:10.1029/2018RG000598.
- [16] Intergovernmental Panel On Climate Change (Ipcc). Climate Change 2021 – The Physical Science Basis: Working Group I Contribution to the Sixth Assessment Report of the Intergovernmental Panel on Climate Change. Cambridge University Press, July 2023. doi:10.1017/9781009157896.
- [17] Johannes Jakubik, Sujit Roy, C. E. Phillips, Paolo Fraccaro, Denys Godwin, Bianca Zadrozny, Daniela Szwarcman, Carlos Gomes, Gabby Nyirjesy, Blair Edwards, Daiki Kimura, Naomi Simumba, Linsong Chu, S. Karthik Mukkavilli, Devyani Lambhate, Kamal Das, Ranjini Bangalore, Dario Oliveira, Michal Muszynski, Kumar Ankur, Muthukumaran Ramasubramanian, Iksha Gurung, Sam Khallaghi, Hanxi, Li, Michael Cecil, Maryam Ahmadi, Fatemeh Kordi, Hamed Alemohammad, Manil Maskey, Raghu Ganti, Kommy Weldemariam, and Rahul Ramachandran. Foundation models for generalist geospatial artificial intelligence. CoRR, November 2023. arXiv:2310.18660. doi:10.48550/arXiv.2310.18660.
- [18] A. Emily Jenifer and Sudha Natarajan. Deepflood: A deep learning based flood detection framework using feature-level fusion of multi-sensor remote sensing images. JUCS - Journal of Universal Computer Science, 28(33):329–343, March 2022. doi:10.3897/jucs.80734.
- [19] Wenwen Li, Hyunho Lee, Sizhe Wang, Chia-Yu Hsu, and Samantha T. Arundel. Assessment of a new geoai foundation model for flood inundation mapping. CoRR, November 2023. arXiv:2309.14500. doi:10.48550/arXiv.2309.14500.
- [20] Zhouyayan Li and Ibrahim Demir. U-net-based semantic classification for flood extent extraction using sar imagery and gee platform: A case study for 2019 central us flooding. Science of The Total Environment, 869:161757, April 2023. doi:10.1016/j.scitotenv.2023.161757.
- [21] Yuchi Ma, Shuo Chen, Stefano Ermon, and David B. Lobell. Transfer learning in environmental remote sensing. Remote Sensing of Environment, 301:113924, February 2024. doi:10.1016/j.rse.2023.113924.
- [22] Gonzalo Mateo-Garcia, Joshua Veitch-Michaelis, Lewis Smith, Silviu Vlad Oprea, Guy Schumann, Yarin Gal, Atılım Güneş Baydin, and Dietmar Backes. Towards global flood mapping onboard low cost satellites with machine learning. Scientific Reports, 11(1):7249, March 2021. doi:10.1038/s41598-021-86650-z.
- [23] Matias Mendieta, Boran Han, Xingjian Shi, Yi Zhu, and Chen Chen. Towards Geospatial Foundation Models via Continual Pretraining, August 2023. arXiv:2302.04476. doi:10.48550/arXiv.2302.04476.
- [24] Yohei Nakayama, Jiawei Su, and Luis M. Pazos-Outón. SatSwinMAE: Efficient Autoencoding for Multiscale Time-series Satellite Imagery, October 2024. arXiv:2405.02512. doi:10.48550/arXiv.2405.02512.
- [25] Maxim Neumann, Andre Susano Pinto, Xiaohua Zhai, and Neil Houlsby. In-domain representation learning for remote sensing, November 2019. arXiv:1911.06721. doi:10.48550/arXiv.1911.06721.
- [26] Keiller Nogueira, Otávio A. B. Penatti, and Jefersson A. dos Santos. Towards better exploiting convolutional neural networks for remote sensing scene classification. Pattern Recognition, 61:539–556, January 2017. doi:10.1016/j.patcog.2016.07.001.
- [27] Fernando Pech-May, Raúl Aquino-Santos, Omar Álvarez Cárdenas, Jorge Lozoya Arandia, and German Rios-Toledo. Segmentation and visualization of flooded areas through sentinel-1 images and u-net. IEEE Journal of Selected Topics in Applied Earth Observations and Remote Sensing, 17:8996–9008, 2024. doi:10.1109/JSTARS.2024.3387452.
- [28] Olivier Petit, Nicolas Thome, Clément Rambour, and Luc Soler. U-Net Transformer: Self and Cross Attention for Medical Image Segmentation, March 2021. arXiv:2103.06104. doi:10.48550/arXiv.2103.06104.
- [29] Olaf Ronneberger, Philipp Fischer, and Thomas Brox. U-net: Convolutional networks for biomedical image segmentation. CoRR, May 2015. arXiv:1505.04597 [cs]. arXiv:1505.04597.
- [30] Rizwan Sadiq, Zainab Akhtar, Muhammad Imran, and Ferda Ofli. Integrating remote sensing and social sensing for flood mapping. Remote Sensing Applications: Society and Environment, 25:100697, January 2022. doi:10.1016/j.rsase.2022.100697.
- [31] Apoorva Shastry, Elizabeth Carter, Brian Coltin, Rachel Sleeter, Scott McMichael, and Jack Eggleston. Mapping floods from remote sensing data and quantifying the effects of surface obstruction by clouds and vegetation. Remote Sensing of Environment, 291:113556, June 2023. doi:10.1016/j.rse.2023.113556.
- [32] Nahian Siddique, Sidike Paheding, Colin P. Elkin, and Vijay Devabhaktuni. U-net and its variants for medical image segmentation: A review of theory and applications. IEEE Access, 9:82031–82057, 2021. doi:10.1109/ACCESS.2021.3086020.
- [33] Zhongbin Su, Wei Li, Zheng Ma, and Rui Gao. An improved u-net method for the semantic segmentation of remote sensing images. Applied Intelligence, 52(3):3276–3288, February 2022. doi:10.1007/s10489-021-02542-9.
- [34] Mirela G. Tulbure, Mark Broich, Vinicius Perin, Mollie Gaines, Junchang Ju, Stephen V. Stehman, Tamlin Pavelsky, Jeffrey G. Masek, Simon Yin, Joachim Mai, and Luc Betbeder-Matibet. Can we detect more ephemeral floods with higher density harmonized landsat sentinel 2 data compared to landsat 8 alone? ISPRS Journal of Photogrammetry and Remote Sensing, 185:232–246, March 2022. doi:10.1016/j.isprsjprs.2022.01.021.
- [35] Yuefei Wang, Xi Yu, Yixi Yang, Shijie Zeng, Yuquan Xu, and Ronghui Feng. FTUNet: A Feature-Enhanced Network for Medical Image Segmentation Based on the Combination of U-Shaped Network and Vision Transformer. Neural Processing Letters, 56(2):83, March 2024. doi:10.1007/s11063-024-11533-z.
- [36] Michael A. Wulder, Jeffrey G. Masek, Warren B. Cohen, Thomas R. Loveland, and Curtis E. Woodcock. Opening the archive: How free data has enabled the science and monitoring promise of landsat. Remote Sensing of Environment, 122:2–10, July 2012. doi:10.1016/j.rse.2012.01.010.
- [37] Qiming Yang, Zixin Wang, Shinan Liu, and Zizheng Li. Research on improved u-net based remote sensing image segmentation algorithm. In 2024 6th International Conference on Internet of Things, Automation and Artificial Intelligence (IoTAAI), pages 686–689, July 2024. doi:10.1109/IoTAAI62601.2024.10692547.
- [38] Bofei Zhao, Haigang Sui, and Junyi Liu. Siam-dwenet: Flood inundation detection for sar imagery using a cross-task transfer siamese network. International Journal of Applied Earth Observation and Geoinformation, 116:103132, February 2023. doi:10.1016/j.jag.2022.103132.