Search Space Reduction Using Species Distribution Modeling with Simulated Pollen Signatures

Abstract
Microscopic trace materials, such as pollen, are an important category of forensic evidence recovered during investigations. As an environmentally ubiquitous substance that can attach to various surfaces, pollen enables the linking of objects and people in space and time. In this study, we assessed the extent to which the search space could be reduced using simulated pollen signatures. These signatures were compiled by randomly selecting pairs of geographic coordinates on the Earth’s terrestrial land and querying the Global Biodiversity Information Facility (GBIF) database to identify plant taxa within 50 meters of the coordinates. These taxa were then treated as the parent taxa of the pollen, simulating the hypothetical attachment of pollen signatures to objects or individuals. For each identified pollen taxon, we modeled habitat suitability for the parent plant taxa and combined the spatial distributions to refine the geolocation search area. Since the actual coordinates for these locations of interest were known, we were able to evaluate the global performance of the search space reduction under the assumption of an extreme constraint that no other contextual information was available.
Keywords and phrases:
geoforensics, species distribution modeling, search space reductionCopyright and License:
2012 ACM Subject Classification:
Information systems Geographic information systemsFunding:
The research was partly funded by DEVCOM ARL, ARO through a Multidisciplinary University Research Initiative Grant (#W911NF1910231). The research, interpretations, and perspectives reported here are those of the authors and should not be attributed to the Army or the Department of Defense.Editors:
Katarzyna Sila-Nowicka, Antoni Moore, David O'Sullivan, Benjamin Adams, and Mark GaheganSeries and Publisher:
1 Introduction
Geoforensic applications incorporate data collection and analytical methods from spatial data science, remote sensing, and earth sciences to aid forensic investigations in environmental issues, criminal justice, and human rights [5]. Pollen grains and signatures are suitable candidates for trace evidence retrieved during investigations in geoforensic analyses because of their environmental ubiquity and durability [6, 4, 2]. DNA metabarcoding with high-throughput sequencing technologies dramatically improved pollen identification in quantity and taxonomic accuracy, leading to potentially more reliable applications of such forensic evidence (Bell et al. 2016). New research using environmental DNA samples such as pollen in species distribution models (SDM) for geoforensic location analysis has shown promise [8]. These models are used to quantify species-environment correlations which can then be used to predict the habitat suitability or potential plant species distribution in a geographic information system [3].
In this study, we use an SDM framework to reduce the search space of geographic location(s) associated with an object (e.g., laptop, clothes, person) and use simulated pollen signatures to test its applicability. The simulated pollen signatures were obtained by generating random coordinates as locations of interest worldwide and then downloading plant species data from the Global Biodiversity Information Facility (GBIF) within a specified distance from these locations to establish simulated pollen signatures. We then considered these locations of interest as the locations that an object traveled through. For each pollen signature, we estimated SDMs for its parent taxa and used a scaled-sum method to combine the relative suitability of the different plant species associated with the object. Since the geographic coordinates for these locations of interest were known for simulated examples, we could evaluate the performance of the search space reduction (or search score) under the assumption of an extreme constraint that only the pollen taxa, serving as the trace material, is known. Investigators typically have a general understanding of the potential activity boundaries of individuals in a given case. However, this information may not always be available, especially for international cases where people travel and objects move between continents. Thus, this research usually assumes two scenarios for the objects of interest:
-
1.
We have limited information about the objects of interest; for example, they are traveling within the United States
-
2.
There is no information on any location history of the objects of interest a priori
For the second scenario, investigators may need to set larger potential areas of interest. The modeling approach requires processing a large amount of data during geographic attribution at a large spatial extent. As a result, such efforts pose a data challenge that is more computationally demanding. To deal with this challenge, we build the geographic attribution workflow at a global extent using Google Earth Engine (GEE), a cloud-based geospatial platform designed to support large-scale modeling across broad spatial extents with petabyte-scale data access and fast computation.
2 Methods
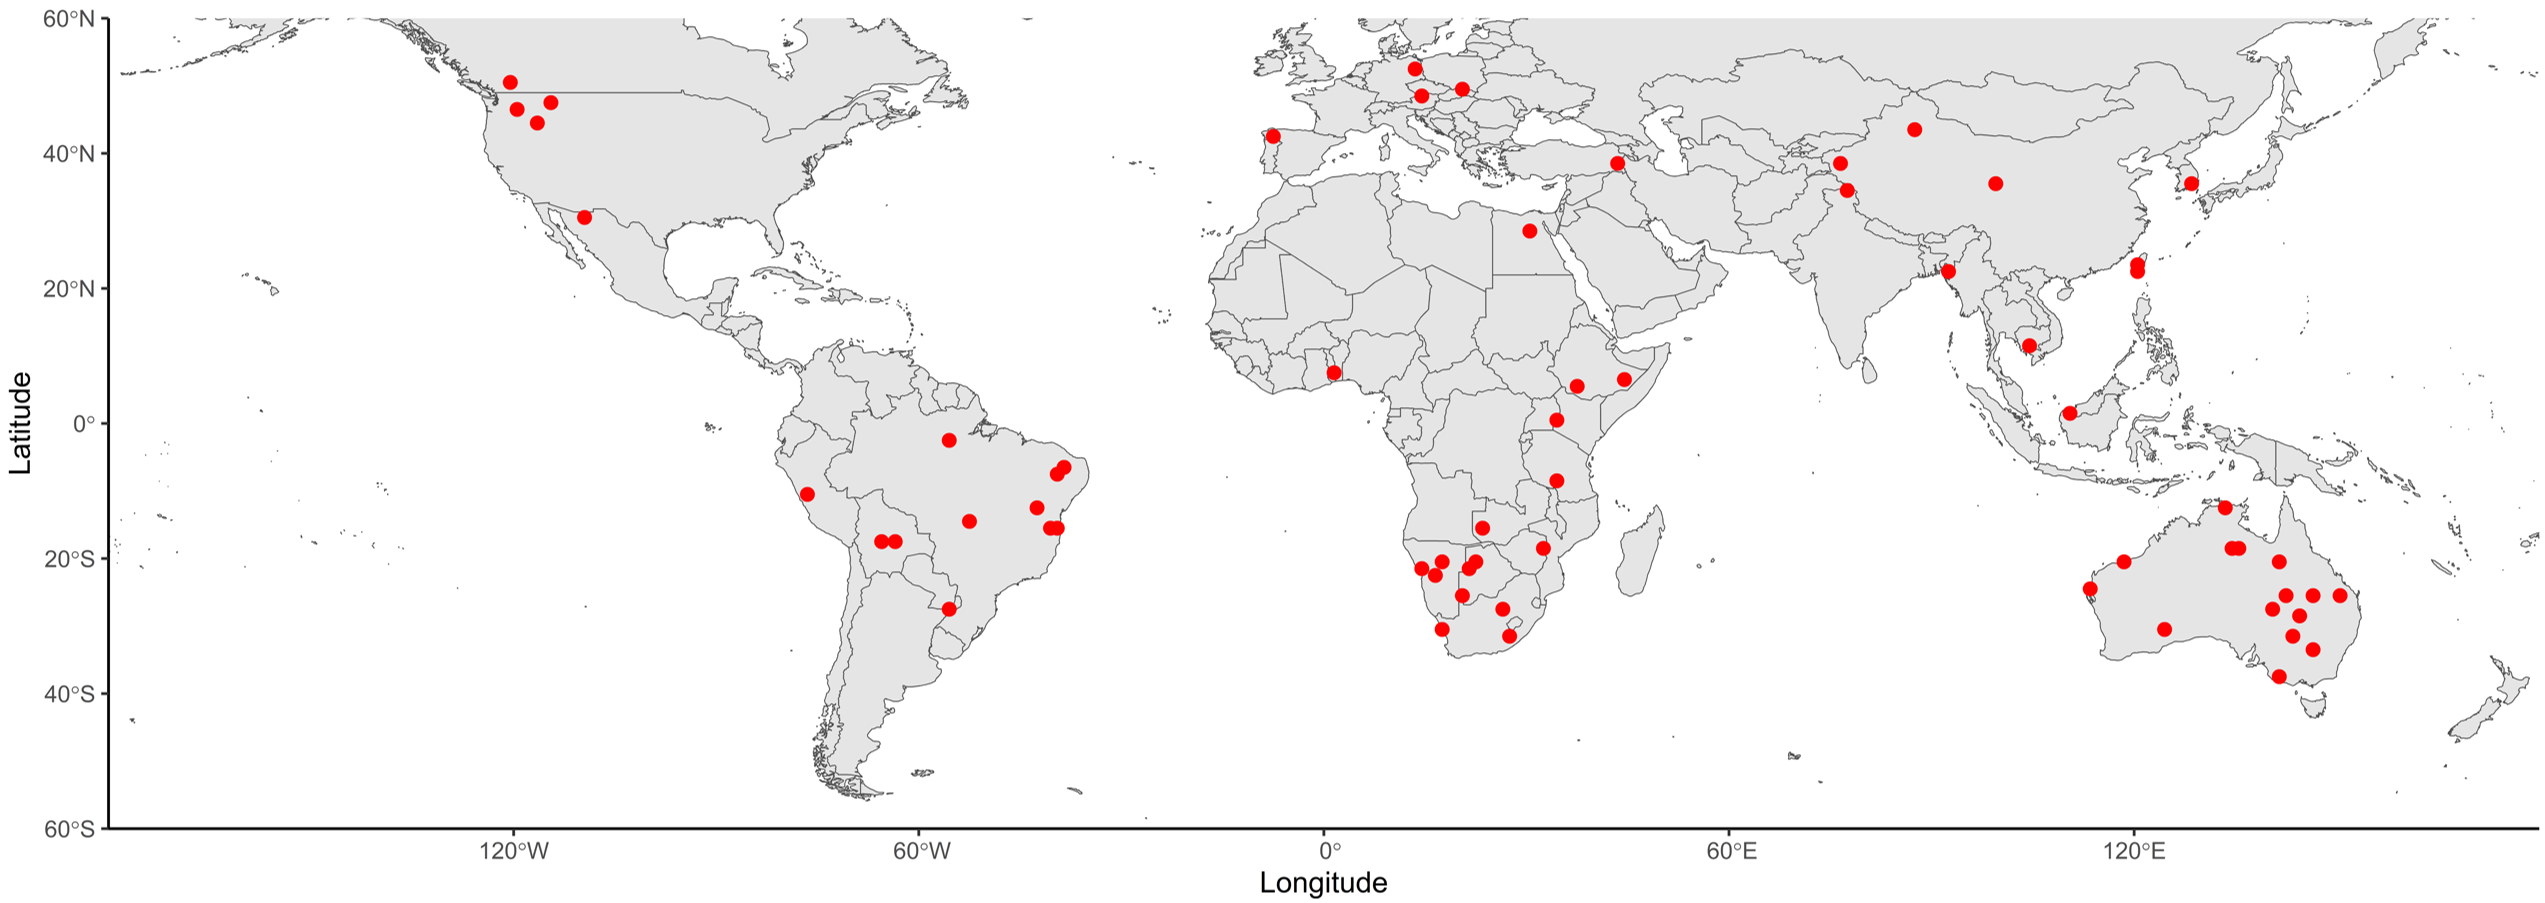
We randomly generated 9,999 points on global terrestrial land and queried GBIF for plant occurrences within 50 meters of each point. These queries generated 65 locations of interest that have at least more than one plant taxa found within the 50-meter distance threshold 1. We here assumed a 100% probability of pollen adhering to objects or individuals. In other words, we assumed objects traveled to this location and picked up pollen grains from their parent plants. There are 246 unique plant taxa associated with the 65 locations of interest. The data structure of the simulated pollen signatures can be found in Table 1. While the locations and plant species used in this approach are real, we use the word simulation to refer to the process of collecting the object and identifying plant species from it in comparison to one based on fieldwork sampling.
To strengthen the comparison between simulated and real-world conditions, we incorporated sampled pollen signatures as a reference, we also included the previously calculated search space seduction scores from fieldwork-sampled pollen signatures. The sampled pollen signatures were directly collected using sampling instruments in the great Austin area, Texas, with different sampling methods including air pollen samplers and stationary fabric samples. Pollen grains were then identified in the laboratory with light microscopy and DNA metabarcoding. This process then approximates the real-world attaching of pollen onto different surfaces. With sampled pollen signatures, we can further compare search space reduction results by incorporating both simulated and real-world sampling methods.
We also used a null model approach as a baseline to compare how well our geographic attribution method performed against random chance. In the null model, we assigned the same number of pollen taxa to randomly chosen locations, but instead of selecting them based on geographic proximity (within 50 meters of a known location), we randomly picked them from the overall pool of simulated pollen signatures. This approach helps determine whether the geographic patterns we observed in the simulated data are meaningful or if they could have occurred by random chance. By comparing the results of the simulated pollen signatures to those from the null model, we can evaluate whether our method provides useful search space reduction beyond what would be expected randomly.
| Simulated Pollen Signatures | |||||
| Locations of Interest | L. ramosissima | M. citriodora | A. columbianum | … | |
| (-114.552, 47.547) | 1 | 1 | 1 | … | |
| (92.588, 22.596) | 0 | 0 | 1 | … | |
| (-55.542, -27.573) | 0 | 1 | 0 | … | |
| … | … | ||||
The spatial extent of the SDMs in this study was terrestrial land on all continents except Antarctica, from W to E and S to N as shown in Figure 1. The SDM-based geographic attribution workflow is open-source and implemented using the Google Earth Engine (GEE) Python API. We selected only georeferenced occurrences with locations on terrestrial land with an occurrence limit of 5,000 using a programmatic interface rgbif that queries species occurrence records [1]. Since the occurrence data from open-source global databases such as GBIF does not have associated absence data, the SDM requires other forms of absence information, such as samples of background or pseudo-absence data. Considering the computational feasibility of fitting SDMs on GEE, we set a spatial resolution of 900 m for this study and created pseudo-absences on cells that are less similar in terms of the environmental conditions to the cells with presence data using the k-means clustering method. We fit SDMs with two methods, Random Forest (RF) and Boosted Regression Trees (BRT), using the machine learning classifiers in the Statistical Machine Intelligence and Learning Engine (SMILE) available on GEE. The training and testing processes were implemented on km spatial blocks with an 80/20 training/testing data split. The Area under the Receiver Operating Characteristic Curve () was used as the SDM classification performance metric. Variables related to temperature, precipitation, and elevation were selected as environmental predictors for modeling habitat suitability in this study. To get temperature and precipitation variables, 19 bioclimatic layers at a 30 arc-second spatial resolution from the WorldClim V1 Bioclim dataset were retrieved in GEE (Hijmans et al. 2005).
After fitting SDMs, the next step is to combine the distribution maps to estimate the geolocation of the object when multiple species have been identified. Studies have used joint probabilistic approaches for target distribution estimation, often assuming independent occurrences of taxa, but a zero probability from any taxa can incorrectly exclude locations unless mitigated by techniques like setting a minuscule probability. To address this problem, we followed [7] and [8] and used a scaled-sum method to generate joint suitability maps to combine single-taxa SDM prediction results of the objects with more than one pollen taxa recovered that maintain relative suitabilities. To achieve this, we use notations i, j as indices of longitude/latitude pixels on a species suitability map with total pixels, where and . We also employ k as the genus/species of pollen identified on the target object, where , if n types of pollen taxa are recovered. For an SDM-generated suitability distribution of a plant taxon, we can generate a suitability matrix . The is a single-taxa suitability score generated from SDMs at a location in the study extent. We can then derive a joint suitability distribution map for each object of interest. We define a percentile approach in environmental space to evaluate the geographic attribution results of the objects. We can link the joint suitability maps by computing the percentile of numeric pixel values from all cells for each map. Since each joint suitability map of geographic attribution for every modeling method is only dependent on the suitability distributions in a given study area extent, whether a modeling method can or cannot identify an object at a numeric percentile is an evaluation metric comparable across methods and sampling regions. If we use layers to generate a joint suitability map , then for each joint suitability layer of an object of interest, we have the percentile for each pixel value on , ranging from . A pixel with a higher percentile indicates a greater likelihood that the object of interest has traveled in or around this location, analogous to suitability in spatial modeling. Specifically, we can calculate a percentile of the sampling location of an object to assess the geolocation accuracy resulting from the geographic attribution. We call this specific value a search space reduction (SSR) score:
| (1) |
SSR score is a metric that can retrospectively assess how well the method could reduce the search space by comparing the joint suitability value between the object’s location and all other locations. Equation 1 produces SSR scores between 0 and 100, where a higher score indicates that fewer pixels on the joint suitability map have suitability scores greater than or equal to that of the object’s actual location.. We use this concept in this research to evaluate the performance of the geographic attribution process. It is important to stress here again that this SSR score based upon the joint suitability method is a proxy for location suitability to identify location history.
3 Results and Discussion

results of 0.75 or higher for 90% of the plant taxa classifications indicate overall useful predictive performance from SDMs. For the simulated sites, both BRT and RF models resulted in a search space reduction (SSR) score > 99.95 for around half of the locations. Figure 2 shows the distribution of the search scores of the locations of interest derived from simulated pollen signatures and sampled pollen signatures shown in blue and green color. The null model distribution with randomly assigned pollen signatures is in red. The distribution of most null model SSR scores is below the 75 search space percentile, which means they do not provide useful information for search space reduction. The distribution of the SSR scores yielded from simulated pollen signatures is concentrated at the 99th percentile, while the majority of the locations of interest have the highest SSR scores with sampled pollen signatures, which can also be noted in the zoomed-in smoothed density plot in Figure 2.
To provide a more detailed analysis, we used an additional sub-figure that highlights the upper-end distribution of SSR scores using both BRT and RF models. The zoomed-in density plots in the lower panel of Figure 2 emphasize the peak concentration of sampled and simulated pollen signatures at the extreme high SSR scores. This supports the hypothesis that geolocation using sampled and simulated pollen provides significantly better search space reduction than random pollen attachment, as represented by the null model. The BRT model demonstrates a slightly broader spread of high SSR scores compared to the RF model, potentially indicating model-specific differences in how species distribution models generalize habitat suitability.
SSR scores derived from simulated pollen signatures can be compared with the geographic attribution results from sampled pollen signatures. To introduce uncertainty in pollen adherence, we can adjust the probability of pollen attachment to objects/people to values less than 1, allowing us to assess the sensitivity of the SSR modeling to that parameter. Although multiple potential search regions can be identified, investigators and decision-makers could use these refined maps to reference location history at higher percentiles of areas of interest, especially when combined with other lines of evidence. Future analyses should explore the robustness of these distribution patterns across different geographic extents, alternative modeling techniques, and additional environmental variables to assess their impact on SSR performance. Additionally, integrating higher-resolution pollen data or refining taxonomic resolution may further enhance the precision of location attribution in forensic geospatial investigations.
References
- [1] Scott Chamberlain, Vijay Barve, Dan Mcglinn, Damiano Oldoni, Peter Desmet, Laurens Geffert, and Karthik Ram. Rgbif: Interface to the Global Biodiversity Information Facility API, April 2022.
- [2] Edward Helderop, Tony H. Grubesic, Elisa Jayne Bienenstock, Skaidra Smith-Heisters, Haoyu Wang, and Jennifer A. Miller. Geoforensic Palynology Search Models and Human-Mediated Secondary Pollen Deposition. The Professional Geographer, 77(2):1–13, 2025. doi:10.1080/00330124.2024.2434473.
- [3] Jennifer A. Miller. Species distribution models: Spatial autocorrelation and non-stationarity. Progress in Physical Geography: Earth and Environment, 36(5):681–692, October 2012. Publisher: SAGE Publications Ltd. doi:10.1177/0309133312442522.
- [4] Wangshu Mu, Daoqin Tong, Tony H. Grubesic, Hung-Chi Liu, Edward Helderop, Jennifer A. Miller, and Elisa Jayne Bienenstock. Geoforensics with Pollen Quantification: A Spatial Perspective. Annals of the American Association of Geographers, 113(9):1–17, 2023. doi:10.1080/24694452.2023.2211155.
- [5] Alastair Ruffell and Jennifer McKinley. Geoforensics. John Wiley & Sons, October 2008. Google-Books-ID: f3UCEAAAQBAJ.
- [6] Libby A. Stern, Jodi B. Webb, Debra A. Willard, Christopher E. Bernhardt, David A. Korejwo, Maureen C. Bottrell, Garrett B. McMahon, Nancy J. McMillan, Jared M. Schuetter, and Jack Hietpas. Geographic Attribution of Soils Using Probabilistic Modeling of GIS Data for Forensic Search Efforts. Geochemistry, Geophysics, Geosystems, 20(2):913–932, 2019. doi:10.1029/2018GC007872.
- [7] Haoyu Wang, Jennifer A. Miller, Tony H. Grubesic, and Shalene Jha. A Framework for Using Ensemble Species Distribution Models for Geographic Attribution in Forensic Palynology. In 2022 IEEE International Symposium on Technologies for Homeland Security (HST), pages 1–7, November 2022. doi:10.1109/HST56032.2022.10025427.
- [8] Haoyu Wang, Jennifer A. Miller, Tony H. Grubesic, and Shalene Jha. Using habitat suitability models for multiscale forensic geolocation analysis. Transactions in GIS, 27(3):777–796, 2023. doi:10.1111/tgis.13052.