MODAP: A Multi-City Open Data & Analytics Platform for Micromobility Research

Abstract
Over the past decade, micromobility services, particularly electric vehicles for personal short-distance trips, have experienced significant growth. Major cities around the world now host extensive fleets of vehicles available for short-term public rental. While previous research has examined usage patterns within and between a few select cities, large, open, and publicly accessible data sets for analyzing mobility across multiple cities are extremely limited. I have collected, curated, and aggregated over twenty million e-scooter and e-bicycle trips across five major cities and are openly releasing aggregated data for use by mobility and sustainable transport researchers, urban planners, and policymakers. To accompany these data, I developed MODAP (Micromobility Open Data & Analytics Platform), a geovisual analytics tool that empowers researchers to explore the temporal and regional patterns of e-mobility trips within our open data set and download the data for offline analysis. My objective is to foster further research into city-scale mobility patterns and to equip researchers, community members, and policymakers with the necessary tools to conduct this work.
Keywords and phrases:
open data, mobility, geovisualization, micromobilityCopyright and License:
2012 ACM Subject Classification:
Information systems Geographic information systems ; Human-centered computing Geographic visualizationSupplementary Material:
Software (Source Code): https://github.com/grantdmckenzie/modap [14]archived at
Editors:
Katarzyna Sila-Nowicka, Antoni Moore, David O'Sullivan, Benjamin Adams, and Mark GaheganSeries and Publisher:
1 Introduction
Analysis of urban mobility, namely investigating how people move through cities, is important for a wide range of applications such as tracking the spread of diseases, designing equitable and accessible cities, and mitigating the impacts of climate change. As urban populations continue to grow [27], gaining access to real urban mobility data has become increasingly important for policymakers, city planners and researchers [22]. While the curation of large-scale urban mobility data sets is expanding, access often comes with significant challenges. Traditional data sources, such as travel surveys, are costly to collect, while alternative sources, such as ride-hailing or social media check-in data, are typically siloed by private companies making them inaccessible to the public, researchers, and even municipal transport agencies. In recent years, data sharing has become even more restricted due to the threat of these data being used to train proprietary foundation models.
Urban transportation has undergone a shift over the past decade with the commercialization of existing modes of transport (e.g., shared bicycles) and the emergence of new micromobility options such as e-scooters. Shared micromobility systems, operated by private companies, have been deployed in hundreds of cities worldwide, offering fleets of short-term rental vehicles ranging from a few dozen to several thousand per city. Due to regulatory efforts taken by many municipalities, micromobility operators are often required to provide publicly accessible application programming interfaces (APIs) that report the real-time locations of available vehicles. While originally intended for regulatory oversight and safety compliance, these APIs have also enabled third-party integration, such as embedding them into navigation services like Google Maps.
Today, shared micromobility has become an integrated component of urban transportation ecosystems, with over 172 millions trips having taken place in North America last year alone [21]. Access to trip-level micromobility data is invaluable for understanding mobility behavior, optimizing transportation networks, and informing policy decisions. In this work, I introduce an open, multi-city data set of micromobility trips, detailing the data collection process and limitations of my methodology. Additionally, I present a geovisual analytics platform that encourages users to interactively explore the data through a web-based interface. This platform enables users, including those without technical expertise, to visualize spatial patterns in trip distributions, temporal variations, and differences across micromobility modes, providing an accessible tool for urban mobility analysis. In more explicit terms, the objectives of this work are as follows.
-
1.
To collect, clean, curate, and publish an open mobility data set of e-scooters and e-bicycle trips in five major cities around the world.
-
2.
To develop a web platform to both serve the data and provide exploratory geovisual analytics functionality with the goal of democratizing data analytics and empowering those with limited ability or capacity to analyze the data offline.
-
3.
To demonstrate the utility of these data through a showcase of several exploratory mobility analyses.
2 Background
Micromobility research has become increasingly important in urban mobility studies as a growing number of cities integrate the services into their transportation ecosystems. At this point, a large body of research has explored various dimensions of micromobility, including regional variability in usage patterns [28], equity implications [7], and the impacts of micromobility on health [2] and safety [29]. This range of topics speaks to the importance of understanding micromobility’s role in shaping urban accessibility, sustainability, and public health outcomes.
More broadly, the field of mobility analytics has emerged as a distinct subfield of data analytics [3, 20]. City and transportation planners increasingly rely on sensor-based mobility technologies, and the data they collect, to gain insights into urban activity patterns [9, 25]. Both public transit agencies and ride-hailing companies (e.g., Uber) utilize mobility data and spatial analytics tools to optimize their service delivery and identify where investments and enhancements should be made [23, 11].
Geovisual analytics platforms are a key component of the analytical landscape. Such platforms integrate interactive data visualization, geospatial analysis, and user-focused tools to help stakeholders identify and interpret complex spatiotemporal patterns [5]. These platforms democratize data analytics by providing web-based, user-friendly interfaces that require minimal coding expertise or access to specialized computer hardware. A wide range of such platforms are in use today, empowering users to conduct analysis on a variety of topics, from air pollution dynamics [30] or pandemic mobility patterns [6] to social network structures [8] and place-based similarity metrics [18].
The role of open data in advancing mobility and urban research is equally important. Open mobility data sets have facilitated transportation research for decades. They have lowered the cost of developing transport services and supported the creation of mobility/transport planning tools. The quintessential example of this is TriMet, Portland’s transit agency, which in 2005 became one of the first agencies to publish its transit schedule in a machine-readable format. This effort enabled third-party developers (and researcher teams) to build new tools and conduct analyses based on these data [13].
Recently, researchers have put substantial efforts into producing open mobility data sets with the objective of broadening access to critical transportation information [4, 32]. For example, Tenkanen and Toivonen [26] published a longitudinal open travel time data set for multiple mobility modes in Helsinki, Finland, while Kashiyama et al. [10] compiled a comprehensive Japan-wide mobility data set from travel surveys. Complementary efforts have focused on establishing data standards and specifications. The Open Mobility Foundation, for instance, works with municipalities, industry stakeholders, and academic researchers to develop standardized mobility data specifications for real-time data sharing.111https://www.openmobilityfoundation.org/
My work builds on these efforts by emphasizing the need for more open mobility data, geovisual exploration, and open analytics platforms. By encouraging more accessible investigation of mobility data, these data and tools contribute not only to advances in geographic information science and transportation planning, but also the broader intersection of mobility, environment, and society.
3 Data & Methodology
3.1 Data collection & cleaning
The data reported through this work were accessed from three dockless micromobility operators, namely Tier, Lime, and Flamingo. Each of these operators runs dockless fleets of vehicles meaning that users can start or end a trip in any public space and the vehicles are not parked at dedicated docking stations. Data from only one operator per city were accessed. Table 1 provides an overview of the final micromobility data sets including the operators, number of trips, type of vehicle(s), and time period of data collection. These trip count values are from after the data has been cleaned.
| City | Trip Count | Vehicle Type | Time Period | Operator |
|---|---|---|---|---|
| Berlin, DE | 11,761,219 | e-scooter (92%), e-bike | 2020-08 – 2024-05 | Tier |
| London, UK | 1,192,227 | e-scooter (46%), e-bike | 2021-08 – 2024-04 | Tier |
| Paris, FR | 4,848,310 | e-scooter (81%), e-bike | 2020-08 – 2024-04 | Tier |
| Washington, D.C., US | 5,951,082 | e-scooter (67%), e-bike | 2022-09 – 2024-05 | Lime |
| Wellington, NZ | 1,052,900 | e-scooter (100%) | 2021-11 – 2024-05 | Flamingo |
The data were accessed via public-facing application programming interfaces (API). With every request, these APIs (Table 2) return a set of all available vehicles for the requested city, in JSON format. Relevant attribute information include vehicle identifier, geographic coordinates for the current location of the vehicle, vehicle type, and battery level. Each of these APIs were accessed every 60 seconds for the duration of data collection, stated in Table 1. At time of writing, the Lime and Flamingo APIs are still operational, however, Tier merged with another micromobility operator in mid-2024 and discontinued their API at the end of 2024.
| City | Operator | URL |
|---|---|---|
| Berlin, DE | Tier | https://platform.tier-services.io/v2/vehicle?zoneId=berlin |
| London, UK | Tier | https://platform.tier-services.io/v2/vehicle?zoneId=london |
| Paris, FR | Tier | https://platform.tier-services.io/v2/vehicle?zoneId=paris |
| Washington, D.C., US | Lime | https://data.lime.bike/api/partners/v1/gbfs/washington _dc/free_bike_status |
| Wellington, NZ | Flamingo | https://api.flamingoscooters.com/gbfs/wellington/free_bike_ status.json |
Provided the set of available vehicles every 60 seconds, trips were identified by noting when a vehicle disappeared from the set of available vehicles (trip start) and when it reappeared in the set of available vehicles (trip end). Given the frequency of requests, this means that trips are accurate to a highest temporal resolution of one minute.
Provided an initial set of trips for each city, the data were then cleaned. Specifically, all trips where the battery level increased between the start and end of a trip were removed from analysis as an increase in battery level suggested that these were recharging/rebalancing trips completed by the operator. Similarly, trips where the average velocity exceeded 20km/hour were removed. All operators in the dataset limit their vehicles to a maximum of 20km/hour. Velocity was calculated as Euclidean distance between origin and destination divided by trip duration. Since full trajectories are not available, average speed is likely underestimated. In addition, trips shorter than 200m or five minutes were removed as well as those longer than 20 km or two hours in duration. This cleaning was done to remove vehicle adjustments and outliers in the data (see [15] for further details).
It is important to mention here that since the emergence of shared micromobility services, the ways in which data have been published via API has changed significantly. Today, many operators obfuscated their vehicle identifiers by randomizing them with every API call. Importantly, for all operators in the data set, I can confirm that the vehicle identifiers are not obfuscated. Lime does obfuscate the identifier in the vehicle_id field, but does not for the vehicle identifier in the rental_uris parameter. This allows for tracking a vehicle over API requests.
3.2 Data aggregation
Completing the process above resulted in a set of micromobility trip for each of the five cities. Trips included the geographic coordinates of the origin and destination as well as the start time and end time, to the nearest minute.
I then identified three different geospatial units for aggregating the trip data. My motivation for aggregation is presented in the discussion section. The geographies include: 1. Socio-political boundaries. These are sub-city level administration units such as neighborhoods, districts, or traffic analysis zones within a city. As these are determined by the country or city, I understand them to be organized based on the characteristics of the population or physiographic features. 2. Hexagon grid at a 1,000 meter resolution and 3. Hexagon grid at a 500 meter resolution. These two hexagonal grids are uniform geometries that ignore population and physical geography. I felt it important to aggregate at a range of resolutions as these data can be used for different purposes by different stakeholders. The origins and destinations of all trips were intersected with the three different geographies to produce the spatial data sets available for download and analysis.
Temporally, all trips that started or ended within a geographic region were split into either weekday or weekend and origins were aggregated to the nearest hour. As with the spatial aggregation, this allows for dettailed temporal trend analysis but does not allow for the identification of individual trips or users within the data.
| Column | Data Type | Description |
|---|---|---|
| gid_o | String | Geographic identifier for the origin of a trip |
| gid_d | String | Geographic identifier for the destination of a trip |
| v_type | String | Type of vehicle: escooter or ebicycle |
| td_mean | Float | Mean duration of trips between two geographies |
| td_median | Float | Median duration of trips between two geographies |
| t_count | Integer | Total count of trips between two geographies |
Finally, these data were cleaned to remove all geometries that contained no trips and all relevant data were compressed into a series of zipped folders for download. Each zipped directory includes four files: 1. A GeoJSON file containing polygons for the selected geography, 2. A meta data file containing relevant details on the source of the data and provenance information, 3. A Trip_OD.csv file containing counts and average duration between pairs of origins and destinations, and 4. A Region_Details.csv file containing temporal distribution of trips per geographic region. The data dictionaries for these last two files are presented in Table 3 and Table 4, respectively. These data have been prepared for all five cities and all three geographies and are published under a Creative Commons (CC BY 4.0) license.222https://creativecommons.org/licenses/by/4.0/
| Column | Data Type | Description |
|---|---|---|
| gid | String | Geographic Identifier |
| od | String | Origin or destination: “o” or “d” |
| v_type | String | Type of vehicle: escooter or ebicycle |
| week | Integer | Weekday (1) or weekend (0) |
| hour | Integer | Hour of the day (0-23) |
| td_mean | Float | Mean duration of trips to/from geography |
| td_median | Float | Median duration of trips to/from geography |
| t_count | Integer | Total count of trips between to/from geography |
4 Platform
I developed an online, browser-based platform for visual exploration and analysis of the micromobility data. The current platform was designed for a standard computer screens and has not yet been adapted for small screened mobile device. It is available at https://platial.science/modap and was designed for two purposes.
The first purpose is to provide an accessible platform for data exploration and pattern discovery. Given the complexity and sheer volume of data, non-technical stakeholders and the general public may find it challenging to navigate. This tool was designed to empower users by allowing them to explore the data independently, compare temporal variations in specific regions against citywide trends, and focus on areas of particular interest.
The second purpose is to provide a platform through which researchers, government agencies, and industry professionals can download the raw data to be use for detailed analyses. Given the volume and different dimensions of the data, I felt it important offer users the ability to first interact with the data through the platform in order to see the mobility data “in-action” before downloading the individual data sets for analysis.
4.1 Features
The MODAP platform boasts a number of features. These features have been numerically labeled in Figure 1 and are referenced in the following descriptive paragraphs in parentheses.
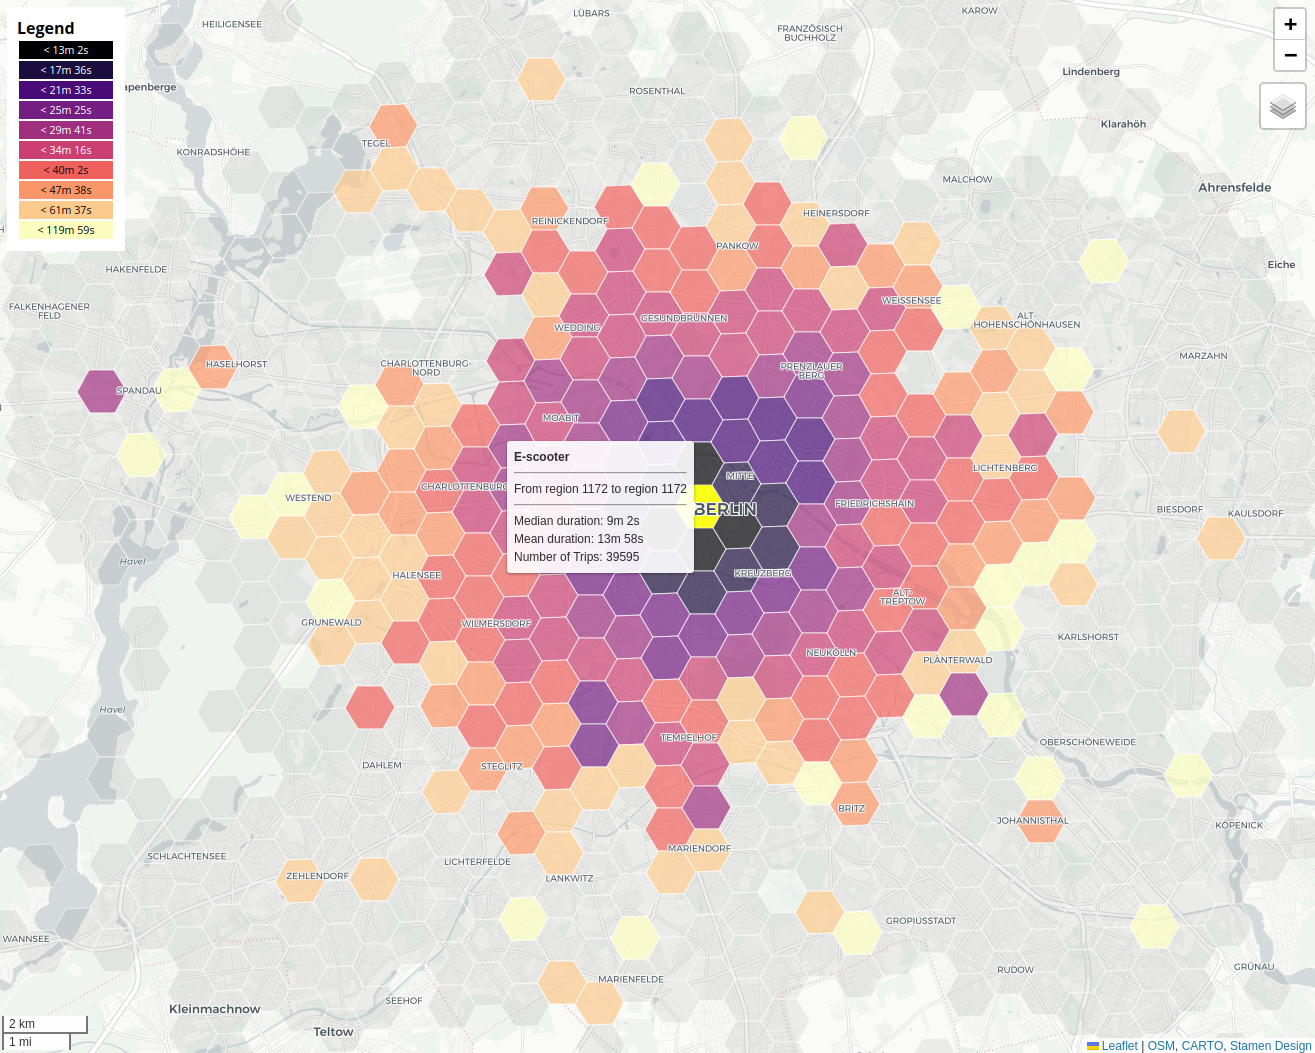
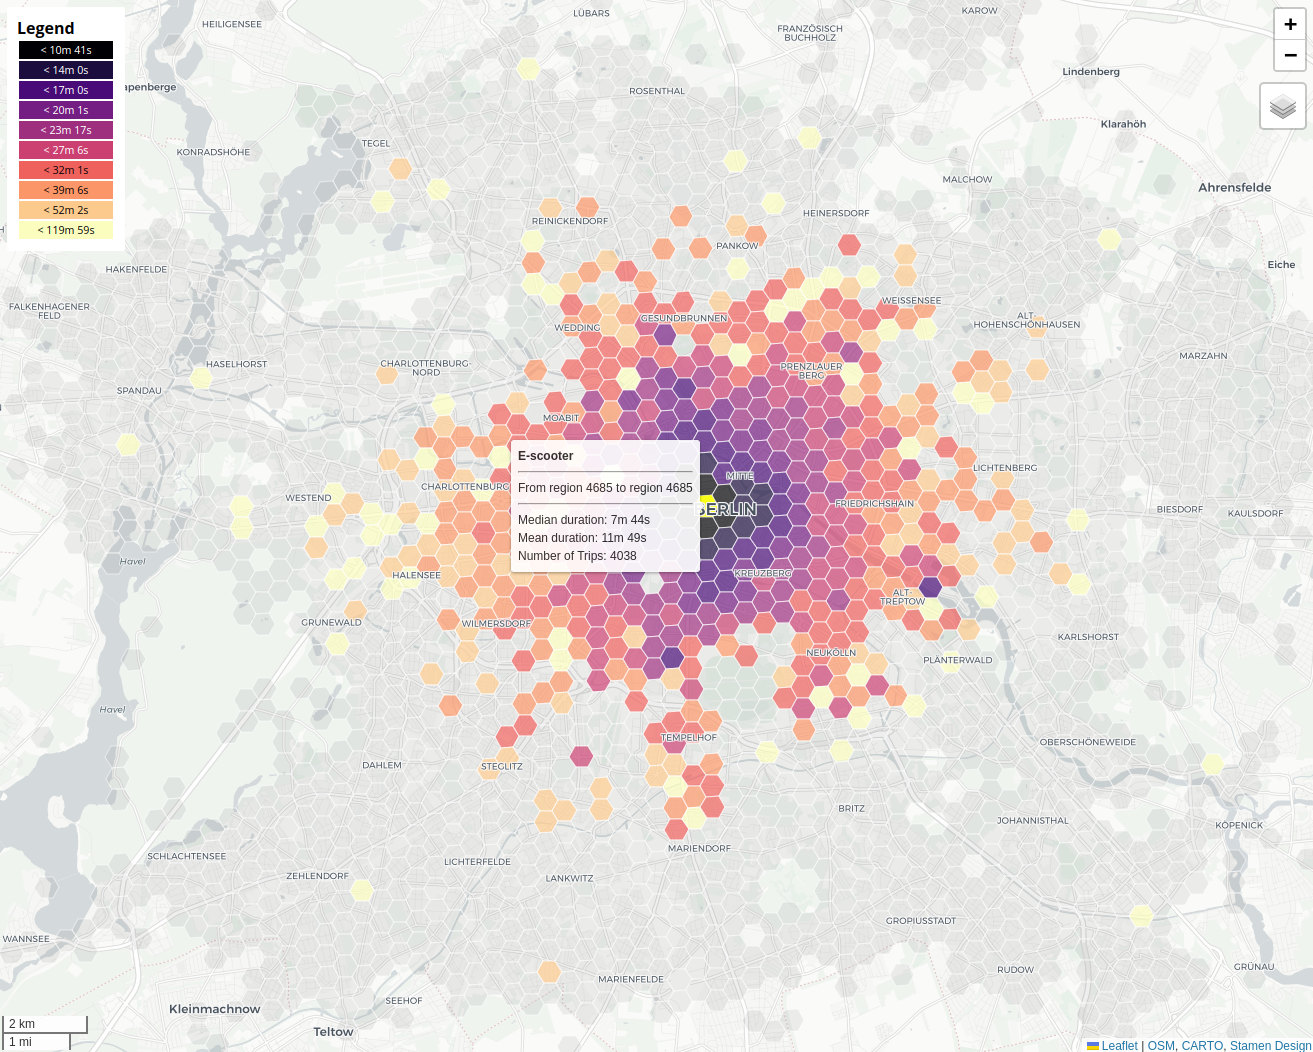
Map Pane (1).
The map makes up the majority of the view and is the main point of interaction with the spatial data. This map includes standard tools for panning and zooming, and the ability to change the base map and toggle labels. Once a city and geography are selected, a user is invited to click a geographic region on the map. Once selected, the mobility data are symbolized on the map and a legend is provided. A user can click on the legend to rotate through different color palettes. A user can then hover their mouse over different regions to view details including number and average duration of trips that originate in the selected region (highlighted in yellow) and finishes in the mouse-hovered region.
Selectors (2).
On the right side of the platform, there are a set of drop down selectors at the top of the page. These selectors (Green) are comprised of 1. The City Selector which allows users to pick a city and is the first point of interaction for the platform. 2. The Geographies Selector, allowing users to select from three possible options of geographic polygons (Figure 2). This defaults to administrative regions. 3. The OD Selector asks users if they would like to view trips by their origin or by their destination (defaults to origin). 4. When there is more than one vehicle type, the Vehicle Selector asks users to select either e-scooters or e-bikes.
General Details (3).
Under the Selectors are two large information panes that present the total number of trips per vehicle type for the selected city as well as the average duration for the selected vehicle type in the selected city.
Hourly Volume Graph (4).
A dynamic graph displays trip data based on hour of an aggregated day. The average number of trips (as a percentage of all trips) is shown for weekdays and weekends for (a) the city as a whole and (b) for the geographic region selected on the map. This view permits users to compare selected regions to the overall hourly mobility patterns for the city overall. Users can hover their mouse over points on the graph to view more detailed numbers on the percentage of trips taken per hour.
Duration Graph (5).
A dynamic graph showing a histogram of trip durations at five minute intervals. As with the Hourly Volume Graph, the percentage of city trips are shown in a lighter color with the selected geographic region trips shown in a darker purple. This allows users to compare their selected geographic region to the overall city pattern.
Buttons (6).
At the bottom right of the screen there are two buttons. The Data Download allows users to download the data for the city they selected, aggregated to the geography through which they are viewing the data. The Source Information provides metadata related to the data currently being visualized. This includes trip count information, operator, dates, etc.
4.2 Architecture
MODAP is built using completely open source software and the source code is also published as open source at https://github.com/grantdmckenzie/modap. On the server, the platform is running a LAPP333Linux, Apache, PostGreSQL, PHP architecture. Specifically, Ubuntu Linux running Apache 2 as the web server. All data are stored in a PostGreSQL relational database with the PostGIS extension allowing for spatial queries. Requests from the client (browser) are handled by a set of PHP scripts. Data downloads have been pre-processed, stored, and shared on the Open Science Framework at https://github.com/grantdmckenzie/modap. The front-end is a combination of HTML5, CSS3, and JavaScript. Two JavaScript frameworks are employed for various features. These are Leaflet444https://leafletjs.com for the web mapping functionality and Chart.js555https://chartjs.org for the dynamic graphs. All other functionalities were developed with native JavaScript.
5 Data showcase
In this section I highlight a few examples of the types of analysis that can be done either through the MODAP web platform or with the open data after downloading.
5.1 Platform-based exploratory analysis
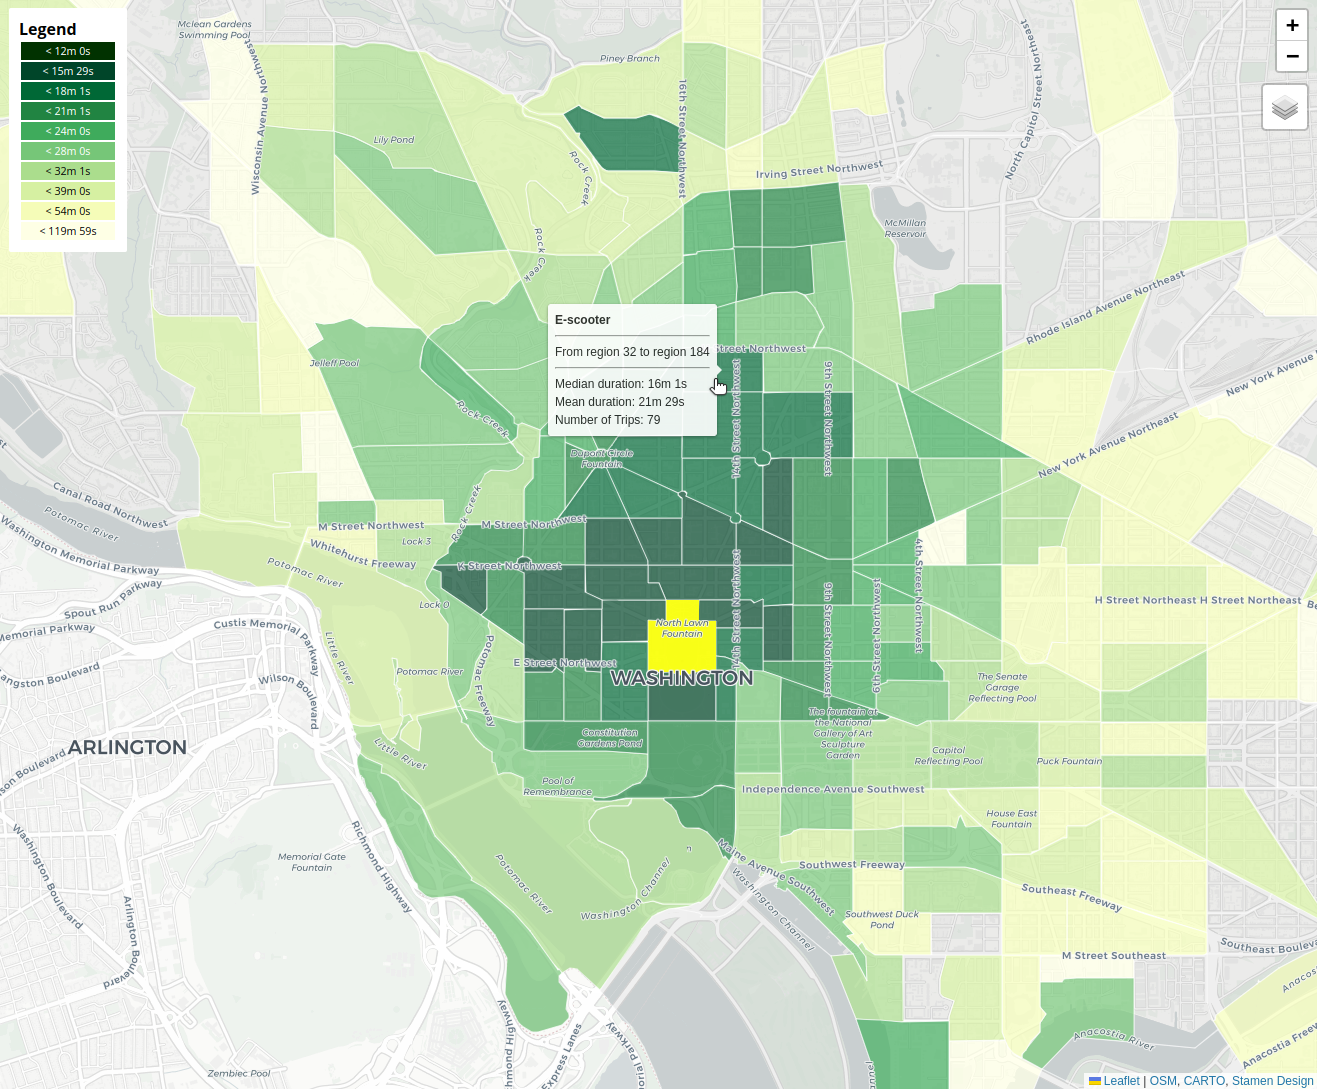
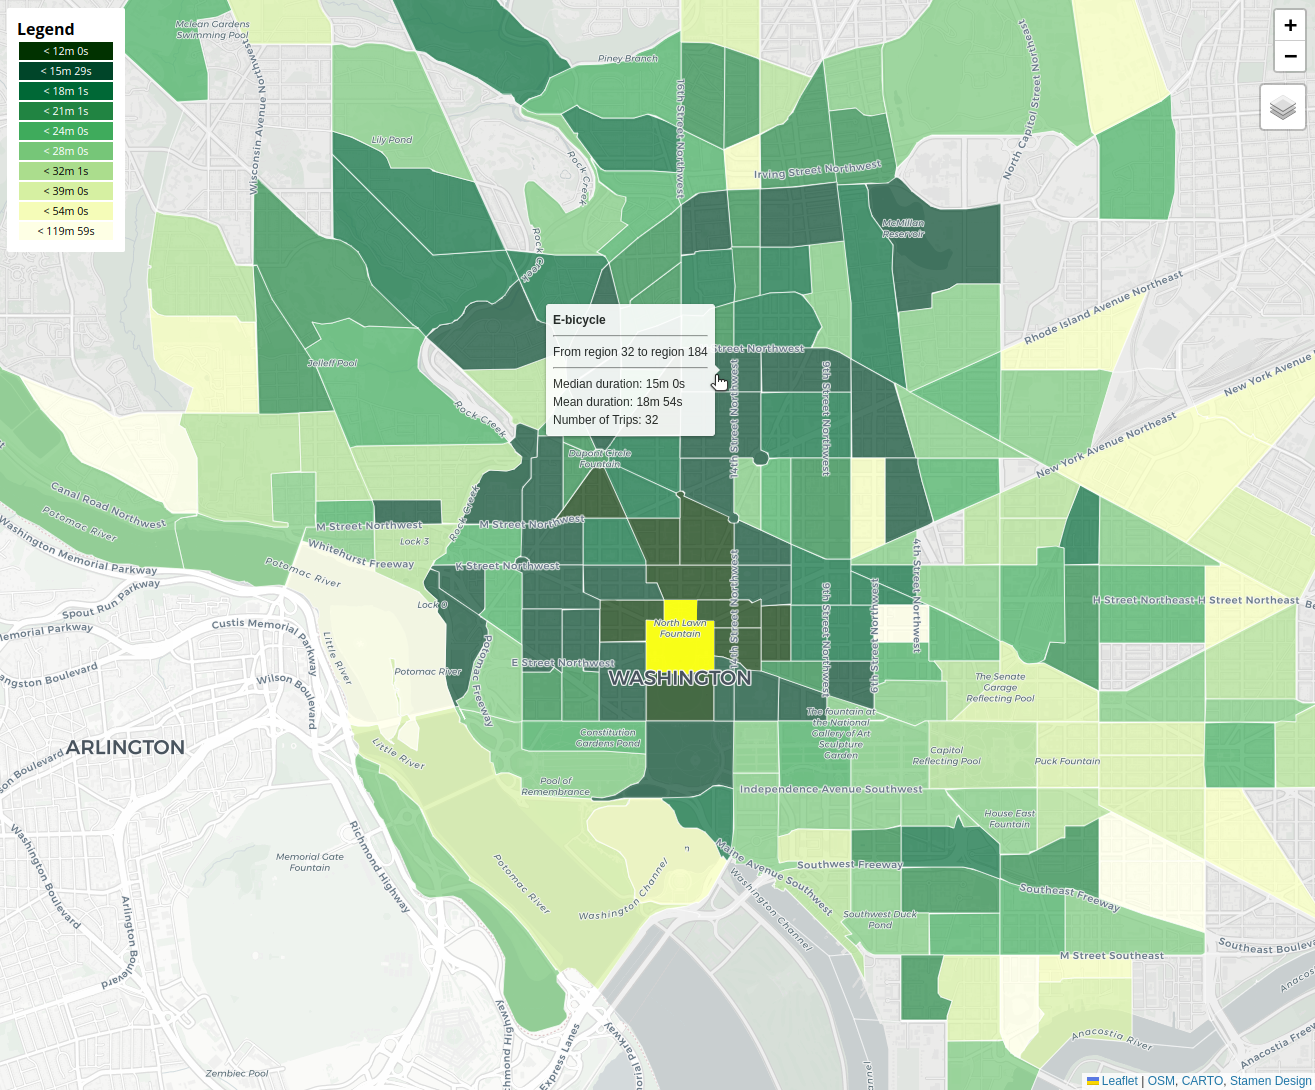
As previously mentioned, the platform is designed for visual exploration of micromobility data, aiming to inspire new ideas and facilitate quick analysis of regional and temporal differences across cities, sub-regions, and vehicle types. For instance, one can select a region in a city such as Washington, D.C. and toggle between e-scooters and e-bicycles to identify the difference in trip duration between the selected region and all surrounding regions. Figure 3 shows such a selection. Since the legend remains constant between vehicle types, one can quite easily see that trips taken on e-bicycles travel to further destinations than e-scooters, while maintaining a similar duration. This is especially true for regions in the North of the city. By hovering over different destination regions, one can also view the mean and median duration differences between the two vehicle types.
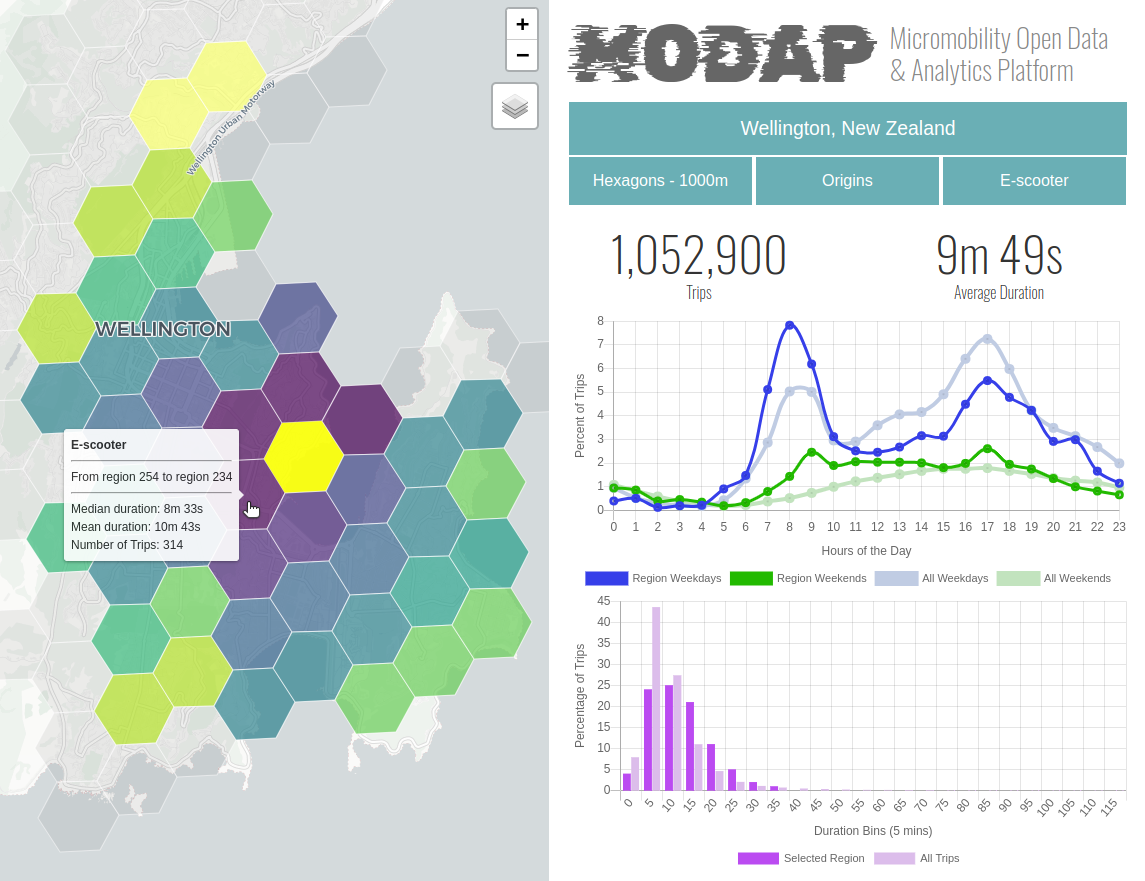
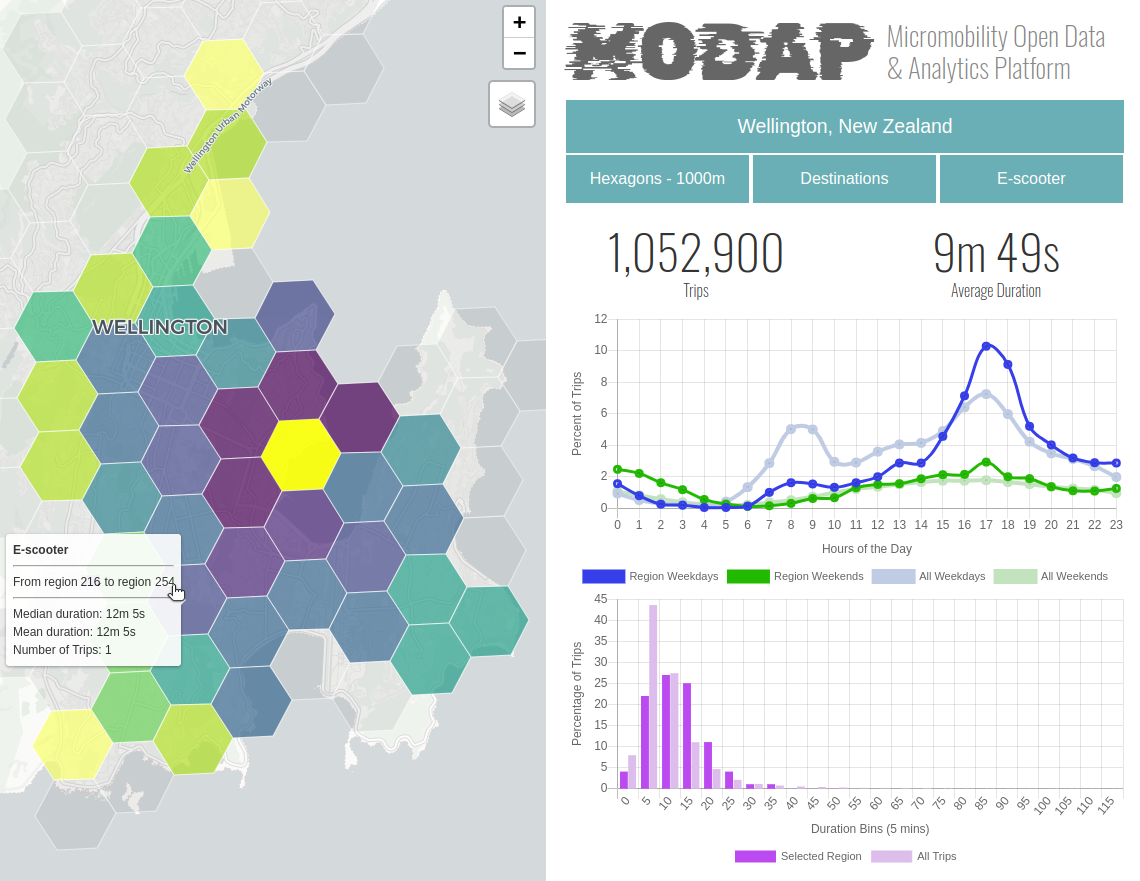
Other analysis might focus on the difference in micromobility temporal patterns depending of if a region is a trip origin or a destination. Figure 4 shows a selected region in Wellington, New Zealand. Figure 4(a) shows the temporal patterns for the region when it is the origin of a trip. The dominant time period for trips originating in this region is during the morning commute on weekdays. We can see that it is higher than the city average, as shown in lighter blue. Compare that to the same region as a destination (Figure 4(b)). In this case, we find that the dominant time period is evening commuting hours, peaking at 17:00. Based on this exploratory analysis, one might make the initial assumption that the region is zoned to be residential. This might then spark further investigation into land use, socio-economic data, elevation, etc. in the selected and neighboring regions.
5.2 Analysis with downloaded open data
While the MODAP web platform was designed for visual exploration and analysis of the data, a user also has the ability to download the data sets and run their own analysis offline. These data support a wide range of analytical approaches and research questions. Here, I highlight a few simple examples to illustrate their potential.
One could compare the durations and times across all cities in the data sets to identify the most similar cities and most different cities. For instance, comparing various e-vehicle behavior has been a topic of interest recently [1, 17]. Through these open data, one can identify the difference in trip durations between e-scooters and e-bicycles in London, United Kingdom, for example. Figure 5 shows a density plot of each vehicle’s trip durations. This could be compared to other cities and used to inform policymakers on the suitability of these different vehicle types in their cities.

One could also use these data to identify the relationship between sex (male and female)666Reported as sex identified at birth in the UK Census. and micromobility trip volume in London, United Kingdom (Figure 6). To accomplish this, I accessed the demographic data from the UK 2021 Census777https://www.ons.gov.uk/census at the Middle layer Super Output Areas (MSOA) level and ran an areal interpolation [24] of the MSOA’s data to assign male and female population counts to the same 1,000 meter hexagon geography published through MODAP . Then, having data at the same geospatial resolution, I ran a Bivariate Moran’s I analysis comparing trip volume and percent female population in the city of London. The results report a Bivariate Moran’s I value of -0.2043 () with a z-score of -5.8137. This suggests that there is a a significant inverse spatial relationship between the two data sets, or rather that there is a strong relationship between micromobility trips and regions with higher male residential populations. This simple analysis is meant to demonstrate how these data could be used and further study might investigate additional factors related to the built environment and other socio-economic factors.
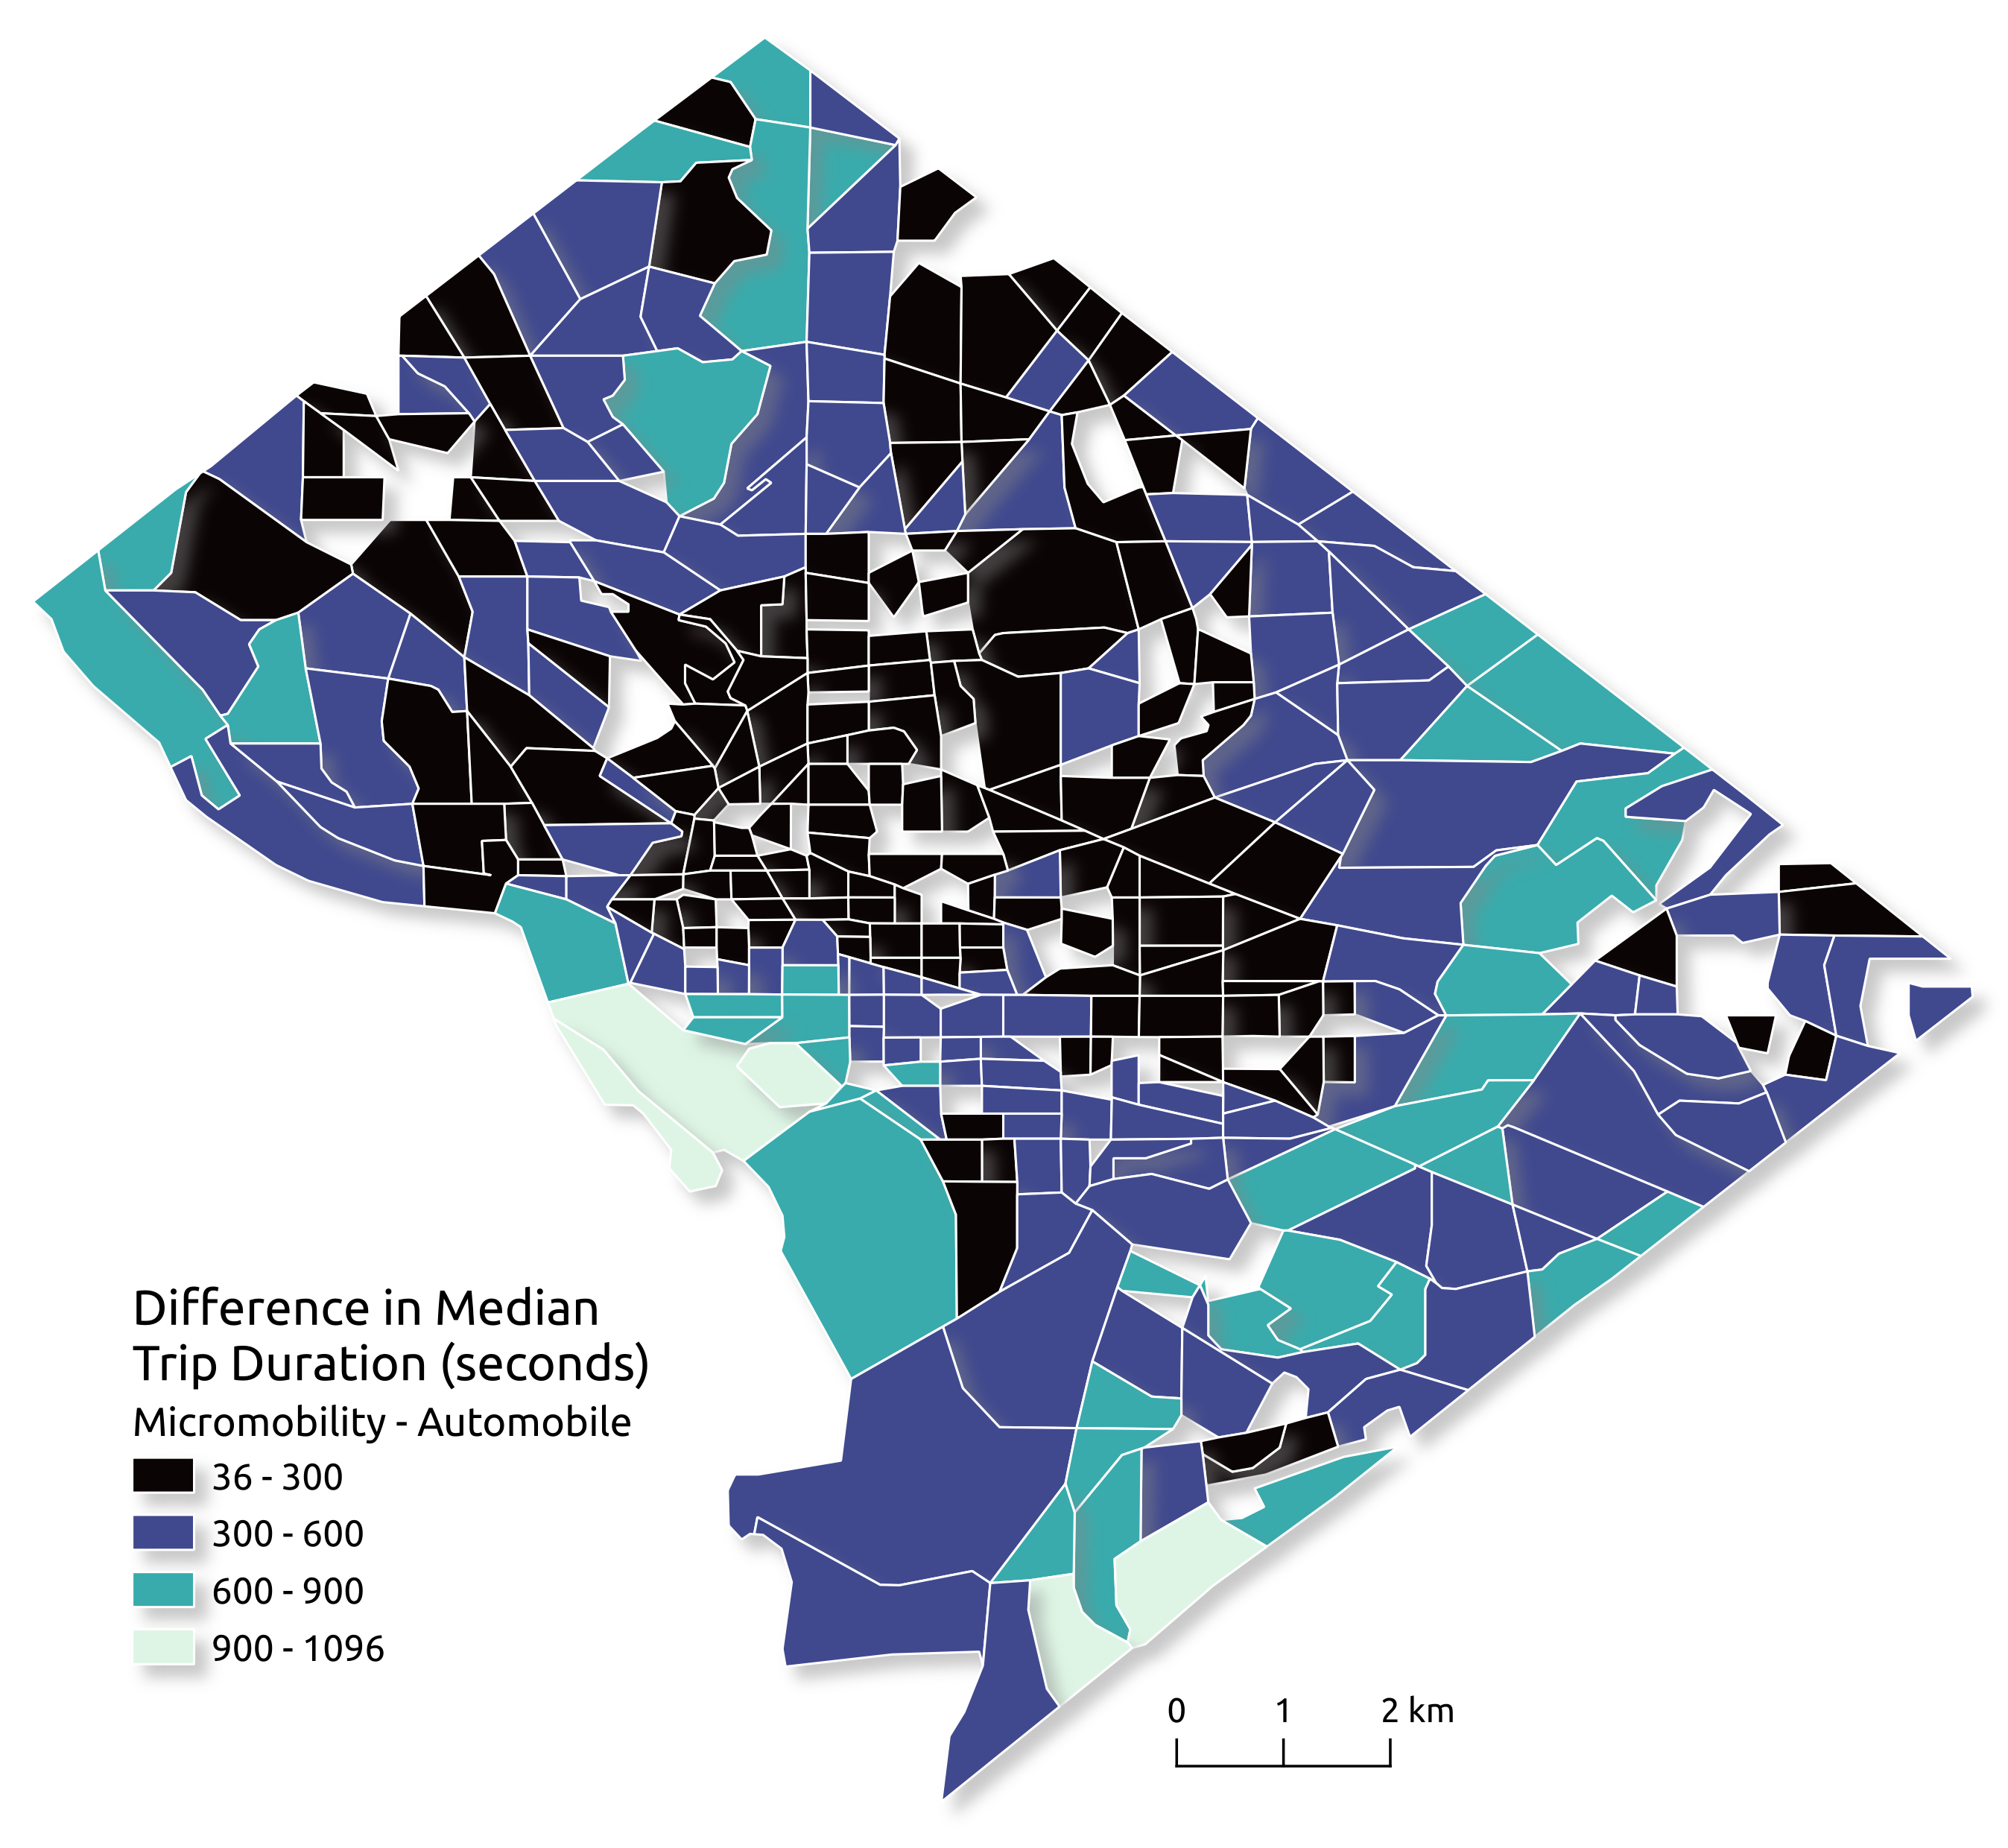
Finally, one could compare micromobility usage to automobile usage in a city. In this example I investigate spatial and temporal differences in duration of trips taken by the two modes of travel. The ride hailing company, Uber, previously published trip duration data at the level of Traffic Analysis Zones (TAZ) for a number of global cities through their Uber Movement platform.888https://www.uber.com/en-CA/blog/kepler-data-visualization-traffic-safety/ With access to these data, we can compare micromobility trip durations to those of passenger automobile trips. The Uber Movement data reports mean and median trip duration between all possible TAZ at every hour of either a weekday or weekend. Given the data in MODAP is published at the same spatial and temporal resolution (Administrative TAZ and hourly) for Washington, D.C., we can compare the two modes of travel. Figure 7(a) shows the difference in median trip duration between the two modes of travel for each origin TAZ in the city. This is calculated by subtracting the median automobile duration from the median micromobility duration for each TAZ. The results are the difference reported in seconds. We can see that there is some spatial clustering with the downtown core reporting the lowest difference and those on the outskirts of the city reporting larger differences. This is in line with existing work [16] comparing these data five years prior. Figure 7(b) reports these differences in duration by hour of a standard weekday. In this case, median automobile trip duration between all pairs of TAZ are subtracted from median micromobility trip duration and then the median of all of those is reported for each hour. We can see that while automobile trips are faster in all cases (y-axis is difference in seconds), the two modes of transport become more similar during peak commuting hours. This analysis showcases the types of comparison analysis that can be conducted between micromobility and other modes of transport within cities.
6 Discussion & conclusions
The main objective of this paper is to highlight the importance of open access to high quality mobility data as well as the exploratory tools necessary to analyze them. While this work is narrowly focused on the origins, destinations, and durations of micromobility trips in five major cities, it adds to the growing availability of open data that urban planners, academic researchers, and the public can use to better understand mobility around the world. It is my intention to continue to contribute to this data set and platform as I collect and curate additional e-scooter, e-bicycle, and other sources of micromobility data (e.g., e-moped, non-e-bicycle).
One question that I feel it was important to address is, why I did not choose to publish the raw trip data. It took a significant amount of time and effort to collect these data over the course of multiple years and during that time I realized that there are aspects of the trip data that are incredibly sensitive from an individual privacy perspective. Unlike public transit or docking station-based micromobility, users of dockless micromobility vehicles typically park their vehicles directly outside of their homes or near places of interest that host activities that expose personal information about their clientele. I am also aware of numerous legal cases related to the personal privacy of individual micromobility trip data [12]. In these cases, either precise geographic coordinates of origins and destinations are shared or raw trajectories. As researchers with access to these highly sensitive data, I felt an ethical responsibility not to publish the raw data, but instead preserve a level of privacy through spatial and temporal aggregation [19].
As researchers, I also felt it was important to publish a public data set for the variety of stakeholders who could significantly benefit from access to mobility patterns. When working with data such as these there is always a trade-off between privacy and utility [31]. The size and variety of the geographies chosen, the aggregation to hours of a day were all selected with individual privacy in mind. My approach to aggregating the data is far from perfect, but it does protect privacy while still offering valuable insight from the mobility patterns. My team and I will continue to explore alternative geoprivacy preservation techniques with the objective of releasing higher spatial and temporal resolution data.
There are a number of areas for improvement in both the platform and the data. First, each city is only represented by a single micromobility operator and for most of the cities selected for this project, there are multiple operators. While minimal, existing research has demonstrated that there are differences between operators within the same city [16]. Second, my analysis includes three operators over five cities making it difficult to compare both cities and operators at the same time. Finally, I have no details on the actual riders themselves, nor the purpose for their trips. While this is arguably outside the scope of this specific project, not having access to user demographics or trip purpose limits the forms of analysis that can be done with these data.
My future work on this project will involve expanding the open data set to numerous other cities and micromobility operators. My intention is also to allow users to upload their own data sets to the MODAP platform in order to visually and statistically compare patterns and to help users clean their own mobility data.
Conclusion
Micromobility services have grown substantially in recent years, now constituting a not-insignificant share of short, urban trips. As these services expand, they contribute to the evolving landscape of urban mobility, offering an alternative to, and often complementing, traditional transportation modes. In most cities, there is a regulatory requirement that operators of these services provide open APIs that publish real-time data on vehicle availability. In this work, I leveraged these data to reconstruct trips across five major cities over a three-year period (in most cases). Through the MODAP project, I am making these trip data openly available for download and analysis. To support these data, I developed an interactive geovisualization platform that enables users to engage and explore these data through their web browser. My objective is to provide researchers, policymakers, and urban planners with a rich and open source of new mobility data. My intention is for this to support evidence-based decision-making and contribute to the broader discourse on sustainable and equitable urban mobility.
References
- [1] Mohammed Hamad Almannaa, Huthaifa I Ashqar, Mohammed Elhenawy, Mahmoud Masoud, Andry Rakotonirainy, and Hesham Rakha. A comparative analysis of e-scooter and e-bike usage patterns: Findings from the city of Austin, tx. International Journal of Sustainable Transportation, 15(7):571–579, 2021.
- [2] Alexandra Bretones and Oriol Marquet. Riding to health: Investigating the relationship between micromobility use and objective physical activity in Barcelona adults. Journal of Transport & Health, 29:101588, 2023.
- [3] Vanessa Brum-Bastos and Antonio Páez. Hägerstrand meets big data: time-geography in the age of mobility analytics. Journal of Geographical Systems, 25(3):327–336, 2023. doi:10.1007/S10109-023-00421-0.
- [4] Mollie C D’Agostino, Paige Pellaton, and Austin Brown. Mobility data sharing: challenges and policy recommendations. Technical report, UC Davis: Institute of Transportation Studie, 2019.
- [5] Leonardo Ferreira, Gustavo Moreira, Maryam Hosseini, Marcos Lage, Nivan Ferreira, and Fabio Miranda. Assessing the landscape of toolkits, frameworks, and authoring tools for urban visual analytics systems. Computers & Graphics, 123:104013, 2024. doi:10.1016/J.CAG.2024.104013.
- [6] Song Gao, Jinmeng Rao, Yuhao Kang, Yunlei Liang, and Jake Kruse. Mapping county-level mobility pattern changes in the United States in response to covid-19. SIGSpatial Special, 12(1):16–26, 2020. doi:10.1145/3404111.3404115.
- [7] Xiaodong Guan, Dea van Lierop, Zihao An, Eva Heinen, and Dick Ettema. Shared micro-mobility and transport equity: A case study of three european countries. Cities, 153:105298, 2024.
- [8] Sichen Jin, Alex Endert, and Clio Andris. Snoman: a visual analytic tool for spatial social network mapping and analysis. Cartography and Geographic Information Science, pages 1–19, 2024.
- [9] Jens Kandt and Michael Batty. Smart cities, big data and urban policy: Towards urban analytics for the long run. Cities, 109:102992, 2021.
- [10] Takehiro Kashiyama, Yanbo Pang, Yuya Shibuya, Takahiro Yabe, and Yoshihide Sekimoto. Nationwide synthetic human mobility dataset construction from limited travel surveys and open data. Computer-Aided Civil and Infrastructure Engineering, 2024.
- [11] Zhitao Li, Jinjun Tang, Tao Feng, Biao Liu, Junqiang Cao, Tianjian Yu, and Yifeng Ji. Investigating urban mobility through multi-source public transportation data: A multiplex network perspective. Applied Geography, 169:103337, 2024.
-
[12]
Jennifer Lynch.
EFF, ACLU Urge Appeals Court to Revive
Challenge to Los Angeles’ Collection of Scooter Location
Data, 2021.
URL:
https://www.eff.org/press/releases/
eff-aclu-urge-appeals-court-revive-challenge-los-angeles-collection-scooter-
riders. - [13] Bibiana McHugh. Pioneering open data standards: The gtfs story. Beyond transparency: open data and the future of civic innovation, pages 125–135, 2013.
- [14] Grant McKenzie. grantdmckenzie/modap. Software, swhId: swh:1:dir:a48742b027327af1a11426dcff7ddf77efa10fb9 (visited on 2025-08-04). URL: https://github.com/grantdmckenzie/modap, doi:10.4230/artifacts.24224.
- [15] Grant McKenzie. Spatiotemporal comparative analysis of scooter-share and bike-share usage patterns in washington, dc. Journal of transport geography, 78:19–28, 2019.
- [16] Grant McKenzie. Urban mobility in the sharing economy: A spatiotemporal comparison of shared mobility services. Computers, Environment and Urban Systems, 79:101418, 2020. doi:10.1016/J.COMPENVURBSYS.2019.101418.
- [17] Grant McKenzie. A comparison of electric and non-electric bike sharing in montréal, canada. In Proceedings of the 18th International Conference on Computational Urban Planning and Urban Management, 2023. doi:10.17605/OSF.IO/6YR5V.
- [18] Grant McKenzie, Sarah Battersby, and Vidya Setlur. Mixmap: A user-driven approach to place-based semantic similarity. Cartography and Geographic Information Science, 51(4):583–598, 2024.
- [19] Grant McKenzie, Hongyu Zhang, and Sébastien Gambs. Privacy and ethics in geoai. In Handbook of Geospatial Artificial Intelligence, pages 388–405. CRC Press, 2023.
- [20] Harvey J Miller. Movement analytics for sustainable mobility. Journal of Spatial Information Science, 1(20):115–123, 2020. doi:10.5311/JOSIS.2019.20.663.
- [21] North American Bikeshare and Scootershare Association. 2023 shared micromobility state of the industry report. https://nabsa.net/industry/, 2024. Accessed: 2025-01-31.
- [22] John Pflueger. Driving positive outcomes through open data solutions for mobility | dell. Technical report, Dell, 2018.
- [23] Divya Babu Ravichandran and Varun Verma. How Data Shapes the Uber Rider App. Technical report, Uber, 2021. URL: https://www.uber.com/en-CA/blog/how-data-shapes-the-uber-rider-app/.
- [24] Sergio J Rey and Luc Anselin. Pysal: A python library of spatial analytical methods. In Handbook of applied spatial analysis: Software tools, methods and applications, pages 175–193. Springer, 2009.
- [25] Nicolas Tempelmeier, Yannick Rietz, Iryna Lishchuk, Tina Kruegel, Olaf Mumm, Vanessa Miriam Carlow, Stefan Dietze, and Elena Demidova. Data4urbanmobility: Towards holistic data analytics for mobility applications in urban regions. In Companion Proceedings of The 2019 World Wide Web Conference, pages 137–145, 2019. doi:10.1145/3308560.3317055.
- [26] Henrikki Tenkanen and Tuuli Toivonen. Longitudinal spatial dataset on travel times and distances by different travel modes in helsinki region. Scientific data, 7(1):77, 2020.
- [27] United Nations - Population Division. World urbanization prospects 2018. https://www.un.org/development/desa/pd/news/world-urbanization-prospects-2018, 2018. [Accessed 31-01-2025].
- [28] Priyanka Verma and Grant McKenzie. Regional comparison of socio-demographic variation in urban e-scooter usage. Environment and Planning B: Urban Analytics and City Science, 51(7):1548–1562, 2024.
- [29] Hong Yang, Qingyu Ma, Zhenyu Wang, Qing Cai, Kun Xie, and Di Yang. Safety of micro-mobility: Analysis of e-scooter crashes by mining news reports. Accident Analysis & Prevention, 143:105608, 2020.
- [30] Xiaoqi Yue, Dan Feng, Desheng Sun, Chao Liu, Hongxing Qin, and Haibo Hu. Airpollutionviz: visual analytics for understanding the spatio-temporal evolution of air pollution. Journal of Visualization, 27(2):215–233, 2024. doi:10.1007/S12650-024-00958-2.
- [31] Hongyu Zhang and Grant McKenzie. Rehumanize geoprivacy: From disclosure control to human perception. GeoJournal, 88(1):189–208, 2023.
- [32] Kai Zhao, Sasu Tarkoma, Siyuan Liu, and Huy Vo. Urban human mobility data mining: An overview. In 2016 IEEE International Conference on Big Data (Big Data), pages 1911–1920. IEEE, 2016. doi:10.1109/BIGDATA.2016.7840811.