A Modularity-Driven Framework for Unraveling Congestion Centers with Enhanced Spatial-Semantic Features

Abstract
The propagation of traffic congestion is a complicated spatiotemporal phenomenon in urban networks. Extensive studies mainly relied on dynamic Bayesian network or deep learning approaches. However, they often struggle to adapt seamlessly to diverse data granularities, limiting their applicability. In this study, we propose a modularity-driven method to unravel the spatiotemporal congestion propagation centers, effectively addressing temporal granularity challenges through the use of the fast Fourier Transform (FFT). Our framework distinguishes itself due to its capacity to integrate enhanced spatial-semantic features while eliminating temporal granularity dependence, which consists of two data-driven modules. One is adaptive adjacency matrix learning module, which captures the spatiotemporal relationship from evolving congestion graphs by fusing node degree, spatial proximity, and the FFT of traffic state indices. The other one is local search module, which employs local dominance principles to unravel the congestion propagation centers. We validate our proposed methodology on the large-scale traffic networks in New York City, the United States. An ablation study on the dataset reveals that the combination of the three features achieves the highest modularity scores of 0.65. The contribution of our work is to provide a novel way to infer the propagation centers of traffic congestion, and reveals the flexibility of extending our framework at temporal scales. The network resilience and dynamic evolution of the identified congestion centers can provide implications for actional decisions.
Keywords and phrases:
Congestion center, Temporal granularity, Fast Fourier Transform, Local dominanceCopyright and License:
2012 ACM Subject Classification:
Information systems Geographic information systemsAcknowledgements:
I want to thank my supervisor Wei Huang from Tongji University, China and co-supervisor Xintao Liu from the Hong Kong Polytechnic University, China.Editors:
Katarzyna Sila-Nowicka, Antoni Moore, David O'Sullivan, Benjamin Adams, and Mark GaheganSeries and Publisher:
1 Introduction
Traffic congestion is a pervasive issue in urban road networks, propagating across both time and space. With the exponential growth of multi-source real-time geographic data enriched with temporal and spatial information, significant efforts have been made to uncover the spatiotemporal patterns of traffic congestion propagation. Existing studies can be broadly categorized into two main approaches: dynamic Bayesian network (DBN) [14] and deep learning models [1]. DBN-based approaches discretize continuous historical traffic data into discrete traffic states and then infer congestion propagation patterns by calculating the state transition probability between adjacent road segments [4, 5, 11]. However, these approaches are often limited by the loss of information during data discretization and the reliance on prior knowledge, which may compromise the accuracy of congestion propagation inference. On the other hand, deep learning models, such as graph neural network (GNN) [17] and graph convolutional network (GCN) [6, 21], leverage road network topology to construct feature matrices for congestion analysis. While these methods have shown promise, they predominantly rely on predefined adjacency matrices based on simplistic metrics such as node connectivity or spatial proximity. This static representation fails to capture the dynamic and adaptive nature of congestion propagation, which evolves over time and is influenced by multiple factors beyond mere spatial relationships.
To address these limitations, the objective of this study is to propose a modularity-driven framework to track the evolution of traffic congestion propagation centers with enhanced node feature fusion. Our approach introduces two key innovations that significantly advance the state-of-the-art in congestion center analysis.
-
Adaptive multi-feature fusion adjacency matrix. Unlike traditional methods that rely on static adjacency matrices, we design an adaptive multi-feature adjacency matrix that integrates enhanced node features - including degree, spatial proximity, and the fast Fourier Transform (TTF) of the traffic state index (TSI) – to capture the complex interplay of factors driving congestion propagation. This matrix dynamically updates over time, enabling a more accurate representation of the information-passing process between road segments at different timestamps.
-
Fast Fourier Transform of the TSI to eliminate temporal-scale effects: To address the potential impact of varying temporal resolutions (e.g., 5 minutes, 30 minutes, or 1 hour) on model performance, we introduce the FFT of the TSI. This transformation eliminates the influence of time scales, ensuring that our model remains robust and effective across different data granularities. This innovation is particularly critical for real-world applications where data collection intervals may vary.
The significance of our work lies in its ability to provide a flexible framework for identifying congestion propagation centers, which is independent of temporal granularity thus can be extended at multiple scales. Experimental results on the traffic floating car datasets from New York City (NYC), the United States, demonstrate the effectiveness of our method based on the enhanced features, achieving an average modularity score level at 0.65. Besides, the propagation probability and distribution of the congestion centers on different types of days (i.e., weekdays, weekends, and holidays) are further visualized. These findings highlight the potential of our framework to advance the traffic congestion propagation analysis and provide actionable insights for urban transportation management.
The remainder of this paper is organized as follows. Section 2 reviews the related works and identities some limitations. Section 3 provides the framework and details of our proposed methodology. Section 4 presents the experiment and results. Section 5 concludes this paper.
2 Related works
Significant efforts have been devoted to traffic congestion propagation modeling, with existing approaches primarily falling into two categories: dynamic Bayesian network (DBN) and deep learning. On the one hand, DBN-based methods model traffic congestion propagation as state transitions between adjacent road segments in a probabilistic graph [14]. For instance, Nguyen et al. (2016) [11] constructed causal congestion trees using taxi trajectory data to estimate causality probabilities and reveal the interactions of traffic streams. Building upon this, Chen et al. (2018) [4] proposed the spatiotemporal congestion subgraph (STCS) based on travel time data to describe recurring congestion propagation patterns. Similarly, Fan et al. (2019) [5] developed a DBN-based prediction model using floating car data, discretizing traffic speed to predict congestion diffusion states. However, these DBN-based approaches heavily rely on prior knowledge and data discretizations, which may lead to information loss and reduced inference accuracy.
On the other hand, deep learning models treat congestion propagation as a multi-dimensional feature learning problem. Representative traditional models, such as LSTM [2] and LSTM variants [15, 19], have been widely applied. However, these models often fail to incorporate road network topology, resulting in suboptimal performance. To address this limitation, graph-based approaches, particularly graph convolutional networks (GCNs) (Kipf and Welling, 2016), have gained traction. GCNs model traffic networks as graphs, where road segments are represented as nodes, enabling the direct incorporation of spatial dependencies. For example, Zhao et al. (2019) [20] proposed temporal GCN (T-GCN) to capture both spatial and temporal dependencies, while Liang et al. (2022) [8] introduced spatiotemporal GCN (ST-GCN) to simultaneously model spatiotemporal dependencies and heterogeneity. Zheng et al. (2022) [21] further advanced this field by proposing dynamic STGCN (DST-GCN), which constructs spatial-temporal graphs across time slices by connecting the latest time slice with past slices. Notably, Luan et al. (2022) [9] integrated Bayesian inference with deep learning to develop a dynamic Bayesian graph convolutional network (DBGCN). Despite this, temporal granularities of the data potentially affect model effectiveness. In addition to DBNs and deep learning models, some studies have introduced epidemiological models, such as the susceptible-infectious-recovered (SIR) model, to analyze congestion propagation [16, 12, 7]. While these models provide valuable insights, they often rely on simplifying assumptions and do not fully account for the complex topology of urban road networks. Furthermore, the effectiveness of above methods highly relies on the spatiotemporal resolution of collected data, as it seeks to reveal large-scale traffic dynamics by obscuring small-scale spatiotemporal interactions [18].
3 Proposed methodology
3.1 Framework
The framework of the proposed method contains two-driven modules (Fig. 1): dynamic adjacency matrix learning module and local search module for congestion centers detection. In the first module, adaptive adjacency matrices are constructed by integrating three key features: node degree, spatial proximity, and semantic information derived from traffic spatiotemporal congestion graphs (detailed in Section 3.2). These matrices dynamically capture the relationships between nodes in the traffic network, reflecting both structural and contextual properties of congestion patterns.The generated adjacency matrices are then input into the second module, where a local search algorithm (Section 3.3) is applied to identify congestion centers at multiple scales (e.g., C1, C2, and C3 in Fig. 1). This hierarchical detection process enables the framework to uncover the centers of congestion propagation process across different spatial resolutions, providing a comprehensive understanding of traffic dynamics.
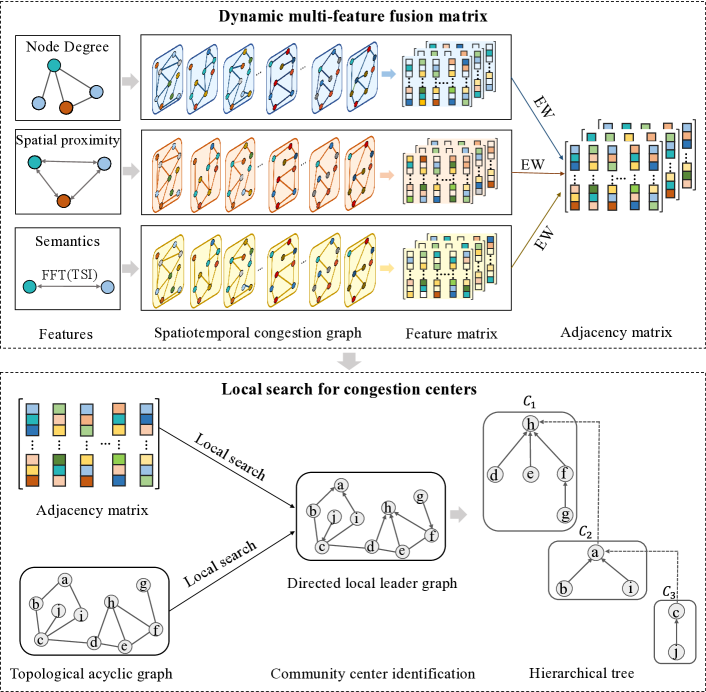
3.2 Dynamic multi-feature fusion adjacency matrix
To enhance the discriminative capability of relative closeness in multi-attribute decision-making, the entropy weight (EW) method is employed, as it effectively balances the contribution of diverse attributes. Leveraging this advantage, the EW approach is utilized in this study to compute adaptive adjacency matrices. Given a spatiotemporal congestion subgraph at timestamp , its adaptive adjacency matrix is derived through a weighted fusion of its degree similarity , Spatial proximity similarity , and the FFT of traffic state similarity :
| (1) |
where , , and denote the EWs calculated by the information entropy of each similarity matrix. The degree similarity is computed based on the Cosine similarity of node degrees. FFT converts TSI in temporal domain into a frequency domain signal, which is calculated as:
| (2) |
| (3) |
where N is the length of time series . is the TSI value at the nth dimension. is the kernel of Fourier Transform, representing the complex exponential signal with frequency . represents the free-flow speed of road segment, is the actual average speed at timestamp . The range of is [0,1], and the threshold is 0.7 [4]. Therefore, the road segment at the timestamp is defined as a spatiotemporal congestion instance if its is no less than 0.7. Given a spatiotemporal congestion graph G, its adjacency matrices across J timestamps are dynamically updated as , ensuring a time-sensitive representation of congestion propagation patterns.
3.3 Local search algorithm
Based upon the adaptive adjacency matrices, a local search algorithm is employed to detect multi-scale communities in dynamic networks. The process of local search in this study is shown as the local search module in Fig. 2, which can be broken into the following four stages: (i) Node value assignment. Each node u is assigned a value by summing the weights of its connected edges, derived from the dynamic adjacency matrix and the spatiotemporal congestion graph. This creates a directed acyclic graph where each node points to its highest-value neighbor, provided that neighbor’s value is greater than or equal to its own. (ii) Local leader identification. Local leaders [3] are identified as nodes with incoming edges but no outgoing edges, representing dominant points in the network’s community structure (e.g., nodes a, c, and h in Fig. 1). These leaders help reveal the network’s hierarchical organization. (iii) Local breath-first search [13]. For each local leader u, an LBFS algorithm is used to find the nearest local leader v with . LBFS is efficient, stopping once the nearest leader is found, and provides the shortest path length between leaders, offering insights into network connectivity. (iv) Multi-scale community detection. multi-scale communities (denoted as the symbol , where i represents different levels or scales) are identified, capturing the network’s structure at varying resolutions.
4 Case studies
4.1 Datasets
The study area is New York City, the United States. The NYC floating car data was downloaded from Uber Movement, covering a time period from December 1, 2018 to December 31, 2018. The time interval is 1 hour. Each record contains recording time, road segment ID, and average speed. The free-flow speed is also acquired from the Uber Movement. It equals to the 15th percentile value of the actual speeds of all floating vehicles on a road segment, with speeds sorted in descending order. Therefore, a 24-dimensional time series feature over one day can be obtained.
4.2 Experiment results
4.2.1 Evaluation metrics
Modularity is a commonly used indicator that measures the quality of community division, which is employed as the evaluation metric in this study. The selection of modularity is appropriate for this study as it is a mature index to effectively quantify community structure without predefined labels - a critical advantage given the lack of verified community partitions in real transportation networks. The modularity, denoted as Q, is defined as the difference between the proportion of intra community edges with the expected number of such edges in a random graph with identical degree sequence[10], formulated as:
| (4) |
where m is the total number of edges in the network. represents the weight of the edge between nodes i and j. and are the sum of the weights of the edges attached to nodes i and j. if i and j belong to the same community (i.e., ). Otherwise, . The range of Q is . Q greater than 0.5 means the results are convincing.
4.2.2 Ablation study
An ablation experiment was conducted to evaluate the impacts of different attribute combinations on model performance, i.e., node degree (D), spatial proximity (S), TSI (T), and the fast Fourier transform of the TSI (F). By utilizing the EW method, seven types of adaptive adjacency matrices were calculated (i.e., DS, DT, DF, ST, SF, DST, and DSF). Fig. 2 displays the modularity based on the seven adaptive adjacency matrices: . Some findings can be concluded: (i) secures the highest value, emphasizing the combination of spatial (i.e., node degree and spatial proximity) and semantic information (i.e., Fast Fourier Transform of the TSI) works best. (ii) proves that the Fast Fourier Transform of the TSI improves the modularity compared to the original TSI. (iii) and suggest that the node degree is more useful than spatial proximity to detecting well-structured communities. This is because node degree captures more inherent structural details in the time series data. (iv) is below 0.3, indicating that relying on spatial information, without incorporating semantic information, struggles to accurately identify communities. Based upon these results, we can rank the significance of the attributes for our model: . The results provide empirical evidence that effective community detection requires both multi-scale structural analysis and sophisticated semantic information, instead of feature inclusion without discrimination.
4.2.3 Propagation pathway
In this section, we analyze how the searched congestion communities algins with human travel patterns throughout the day based on the DSF. To realize this, the communities for each hours are firstly grouped based on the type of days (i.e., weekdays, weekends, and holidays). Then the same communities between continuous time periods (i.e., - ) are counted as the number of community transfers. The transfer values are normalized to a ratio p between 0 and 1, visualized as the lines in in Fig. 3.
The nodes represent community centers, labeled as at timestamp (, ). The size of the node shows its proportion , and the thickness of the connecting lines reflects the transfer strength. Some key findings are concluded: The scale of communities at peak-hours on weekdays are growing from congestion bottleneck during 1:00 to 6:00. However, the size of and does not evolve very drastically compared with , implying that the increased human travel usually results in an increase in small-scale communities, but rarely changes the primary communities. This rule also can be observed on weekends and holidays. Besides, by comparing the size of communities at and , the relative proportions of communities at different levels are similar. This reflects the “self-regulation” of congestion bottlenecks.
Subsequently, we visually show how the detected congestion centers distribute over time at 71 community districts. Fig. 4 shows the occurrence frequency and distribution of congestion centers at peak hours on weekdays, weekends, and holidays, which are captured from dynamic evolving videos of the community centers at specific time periods.
Three significant insights emerge from our findings: First, we observe distinct spatiotemporal asymmetry in congestion patterns. The weekday morning peak (7:00-9:00) and evening peak (16:00-19:00) exhibit contrasting distribution characteristics. Morning congestion demonstrates higher frequency and density concentration in Manhattan, while evening congestion shows a spatial shift towards Brooklyn with greater dispersion. This spatial-temporal variation pattern suggests different commuting behaviors and traffic dynamics between morning and evening rush hours. Second, our analysis reveals temporal stability in congestion center locations, indicating consistent patterns in urban traffic flow distribution across different time periods. This stability has important implications for urban planning and traffic management strategies. Third, the study demonstrates network resilience through the scalability of congestion center identification. The methodology successfully maps road segment-level congestion patterns to community district scales, highlighting its adaptability across different network resolutions. This multi-scale analytical capability provides valuable insights for urban transportation planning and infrastructure development. These findings contribute to the understanding of urban traffic dynamics by quantifying and visualizing the complex spatiotemporal patterns of congestion centers, offering practical implications for traffic management and urban planning strategies.
5 Conclusion
This study proposes a modularity-driven framework that effectively unravels congestion centers by integrating node degree, spatial proximity, and the fast Fourier Transform of the TSI. Our framework is distinguished by its temporal granularity independence and scalability across multiple spatial scales. The incorporation of FFT-enhanced TSI features significantly improves the model’s ability to capture congestion propagation patterns, regardless of the temporal resolution of the input data. This kind of enhanced node feature fusion approach allows to uncover congestion propagation centers regardless of temporal granularity of the datasets. Our approach demonstrated a significant improvement in detecting congestion centers, achieving a modularity score of 0.65 on NYC floating car dataset. The congestion centers identified by our framework offer two advantages over traditional methods: (i) Multi-scale network resilience analysis. Unlike conventional single-scale approaches, our framework leverages road-segment-level data to reveal congestion propagation patterns at broader scales, such as community districts. This multi-scale capability allows for flexible extension to other spatial resolutions, including blocks and boroughs, providing a more comprehensive understanding of urban traffic dynamics. (ii) Dynamic spatiotemporal evolution: Our framework captures the continuous evolution of congestion centers across both time and space, moving beyond static snapshots to provide a more nuanced representation of traffic patterns.
The practical implications of our model and the detected congestion centers are manifold. Firstly, urban planners and authorities can leverage the framework to identify critical congestion hotspots and prioritize infrastructure investments. By understanding the multi-scale resilience of the congestion centers, they can design targeted interventions that reduce bottlenecks. Secondly, The framework’s ability to track the dynamic evolution of congestion propagation centers across time and space supports the development of adaptive, real-time traffic management systems. Moreover, the modularity-driven approach of our framework ensures that the detected congestion centers are accurate and interpretable. The interpretability is crucial for stakeholders who need to make informed decisions based on the model’s outputs.
6 Declaration of Competing Interest
The author(s) hereby declare that they have no potential conflicts of interest with respect to the research, authorship, or publication of this work. The authors affirm their commitment to maintaining the integrity and objectivity of the research process, ensuring that the work adheres to the highest ethical standards in academic and scientific practice.
7 Data availability
The average hourly speed data in New York City was downloaded from the Uber Movement in March, 2023. But Uber Movement no longer open this data to the public now. The community districts were downloaded from NYC Open data. We are glad to share all above data on request.
References
- [1] Kenneth Li-Minn Ang, Jasmine Kah Phooi Seng, Ericmoore Ngharamike, and Gerald K Ijemaru. Emerging technologies for smart cities’ transportation: geo-information, data analytics and machine learning approaches. ISPRS International Journal of Geo-Information, 11(2):85, 2022. doi: 10.3390/ijgi11020085. doi:10.3390/IJGI11020085.
- [2] Sanchita Basak, Abhishek Dubey, and Leao Bruno. Analyzing the cascading effect of traffic congestion using lstm networks. In 2019 IEEE International Conference on Big Data (Big Data), pages 2144–2153. IEEE, 2019. doi:10.1109/BigData47090.2019.9005995.
- [3] Vincent D Blondel, Jean-Loup Guillaume, Julien M Hendrickx, Cristobald de Kerchove, and Renaud Lambiotte. Local leaders in random networks. Physical Review E – Statistical, Nonlinear, and Soft Matter Physics, 77(3):036114, 2008. doi:10.1103/PhysRevE.77.036114.
- [4] Zhenhua Chen, Yongjian Yang, Liping Huang, En Wang, and Dawei Li. Discovering urban traffic congestion propagation patterns with taxi trajectory data. IEEE Access, 6:69481–69491, 2018. doi: 10.1109/ACCESS.2018.2881039. doi:10.1109/ACCESS.2018.2881039.
- [5] Xinyue Fan, Jiao Zhang, and Qi Shen. Prediction of road congestion diffusion based on dynamic bayesian networks. In Journal of Physics: Conference Series, volume 1176(2), page 022046. IOP Publishing, 2019. doi:10.1088/1742-6596/1176/2/022046.
- [6] Thomas N Kipf and Max Welling. Semi-supervised classification with graph convolutional networks. arXiv preprint arXiv:1609.02907, 2016. doi:10.48550/arXiv.1609.02907.
- [7] Assemgul Kozhabek, Wei Koong Chai, and Ge Zheng. Modeling traffic congestion spreading using a topology-based sir epidemic model. IEEE Access, 2024. doi:10.1109/ACCESS.2024.3370474.
- [8] Maohan Liang, Ryan Wen Liu, Yang Zhan, Huanhuan Li, Fenghua Zhu, and Fei-Yue Wang. Fine-grained vessel traffic flow prediction with a spatio-temporal multigraph convolutional network. IEEE Transactions on Intelligent Transportation Systems, 23(12):23694–23707, 2022. doi:10.1109/TITS.2022.3199160.
- [9] Sen Luan, Ruimin Ke, Zhou Huang, and Xiaolei Ma. Traffic congestion propagation inference using dynamic bayesian graph convolution network. Transportation research part C: emerging technologies, 135:103526, 2022. doi:10.1016/j.trc.2021.103526.
- [10] Mark EJ Newman and Michelle Girvan. Finding and evaluating community structure in networks. Physical review E, 69(2):026113, 2004. doi:10.1103/PhysRevE.69.026113.
- [11] Hoang Nguyen, Wei Liu, and Fang Chen. Discovering congestion propagation patterns in spatio-temporal traffic data. IEEE Transactions on Big Data, 3(2):169–180, 2016. doi: 10.1109/TBDATA.2016.2587669. doi:10.1109/TBDATA.2016.2587669.
- [12] Meead Saberi, Homayoun Hamedmoghadam, Mudabber Ashfaq, Seyed Amir Hosseini, Ziyuan Gu, Sajjad Shafiei, Divya J Nair, Vinayak Dixit, Lauren Gardner, S Travis Waller, et al. A simple contagion process describes spreading of traffic jams in urban networks. Nature communications, 11(1):1616, 2020.
- [13] Dingyi Shi, Fan Shang, Bingsheng Chen, Paul Expert, Linyuan Lü, H Eugene Stanley, Renaud Lambiotte, Tim S Evans, and Ruiqi Li. Local dominance unveils clusters in networks. arXiv preprint arXiv:2209.15497, 2022. arXiv:2209.15497, doi:10.1038/s42005-024-01635-4.
- [14] Shiliang Sun, Changshui Zhang, and Guoqiang Yu. A bayesian network approach to traffic flow forecasting. IEEE Transactions on intelligent transportation systems, 7(1):124–132, 2006. doi: 10.1109/TITS.2006.869623. doi:10.1109/TITS.2006.869623.
- [15] Peixiao Wang, Tong Zhang, Yueming Zheng, and Tao Hu. A multi-view bidirectional spatiotemporal graph network for urban traffic flow imputation. International Journal of Geographical Information Science, 36(6):1231–1257, 2022. doi:10.1080/13658816.2022.2032081.
- [16] Jianjun Wu, Ziyou Gao, and Huijun Sun. Simulation of traffic congestion with sir model. Modern Physics Letters B, 18(30):1537–1542, 2004. doi:10.1142/S0217984904008031.
- [17] Zonghan Wu, Shirui Pan, Fengwen Chen, Guodong Long, Chengqi Zhang, and S Yu Philip. A comprehensive survey on graph neural networks. IEEE transactions on neural networks and learning systems, 32(1):4–24, 2020. doi:10.1109/TNNLS.2020.2978386.
- [18] Haoyi Xiong, Xun Zhou, and David A Bennett. Detecting spatiotemporal propagation patterns of traffic congestion from fine-grained vehicle trajectory data. International Journal of Geographical Information Science, 37(5):1157–1179, 2023. doi:10.1080/13658816.2023.2178653.
- [19] Kunpeng Zhang, Ning Jia, Liang Zheng, and Zijian Liu. A novel generative adversarial network for estimation of trip travel time distribution with trajectory data. Transportation Research Part C: Emerging Technologies, 108:223–244, 2019. doi:10.1016/j.trc.2019.09.019.
- [20] Ling Zhao, Yujiao Song, Chao Zhang, Yu Liu, Pu Wang, Tao Lin, Min Deng, and Haifeng Li. T-gcn: A temporal graph convolutional network for traffic prediction. IEEE transactions on intelligent transportation systems, 21(9):3848–3858, 2019. doi:10.1109/TITS.2019.2935152.
- [21] Qi Zheng and Yaying Zhang. Dstagcn: Dynamic spatial-temporal adjacent graph convolutional network for traffic forecasting. IEEE Transactions on Big Data, 9(1):241–253, 2022. doi:10.1109/TBDATA.2022.3156366.