Towards a Better Understanding of Graph Perception in Immersive Environments
 Yao Wang222equal contribution, corresponding author
Ying Zhang
Wilhelm Kerle-Malcharek
Karsten Klein
Falk Schreiber
Andreas Bulling
Yao Wang222equal contribution, corresponding author
Ying Zhang
Wilhelm Kerle-Malcharek
Karsten Klein
Falk Schreiber
Andreas Bulling
Abstract
As Immersive Analytics (IA) increasingly uses Virtual Reality (VR) for stereoscopic 3D (S3D) graph visualisation, it is crucial to understand how users perceive network structures in these immersive environments. However, little is known about how humans read S3D graphs during task solving, and how gaze behaviour indicates task performance. To address this gap, we report a user study with participants asked to perform three analytical tasks on S3D graph visualisations in a VR environment. Our findings reveal systematic relationships between network structural properties and gaze behaviour. Based on these insights, we contribute a comprehensive eye tracking methodology for analysing human perception in immersive environments and establish eye tracking as a valuable tool for objectively evaluating cognitive load in S3D graph visualisation.
Keywords and phrases:
Stereoscopic 3D, Graph Visualisation, Eye Tracking, Graph PerceptionCopyright and License:
![[Uncaptioned image]](x1.png) © Lin Zhang, Yao Wang, Ying Zhang, Wilhelm Kerle-Malcharek, Karsten Klein, Falk Schreiber, and Andreas Bulling; licensed under Creative Commons License CC-BY 4.0
© Lin Zhang, Yao Wang, Ying Zhang, Wilhelm Kerle-Malcharek, Karsten Klein, Falk Schreiber, and Andreas Bulling; licensed under Creative Commons License CC-BY 4.0
2012 ACM Subject Classification:
Human-centered computing Empirical studies in visualization ; Human-centered computing Virtual reality ; Human-centered computing Visual analyticsSupplementary Material:
Dataset: https://doi.org/10.18419/DARUS-5259archived at
 swh:1:rel:fbacfd901cd31509b02fda86ce92972dace66205
Acknowledgements:
This project started at the SFB-TRR 161 Hackathon 2025.Funding:
This work was funded by the Deutsche Forschungsgemeinschaft (DFG, German Research Foundation) – Project-ID 251654672 – TRR 161 (Project A07, A09, and D04).Editors:
Vida Dujmović and Fabrizio MontecchianiSeries and Publisher:
 Leibniz International Proceedings in Informatics, Schloss Dagstuhl – Leibniz-Zentrum für Informatik

1 Introduction
Graph visualisation in stereoscopic 3D (S3D) is gaining significant attention, with an increasing number of research publications focusing on visualisation and interaction methods that enhance graph analysis through immersive environments. Early studies in the 1990s indicated the beneficial effects of head-tracking S3D displays on graph analysis performance [49]. Subsequent research has reaffirmed these findings across various tasks and technologies, including community detection [13] and augmented reality (AR) applications [2]. The advent of affordable, high-quality head-mounted display (HMD) systems and the emergence of Immersive Analytics as a research domain have contributed to a substantial increase in studies addressing not only graphs but also a diverse array of abstract data types [23, 19, 12].
Despite this progress, the extensive design space encompassing technology, graph representation, environmental characteristics, movement, interaction, and navigation has resulted in only a partial understanding of the effects of S3D graph visualisation. Current evidence from studies covers only a limited portion of this design space. The insights gathered thus far suggest that there is no general superiority of S3D over 2D visualisation [13, 53]; rather, performance appears to be highly dependent on various factors, including graph characteristics, representation methods, task types, and interaction support [19, 11, 14, 25, 42]. For some settings also differences between accuracy and response time or even trade-offs have been reported [13, 25]. Consequently, it is crucial to investigate how graph reading and task-solving strategies differ between S3D and 2D and why these differences exist. While these questions are complex and cannot be fully addressed in a single project, this study aims to advance our understanding by examining task-related graph perception in S3D. To explore potential issues, misperceptions, or advantages associated with S3D, we employ eye-tracking technology to analyse graph reading behaviour.
Although recent studies have begun to investigate perception in 2D graph visualisations (e.g. [32, 41, 26, 48]), research on S3D graph perception remains limited compared to traditional 2D setups. Experimental evidence regarding analysis performance presents a mixed picture for 2D versus S3D, with some tasks and scenarios favouring 2D and others demonstrating advantages for S3D [13, 25, 42, 11]. Investigating the perception and gaze behaviour of analysts in S3D can help identify potential challenges and obstacles associated with 3D visualisations, thereby contributing to the development of improved quality measures and layout methods specifically tailored for S3D.
A key component of this investigation is the collection and analysis of eye-tracking data. In addition to achieving the aforementioned goals, eye tracking can provide insights into reading behaviour and help identify or validate task-solving strategies and comprehension models, which are often derived from self-reports [3, 27]. An important consideration for S3D is the applicability of existing quality criteria and the potential need for new criteria. While numerous quality metrics exist for 2D graph layouts, they do not necessarily translate directly to 3D due to factors such as perspective dependency, particularly concerning edge crossings. Although eye tracking has been underutilised in graph visualisations, it has proven effective in investigating readability factors to enhance quality measures, such as edge crossing angles [15], and in comparing layout effects [40, 39]. However, eye tracking for S3D visualisations presents unique challenges, including depth perception issues, occlusion, and perspective changes. Consequently, there is significantly less research employing eye tracking in S3D graph visualisation compared to 2D.
In this study, we make a significant contribution by exploring the use of eye tracking in one of the first investigations of its kind, aiming to gain insights into gaze behaviour during task-solving. This represents an initial step toward identifying and differentiating behaviour categories among individuals, as well as confirming or refuting hypotheses regarding task-solving strategies, readability obstacles, and quality metrics.
2 Related Work
Our work investigates the use of eye tracking to analyse human perception and task solving for graph visualisation in S3D. We give an overview of previous works where we focus on the specific aspects of perception and graph visualisation, in particular for VR and AR. Stereoscopic 3D graph visualisations have been investigated over several decades now, with rather sparse coverage before the advent of affordable mainstream VR hardware and a strong increase shortly after. Due to the rich literature on general aspects of 3D graph visualisation and for applications, we refer to corresponding surveys [19, 23, 12]. For a general overview on eye tracking in 3D environments, see the survey on gaze interaction and eye tracking in XR HMDs [38] and the review on eye tracking visualisation in 3D [45].
Human Graph Perception
Previous studies examined how graph layout impacts readability and perception. Huang et al. [15, 16] found that eye movement smoothness and readability depend on edge-crossing angles. Sharif and Maletic [40] showed clustered UML layouts improve class search performance. Force-directed layouts were found most readable in node/path tasks [39], while tapered edges aided trajectory perception [35]. Kypridemou et al. [26] and Soni et al. [41] examined the perception of graph characteristics such as density in dependence of the graph layout used, with mixed results on the significance of the layout impact. Mooney et al. [33] designed a perceptual study to train novices to tell “stress” in graph drawing. Zhao et al. [56] investigated degree centrality perception and identified several impact factors. The human-centred experiments on node–link diagrams and visual complexity were surveyed in [54]. With eye tracking technology, Chen et al. explored reading strategies for graphs laid out on a flattened Torus topology and successfully distinguished different strategies based on gaze data [6]. Moreover, Steichen et al. [43] and Wang et al. [47] used gaze data to predict visualisation tasks and user cognitive abilities. Okoe et al. implemented gaze interaction techniques to facilitate graph reading tasks [36].
In the field of immersive analytics, Whitlock et al. [52] emphasised the importance of tailoring visualisations to human cognitive processes in VR. Yang et al. [53] showed that visual cues such as motion, shading, and perspective significantly influence accuracy in HMD-based scatterplot tasks. Sun et al. [44] provided a comprehensive review of visual perception models for immersive displays, advocating for designs aligned with perceptual characteristics. Tory et al. [46] used eye tracking to compare 2D and 3D view arrangements, finding higher engagement with 3D, especially when centrally positioned.
Overall, prior work shows that graph layout and eye tracking are both key to understanding visual perception. In immersive environments, additional cues such as depth, motion, and spatial arrangement further shape how graphs are read. Eye tracking in VR thus offers a unique opportunity to capture human attention shifts, helping us to understand the exploration strategy during graph reading.
Graph Visualisation in Virtual and Augmented Reality
Marques et al. [29] demonstrated that augmented reality offers superior spatial perception and immersion for unit visualisation. Graph visualisation in immersive environments has been an active research field, and comprehensively surveyed [19, 23, 12]. Most publications have targeted specific aspects of the design for graph visualisation, such as the encoding [5], the perspective and viewpoint selection [42], spatial arrangement [11], or the interaction, in particular for navigation [10]. Further investigations were related to specific application use-cases, such as brain activity analysis [24, 8, 17]. Prior works have explored how immersive visualisation techniques impact user performance. Joos et al. [18] tried to quantify the perceptual quality of 3D viewing perspectives by a set of standard quality measures and used the results for user-guidance by mapping on a sphere for viewpoint selection. Kwon et al. [25] found that egocentric rendering and interaction in VR improved response times. Sorger et al. [42] further demonstrated benefits from egocentric perspectives with adaptive local scene layouts. Greffard et al. [13] found that S3D projections aided community detection in complex graphs, though 2D yielded faster responses. S3D also enables richer spatial organisation of multiple structures. Feyer et al. [11] compared 2D, 2.5D, and 3D multi-layer graph layouts in VR, highlighting perceptual trade-offs. Visual encoding remains underexplored in immersive graph environments; Büschel et al. found straight edges preferable, as curved edges impaired performance [4]. Ware and Franck, and Ware and Mitchell [49, 50, 51] have concluded that the combination of stereo and kinetic cues can improve graph reading abilities up to an order of magnitude compared to 2D settings. Belcher et al. [2] compared 2D viewing with AR visualisations using a tangible interface. They observed smaller error rates but higher answering times in AR and confirmed Ware and Franck’s conclusions that adding stereo cues alone provides less advantage than kinetic depth cues.
While prior work has explored interaction methods, perceptual cues, and spatial arrangements for immersive graph visualisation, it focused on isolated design aspects or coarse performance metrics such as task accuracy and completion time. Only a few have examined how perceptual mechanisms unfold over time or how users dynamically engage with 3D graph structures during task-solving. Furthermore, limited attention has been given to the methodological challenges of analysing depth-rich, mesh-based environments in stereoscopic VR. Our work complements this literature by introducing a detailed ray-casting-based eye tracking approach that captures fine-grained gaze behaviour, offering a deeper understanding of how task demands and graph topology shape attention in immersive graph visualisations.
3 Study Design
3.1 Graph Selection
For this initial study, our main aim is not to investigate the effects of scale by covering a large range of graph characteristics. Still, we wanted to avoid observing peculiarities based on the structure of only a single graph instance. Thus, three undirected simple graph instances were included in our study: two real-world instances and one generated graph. The size range between and nodes was chosen such that the graphs are neither trivial nor extremely challenging due to visual and cognitive overload [55], e.g. for overview and navigation tasks. The aim is to ensure graph visibility and interpretability and mitigate potential occlusion between nodes at varying depths. In addition, it allows us to investigate the applicability of our methodology without confounding results by effects from extreme cases, e.g. large or extremely dense graphs, which deserve an investigation of their own.
The real-world instances were selected from the Konect collection: the Iceland333http://konect.cc/networks/iceland/ (Graphic), a graph of social contacts in Iceland with 75 nodes and 114 edges, and Edit-bmwikiquote444http://konect.cc/networks/edit-bmwikiquote/ (Graphed), a bipartite edit graph from the Bambara Wikiquote containing users and pages connected by edit events. As the original edit-bmwikiquote graph was unconnected with 84 nodes, we extracted the largest connected component, resulting in 56 nodes and 65 edges for our analysis. The three-dimensional coordinates of nodes in these selected graphs were generated using force-directed simulation algorithms implemented in D3-force555https://d3js.org/d3-force. Additionally, we synthesised a third graph (Graphsy) with 50 nodes and 100 edges utilising the Watts-Strogatz model generator in the OGDF library [7]. The graphs differ significantly in several core characterisation measures (mean degree, diameter, mean clustering coefficient, mean shortest path): Graphic (3.04, 6, 0.286, 5.2), Graphed (2.32, 11, 0(bipartite), 3.19), Graphsy (4.0, 6, 0.07, 2.86). We subsequently normalised the spatial coordinates of all nodes to position each graph within a 1 cubic volume in the virtual reality environment. The edge lengths remain relatively consistent across the three graphs. The edge lengths for the three graphs are as follows: Graphsy ( = 0.21, = 0.05), Graphed ( = 0.22, = 0.08), and Graphic ( = 0.20, = 0.06). Student’s T-test comparisons revealed no significant differences in edge lengths across graphs (p > 0.05 for all pairwise comparisons).
3.2 Task Selection
Our study tasks contain three commonly performed graph perceptual tasks [31]:
-
Task shortest path (TSP): How long is the shortest path between the two highlighted nodes (in number of edges)? Two randomly selected nodes are highlighted with a red sphere. The participants must search for the shortest path. All participants see the same highlighted nodes for each graph. The length was controlled between 3 and 5 for a good task complexity. The answer panel shows buttons for all possible answers (0 to 9).
-
Task highest node degree (THD): Which node has the highest number of edges to other nodes? We ensure there is a unique node in every graph with the highest degree. For our study, the highest node degree ranged from 7 to 24. The participants must search for the node with the highest degree, and then enter the chosen node label on the answer panel.
-
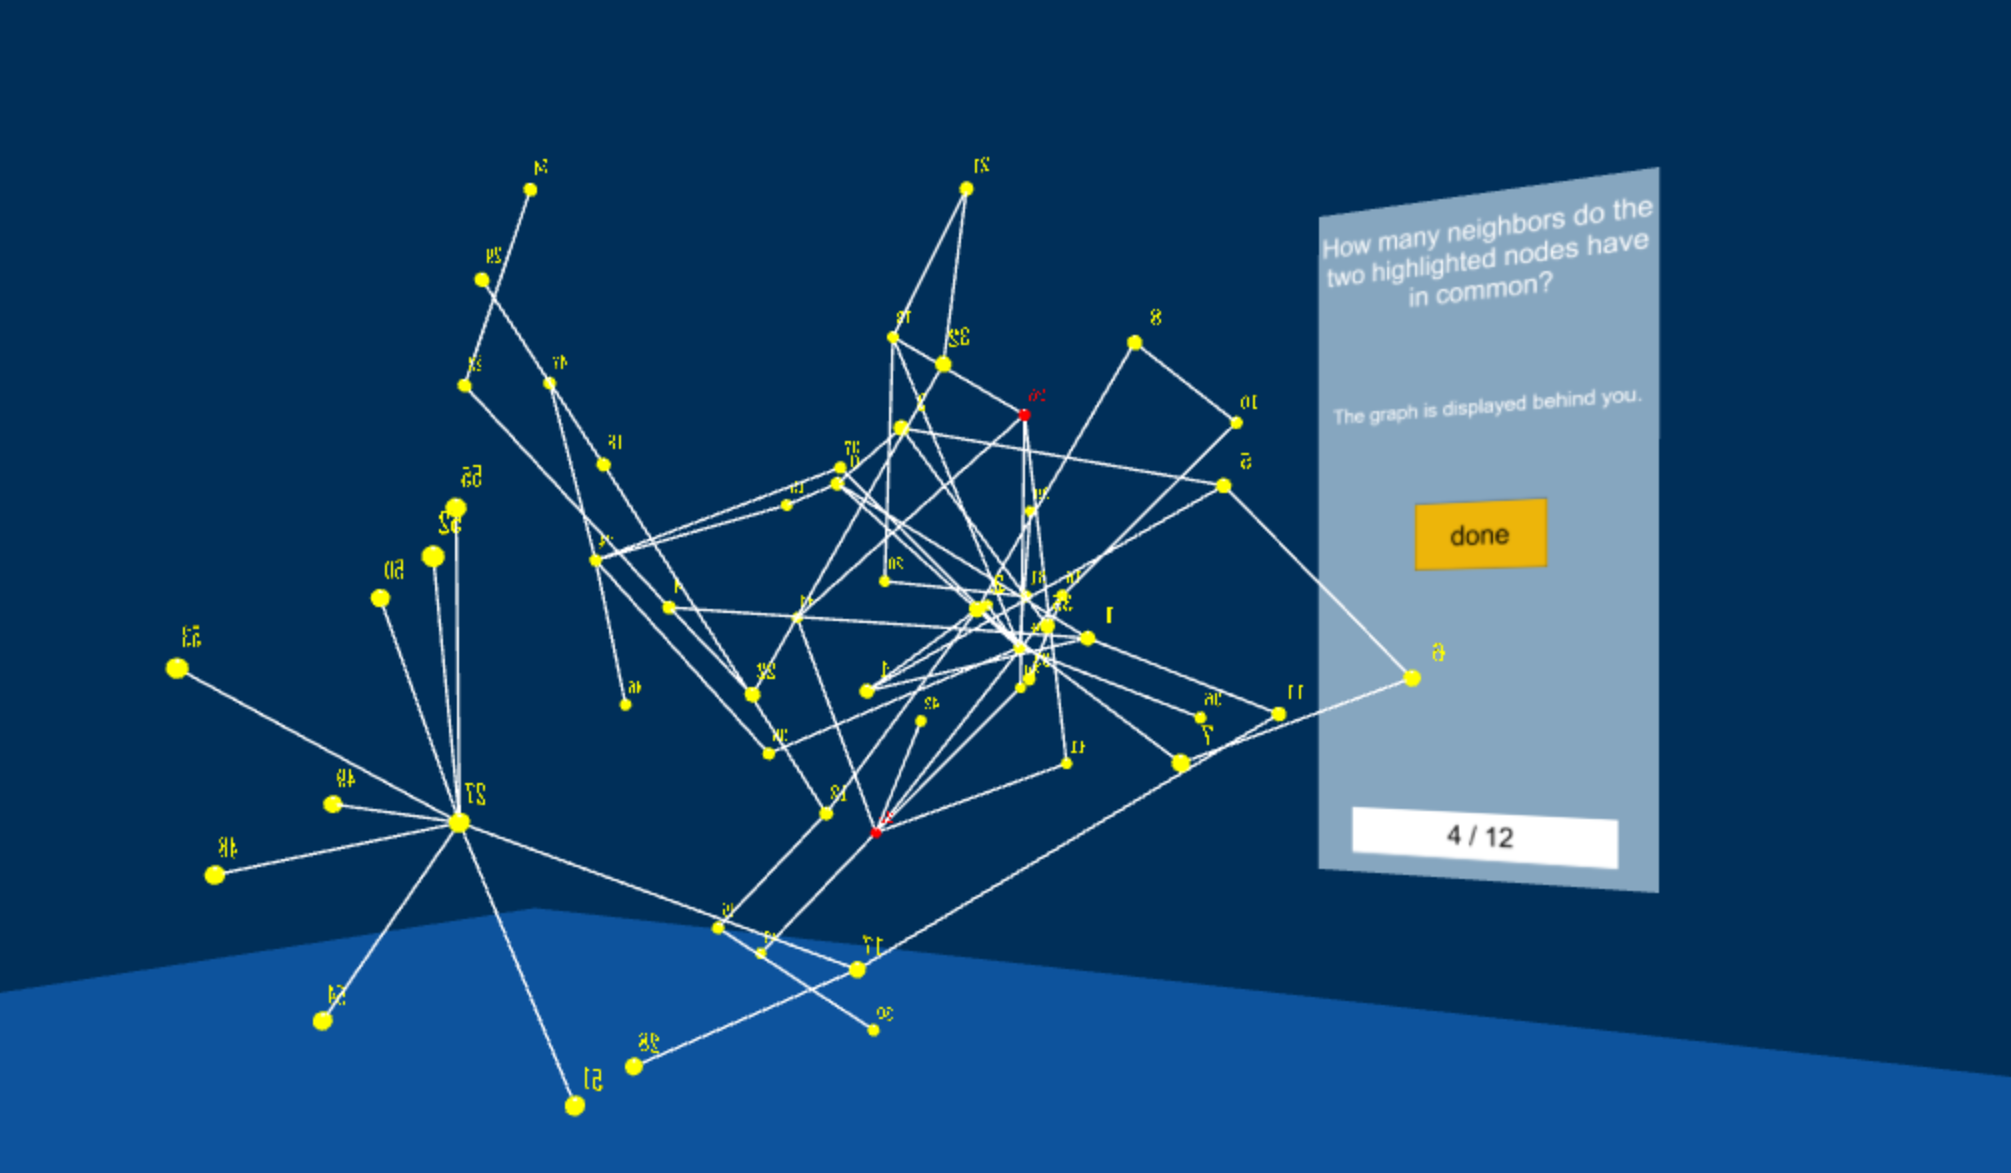
Task common neighbour (TCN): How many common neighbours do the two highlighted nodes share? All participants see the same highlighted nodes for each graph. For our study, the number of common neighbours ranged from 3 to 5. The participants should count the number of neighbours and select the answer from the panel (0 to 9).
3.3 Experiment Design and Setup
3.3.1 VR Environment
The VR environment was implemented with the WebXR Device API666https://immersiveweb.dev/ and Babylon.js777https://www.babylonjs.com/ serving as the rendering framework. Participants accessed the study environment through the immersive mode of HMD’s native web browser. The experimental procedures were conducted using a Meta Quest 3 HMD integrated with the NeonXR eye tracking system [1] from Pupil Labs. The refreshing rate was higher than 50 Hz during the entire study for a smooth experience. The study environment closely replicated the setup of prior work [11, 21], ensuring consistent visual encoding and interaction design (see Figure 1). All nodes were labelled with ascending numerical identifiers starting from 0. Task-relevant nodes were rendered in red (#FF0000), while task-irrelevant nodes appeared in yellow (#FFFF00) with a diameter of 0.01. All edges were rendered in white by the Line System function in Babylon.js.
Participants conducted the study within a VR environment that simulated a 55 metre room with dark blue walls. A virtual question-and-answer panel was positioned on one wall as the sole interaction interface. Graphs were rendered in the centre of the room at a height ranging from 0.5 to 1.5 metres, allowing participants to explore them freely from multiple perspectives. Participants interacted with the panel using the Meta Quest 3 controller through a raycasting-based technique. Before beginning the experiment, all participants received standardised training on this interaction method, ensuring consistent familiarity with the VR controls across sessions.
3.3.2 Experiment Protocol
Participants began the study by clicking a start button, after which a calibration phase was initiated following a 2-second delay. During calibration, participants were instructed to follow five white crosses presented sequentially on a blue background. Each cross was displayed for 1 second at the following locations on screen: centre, upper left, lower left, upper right, and lower right. A 1-second interval separated the disappearance of one cross and the appearance of the next. Following calibration, a graph-related question was shown on a question-answering panel. Participants had unlimited time to read the question. Upon clicking to begin the task, a graph visualisation appeared at the centre of the virtual room. Participants could freely inspect the graph and, once confident in their solution, return to the panel to click “Done”, triggering a response screen. After submitting an answer, a confirmation screen allowed participants to revise their response if necessary. The next task appeared upon confirmation, and participants were not allowed to revisit previous tasks.
The study began with three tutorial tasks, each using a simple graph representing one of the three task types. The experimenter explained each task type and instructed participants to think aloud while solving them. Participants could proceed only if all tutorial tasks were solved correctly. The remaining nine tasks were the actual study. Task types and graph stimuli were counterbalanced and rotated across participants to ensure that no two consecutive tasks were of the same type or used the same graph.
3.4 Hypothesis
Our study aims to understand the key factors influencing users’ gaze behaviour in stereoscopic 3D and how this behaviour reflects answer correctness. As visual attention behaviour is influenced by both bottom-up (graph) and top-down (task) factors, we hypothesise the effects:
-
H1: Graph significantly influences users’ gaze behaviour during graph perception in stereoscopic 3D.
-
H2: Task type significantly influences users’ gaze behaviour during graph perception in stereoscopic 3D.
-
H3: Users’ gaze behaviour is significantly correlated with answer correctness during graph perception in stereoscopic 3D.
We break the hypotheses down under these gaze metrics: a) saccade velocity, b) saccade length, and c) the ratio of fixation count landing on task-related elements. As such, every hypothesis consists of three sub-hypotheses, such as H1.b, which states that the graph significantly affects saccade length during graph perception in stereoscopic 3D.
4 Result
The ethics committee at the local university approved the user study. We conducted our user study at the local university. We recruited 18 participants (11 male, 7 female) between 21 and 28 years old ( = 25.2, = 2 years). All participants had no visual impairment but limited experience with VR. All 18 participants were counterbalanced across the three graphs and three tasks, resulting in nine perceptual tasks for each participant. Participants were compensated with 10€. The headset setup and eye tracker calibration lasted about five minutes, and the tutorial tasks took each participant about three minutes.
4.1 Data Processing
The image plane of the scene camera measured 1,6001,200 pixels, covering a 103∘77∘ field of view [1]. We logged the VR headset’s position and rotation with timestamps and event markers (e.g., task start/done) to segment the collected gaze data. The eye tracker recorded gaze direction as azimuth and elevation at 200 Hz. Fixations were identified using an enhanced Identify by Velocity Threshold (I-VT) algorithm for head-mounted eye tracking [9].
We synchronised timestamps between the VR system and the eye tracker using data from the initial calibration phase (see Section 3.3.2). The five-point fixation pattern was extracted from the eye tracking data and aligned with system log timestamps marking when each calibration cross was rendered. The average time difference across all five points was used to compute a temporal offset between the two systems.
To analyse participants’ perceptual engagement with the graph visualisation, we reconstructed the full virtual environment using the Python Trimesh library888https://trimesh.org/. Nodes and edges in the graph were rendered at 5 times their actual size used in the user study environment for ray-mesh intersections. Ray casting was then employed to identify graph elements intersected by participants’ gaze. Gaze rays were computed by combining eye tracking data with the VR headset’s position and orientation. Each ray originated from the headset’s position, with its direction derived from the headset’s rotation and the eye tracker’s azimuth and elevation. The headset’s quaternion rotation is converted into a rotation matrix by:
| (1) |
The eye tracker provided fixation data in terms of azimuth () and elevation () angles, which were converted from degrees to radians. To compute the gaze direction vector, we defined the initial forward direction in the local VR headset space as . Rotation matrices for the elevation (pitch) and azimuth (yaw) angles were then constructed:
| (2) |
| (3) |
The local gaze direction was then calculated by applying these rotations to the forward vector . Finally, this local direction was transformed into world coordinates using the VR headset’s rotation matrix and normalised to obtain the central ray direction .
A single gaze ray is often insufficient for reliable object intersection due to eye tracking inaccuracies and the spatial extent of foveal vision [28, 34]. Prior work has shown that cone-based approaches with visual angles between 3–10∘ enhance robustness to head movement and positioning variability, while maintaining accurate detection in 3D environments [20].
Following these guidelines, we expanded the central gaze ray into a conical projection with an angle of . To generate the cone, we constructed an orthonormal basis around the central gaze direction by identifying two perpendicular unit vectors and , such that formed an orthonormal frame. Eight surrounding ray directions were then computed as , where , , and . All directions were normalised to unit length. Ray casting was performed using this nine-ray cone (the central ray plus eight surrounding rays) within the reconstructed 3D graph environment. All intersected graph elements and their respective distances from the ray origin were recorded.
4.2 Taxonomy of Task-related Graph Elements
Graph elements (meshes) were systematically categorised into eight categories: question panel, highlighted nodes, task nodes, task edges, confusion nodes, confusion edges, other nodes, and other edges.
Highlighted nodes are the nodes colour-coded in red, which are two nodes in the shortest path (TSP) and identify common neighbours task (TCN), but the highest degree task (THD) contains no highlighted nodes.
Task-relevant elements vary according to the specific task conditions:
-
TSP: The nodes and edges compose the shortest path(s) between the two highlighted nodes. When multiple shortest paths exist, all constituent elements are included.
-
THD: The nodes include the node with the highest degree, and the edges include all edges connecting to these highest-degree nodes.
-
TCN: The nodes represent the common neighbours shared by both highlighted nodes, and the edges include all connections between these common neighbours and the highlighted nodes.
Confusion elements represent potentially misleading graph components that could interfere with task completion:
-
TSP: Confusion nodes and edges comprise all nodes and edges belonging to the second shortest path(s) between the highlighted nodes. When multiple second-shortest paths exist, all constituent elements are included.
-
THD: Confusion nodes include all nodes with the second-highest degree, while confusion edges encompass their connections. When multiple nodes share the second-highest degree, all such nodes and their edges are classified as confusion elements.
-
TCN: Confusion nodes encompass all neighbours of either highlighted node (including both common and non-common neighbours), with confusion edges representing all connections between these neighbours and the highlighted nodes.
Other elements include all remaining nodes and edges that do not fall into the above categories. When a graph element could be assigned to multiple categories, we applied the following hierarchical priority: highlighted nodes > task nodes/edges > confusion nodes/edges > other elements.
4.3 Result
4.3.1 Task Performance Overview
The average task completion time is 53.85 seconds ( = 33.28 s), where Graphsy, Graphic, and Graphed are 57.44 ( = 34.00 s), 69.20 ( = 36.35 s), and 34.93 ( = 16.41 s) seconds, respectively. For tasks TSP, THD, and TCN, participants spent 50.55 ( = 31.29 s), 57.45 ( = 33.38 s), and 53.56 ( = 35.30 s) seconds, respectively. Participants have an average answer correctness of 78.40%, while TSP, THD, and TCN have a correctness of 79.63%, 88.89%, and 66.67%, respectively. The correctness of the three graphs is 83.33%, 62.96%, 88.89%, respectively. See Figure 2 for the average task correctness and duration across task types and graphs.
4.3.2 Gaze Behaviour
As shown in Figure 3, participants have a mean saccade velocity of 27.28 ∘/seconds ( = 5.00∘), and a mean saccade length of 7.89∘ ( = 1.45∘). For saccade velocity, a two-way ANOVA revealed that graph has a significant influence, (graph) = 9.201, < 0.001. However, the impact of task types was insignificant, (task) = 1.601, = 0.205, interaction effect (graph:task) = 1.613, = 0.174. The hypothesis H1.a is confirmed, but H2.a is rejected. For saccade length, a two-way ANOVA revealed that graph has a significant influence, (graph) = 4.553, = 0.012. However, the impact of task types was insignificant, (task) = 1.210, = 0.301, interaction effect (graph:task) = 1.611, = 0.174. The hypothesis H1.b is confirmed, but H2.b is rejected.
Participants have a mean fixation count of 145.65 ( = 84.95), where 149.11 ( = 94.11) for TSP, 139.61 ( = 75.26) for THD, and 148.24 ( = 85.71) for TCN. Separating by graph, the means were 154.19 ( = 82.83) for Graphsy, 181.98 ( = 96.65) for Graphic, and 100.80 ( = 47.45) for Graphed. Considering that Graphic has a significantly larger number of fixation counts than Graphsy and Graphed, we used the task-related fixation ratio for the following tests. For task-related fixation ratio, a two-way ANOVA revealed that both graph and task have a significant influence, (graph) = 22.758, < 0.001, (task) = 36.233, < 0.001, interaction effect (graph:task) = 7.063, < 0.001. A post-hoc Tukey Test confirmed the pairwise significant differences between TSP and TCN in Graphsy and Graphic, and between TSP and THD, TSP and THD in Graphed (see Figure 3). This confirmed hypotheses H1.c and H2.c.
For TSP, the correlation between answer correctness with saccade velocity, saccade length, and fixation task ratio are all insignificant, Spearman’s Rank Correlation = 0.0310, = 0.824, = 0.0634, = 0.649, and, = -0.010, = 0.941, respectively. Answer correctness is significantly correlated with saccade velocity, saccade length, and fixation task ratio under , Spearman’s Rank Correlation = 0.4008, = 0.003, = 0.3856, = 0.004, = -0.3529, = 0.009, respectively. For THD, the correlation between answer correctness with saccade velocity, and fixation task ratio are insignificant, Spearman’s Rank Correlation = 0.2363, = 0.085, = 0.1853, = 0.180, respectively, but significantly correlated to saccade length, = 0.2741, = 0.045. This leads to the confirmation of H3.a, H3.b, and H3.c under , but rejection in TSP and THD. Moreover, under TCN, answer correctness correlates significantly negatively with task duration, Spearman’s Rank Correlation = -0.4915, < 0.001. This suggests that some participants spent a huge effort in counting common neighbours, but still answered incorrectly.
4.3.3 Viewing Strategy
We adapted two effective visualisation techniques to have both temporal and spatial representation of how users observe graphs under task solving, providing qualitative insights into the users’ strategies under immersive graph navigation.
Temporal Dynamics
Implementation.
To capture the temporal dynamics of participants’ gaze behaviour, we implemented a timeline visualisation in the form of uncertainty-aware scarf plots [37]. In this visualisation, each vertical bar represents a single fixation event, with bar width encoding the fixation duration. Within each bar, coloured segments indicate the graph elements (nodes and edges) intersected by the participant’s gaze ray during that fixation. For each intersected mesh within a fixation, we calculated a weight based on the distance between the mesh and the participant’s viewpoint:
| (4) |
The proportion of vertical space allocated to each mesh block within the fixation bar was then determined by normalising these weights by , where represents the height proportion of block relative to the total bar height. Meshes closer to the observer (smaller ) receive proportionally larger block heights and are positioned lower within the bar. The colour coding corresponds to our eight-category classification described in Section 4.1.
Finding.
The scarf plot (see Figure 4) revealed several noteworthy patterns. First, the appearance of task-related meshes usually appeared later than highlighted nodes and confusion meshes. Second, the number of intersected meshes generally decreased over time: the peak of mesh hit count usually appeared early during viewing (first 15 seconds), then gradually reduced to four or fewer meshes when attending to task-relevant meshes. Third, task-related meshes were usually first located farther away from viewers (top), then came closer to the foreground. This suggests that participants would adjust their viewpoints to reduce visual clutter and minimise the spatial distance to relevant mesh elements, thereby improving task-relevant visibility.
Spatial Distribution
Implementation.
To understand the distribution of task-based visual attention, we first overlaid visual saliency values on graph meshes. For each fixation that intersected mesh elements, we incremented the hit count of each intersected mesh by . The resulting hit counts were mapped to a colour scale through linear interpolation. Given a mesh with hit count , minimum hit count , and maximum hit count , we first computed the normalized value:
| (5) |
We then applied gamma correction with the gamma value of 0.7 to emphasise differences in the lower range, and the scaling factor of 1.2:
| (6) |
The RGB colour was then calculated using linear interpolation between white and dark blue , and then clipped to the range :
| (7) |
Finding.
We aggregated fixation data from all participants within each task-graph combination, computing hit frequencies for individual mesh elements throughout the graph (see Figure 5). The resulting saliency distribution revealed that visual attention allocation emerged from an interplay between task demands and graph structure. Participants adapted their visual strategies to task requirements while being guided by the graph’s topological features, creating distinct yet structured attention patterns. The concentration of fixations on areas with many connections and relationships – such as densely connected nodes, nodes linking different parts of the graph, and tightly interconnected groups – indicates that viewers leveraged the graph’s inherent organisation to efficiently locate task-relevant information, rather than employing exhaustive search strategies. This dual influence of task constraints and graph topology demonstrates that human visual processing of graphs involves a dynamic optimisation between goal-directed search and structure-guided exploration.
5 Discussion
5.1 Graphs, Tasks, and Gaze Behaviour
Eye tracking offers an objective framework for assessing perceptual and cognitive engagement during graph viewing. Our findings support the hypothesis regarding graph influence (H1), while revealing more nuanced effects related to task type and answer correctness (H2, H3).
Saccadic measures strongly support graph-related hypotheses. Different graphs significantly influenced both saccade velocity (H1.a) and saccade length (H1.b), whereas task type and correctness had no significant effects (rejecting H2.a, H2.b, H3.a, and H3.b). The data reveal a systematic inverse relationship between graph density and saccadic behaviour. Graph density varied across graphs: Graphsy (4.0 degree), Graphic (3.12 degree), and Graphed (2.32 degree). Correspondingly, saccadic parameters showed systematic progression: lengths of 7.53∘, 7.80∘, and 8.34∘, and velocities of 25.94∘/s, 26.39∘/s, and 29.52∘/s, respectively. This monotonic pattern demonstrates that increasing graph density leads to more constrained visual scanning in localised regions, whilst sparser structures promote broader exploration. These distinct saccadic strategies likely reflect underlying cognitive demands, highlighting the utility of eye movement metrics as physiological indicators of visual processing in graph analysis.
Task-related fixation ratio analyses further support all three hypotheses regarding attention allocation (H1.c, H2.c, H3.c). Different graphs had multiplicative effects on attention demands: Graphic, with the highest structural complexity (75 nodes, 114 edges), elicited the greatest task-relevant fixation ratio (46.64%). Graphsy (50 nodes, 100 edges) and Graphed (56 nodes, 65 edges) required substantially less attention to task-relevant elements (34.11% and 32.13%, respectively). Task type also shaped attentional demands: the common neighbours task (TCN) imposed the greatest cognitive load, with 66.67% task correctness [30], compared to 79.63% for the shortest path (TSP) and 88.89% for the highest node degree (THD) tasks. Finally, attention allocation correlated with correctness: the most complex graph (Graphic) and the most demanding task (TCN) yielded the lowest task correctness (33.33%).
5.2 Spatio-temporal Attention Patterns in Graph Perception
Eye tracking captures rich spatio-temporal data, enabling sophisticated visualisation of visual attention patterns. The temporal precision and spatial accuracy of gaze data support advanced analytical techniques, including scarf plots that reveal the temporal evolution of participants’ focus and the sequential ordering of graph element inspection, and saliency distribution that characterise the distribution of human visual attention across graph structures.
Our visualisation analysis reveals distinct task-specific attention strategies that reflect underlying cognitive processes. In the shortest path task, participants exhibited distributed fixation patterns across intermediate vertices, consistent with systematic route exploration. Saliency analysis (Figure 5) showed moderate activation levels among candidate nodes, while scarf plots (Figure 4) revealed frequent transitions between task-relevant and irrelevant vertices. These patterns suggest a breadth-first visual search strategy, where participants actively compared multiple paths before selecting an optimal route. In contrast, the highest node degree task prompted more focused visual behaviour. Visual salience was concentrated on structurally prominent nodes – appearing as dark blue clusters in the saliency distribution – while scarf plots showed fewer transitions between relevant and irrelevant areas. This indicates a targeted search strategy, with participants quickly identifying high-degree vertices with minimal exploration. The common neighbours task exhibited a distinctly localised attention pattern. Participants primarily fixated on the neighbourhoods of the highlighted nodes, as shown by tightly clustered saliency regions and infrequent transitions in scarf plots. This behaviour reflects a local comparison strategy, where participants systematically inspected nearby nodes to infer shared connections, rather than scanning the broader graph.
Despite these task-specific strategies, some consistent visual attention patterns emerged. In particular, the hub nodes attracted attention across all tasks, implying that participants consistently prioritised structurally significant elements during their analysis.
5.3 Limitations and Future Work
Challenges of Perception Analysis in Graph Visualisation
Analysing visual attention patterns in 3D graph visualisations presents substantial methodological constraints. The primary limitation arises from depth ambiguity, where multiple mesh elements at varying depths align along identical sight vectors. Our conical ray casting detects all intersected meshes, creating uncertainty regarding actual fixation targets. This ambiguity intensifies in dense regions where individual fixations often intersect over ten elements, most likely outside the participant’s attentional focus. Although restricting detection to the nearest mesh offers a straightforward solution, this risks misclassification when participants attend to background elements.
A secondary limitation emerges from long-distance edges spanning extensive 3D regions. Current protocols classify entire edges as fixation targets upon any segment intersection, generating spurious detections and artificially inflating attention frequencies. Spatial partitioning into discrete subregions offers a potential solution by recording intersections at regional rather than mesh levels, though this approach requires accurate gaze depth computation [22] to determine the specific attended subregion.
Real-time Gaze-based Applications
Our study was constrained by technical limitations related to the integration of eye tracking and VR system. Specifically, fixation data were computed offline from raw gaze recordings, and no real-time communication occurred between the eye tracker and the HMD. This restricted our ability to support gaze-contingent interactions, such as highlighting graph elements under direct visual attention or dynamically adapting the graph layout based on live eye tracking metrics. These types of interactions have been shown to enhance usability and user engagement in immersive analytics systems. Future work could address this limitation by implementing a web socket to enable real-time data transmission between the eye tracker and the VR application.
Additionally, the asynchronous nature of the two systems necessitated a post hoc timestamp alignment process, based on a five-point validation. While generally effective, this method may introduce minor misalignments – typically on the order of a few milliseconds – due to human reaction time variability. Although such discrepancies are unlikely to affect high-level attention analyses, they may pose challenges for fine-grained temporal studies or real-time applications. Addressing this synchronisation issue remains an important technical challenge for future system designs in immersive eye tracking research.
6 Conclusion
This work contributes a comprehensive eye tracking study for understanding human perception of graph visualisations in immersive VR environments through visual analytics. With the spatial-temporal gaze pattern analysis, our 18-participant user study reveals systematic relationships between graph analytical tasks and corresponding gaze behaviours, demonstrating that eye tracking metrics can serve as objective measures of cognitive load and visual complexity in exploring 3D graph visualisation. These results provide foundational insights for designing more effective immersive visualisation systems and suggest promising directions for adaptive interfaces that respond to user cognitive states. Future work should explore the generalisability of these gaze-based indicators across more graphs and tasks, as well as investigate real-time applications of these metrics for enhanced user experience in immersive analytics.
References
- [1] Chris Baumann and Kai Dierkes. Neon accuracy test report. Pupil Labs, 10, 2023.
- [2] D. Belcher, M. Billinghurst, S.E. Hayes, and R. Stiles. Using augmented reality for visualizing complex graphs in three dimensions. In The Second IEEE and ACM International Symposium on Mixed and Augmented Reality, 2003. Proceedings., pages 84–93. IEEE, 2003. doi:10.1109/ISMAR.2003.1240691.
- [3] T. Blascheck, K. Kurzhals, M. Raschke, M. Burch, D. Weiskopf, and T. Ertl. State-of-the-Art of Visualization for Eye Tracking Data . In R. Borgo, R. Maciejewski, and I. Viola, editors, EuroVis - STARs. The Eurographics Association, 2014. doi:10.2312/eurovisstar.20141173.
- [4] Wolfgang Büschel, Jian Chen, Raimund Dachselt, Steven Drucker, Tim Dwyer, Carsten Görg, Tobias Isenberg, Andreas Kerren, Chris North, and Wolfgang Stuerzlinger. Interaction for immersive analytics. Immersive analytics, pages 95–138, 2018. doi:10.1007/978-3-030-01388-2_4.
- [5] Wolfgang Büschel, Stefan Vogt, and Raimund Dachselt. Augmented reality graph visualizations. IEEE Computer Graphics and Applications, 39(3):29–40, 2019. doi:10.1109/MCG.2019.2897927.
- [6] Kun-Ting Chen, Quynh Quang Ngo, Kuno Kurzhals, Kim Marriott, Tim Dwyer, Michael Sedlmair, and Daniel Weiskopf. Reading strategies for graph visualizations that wrap around in torus topology. In Proceedings of the 2023 Symposium on Eye Tracking Research and Applications, ETRA ’23, pages 1–7, New York, NY, USA, 2023. Association for Computing Machinery. doi:10.1145/3588015.3589841.
- [7] Markus Chimani, Carsten Gutwenger, Michael Jünger, Gunnar W. Klau, Karsten Klein, and Petra Mutzel. The open graph drawing framework (ogdf). Handbook of graph drawing and visualization, 2011:543–569, 2013.
- [8] Giorgio Conte, Allen Q. Ye, Angus G. Forbes, Olusola Ajilore, and Alex Leow. Braintrinsic: A virtual reality-compatible tool for exploring intrinsic topologies of the human brain connectome. In Brain Informatics and Health, pages 67–76, Cham, 2015. Springer International Publishing. doi:10.1007/978-3-319-23344-4_7.
- [9] Michael Drews and Kai Dierkes. Strategies for enhancing automatic fixation detection in head-mounted eye tracking. Behavior Research Methods, 56(6):6276–6298, 2024. doi:10.3758/s13428-024-02360-0.
- [10] Adam Drogemuller, Andrew Cunningham, James Walsh, Bruce H Thomas, Maxime Cordeil, and William Ross. Examining virtual reality navigation techniques for 3d network visualisations. Journal of Computer Languages, 56:100937, 2020. doi:10.1016/j.cola.2019.100937.
- [11] Stefan P Feyer, Bruno Pinaud, Stephen Kobourov, Nicolas Brich, Michael Krone, Andreas Kerren, Michael Behrisch, Falk Schreiber, and Karsten Klein. 2d, 2.5 d, or 3d? an exploratory study on multilayer network visualisations in virtual reality. IEEE Transactions on Visualization and Computer Graphics, 30(1):469–479, 2023. doi:10.1109/TVCG.2023.3327402.
- [12] Adrien Fonnet and Yannick Prié. Survey of immersive analytics. IEEE Transactions on Visualization and Computer Graphics, 27(3):2101–2122, 2021. doi:10.1109/TVCG.2019.2929033.
- [13] Nicolas Greffard, Fabien Picarougne, and Pascale Kuntz. Visual community detection: An evaluation of 2d, 3d perspective and 3d stereoscopic displays. In Graph Drawing, pages 215–225, Berlin, Heidelberg, 2012. Springer. doi:10.1007/978-3-642-25878-7_21.
- [14] Nicolas Greffard, Fabien Picarougne, and Pascale Kuntz. Beyond the classical monoscopic 3D in graph analytics: An experimental study of the impact of stereoscopy. In 2014 IEEE VIS International Workshop on 3DVis (3DVis), pages 19–24, 2014. doi:10.1109/3DVis.2014.7160095.
- [15] Weidong Huang. Using eye tracking to investigate graph layout effects. In 2007 6th International Asia-Pacific Symposium on Visualization, pages 97–100. IEEE, 2007. doi:10.1109/APVIS.2007.329282.
- [16] Weidong Huang. Establishing aesthetics based on human graph reading behavior: two eye tracking studies. Personal and ubiquitous computing, 17:93–105, 2013. doi:10.1007/s00779-011-0473-2.
- [17] Sabrina Jaeger, Karsten Klein, Lucas Joos, Johannes Zagermann, Michael De Ridder, Jinman Kim, Jean Yang, Ulrike Pfeil, Harald Reiterer, and Falk Schreiber. Challenges for brain data analysis in VR environments. In 2019 IEEE Pacific Visualization Symposium (PacificVis), pages 42–46. IEEE, 2019. doi:10.1109/PacificVis.2019.00013.
- [18] Lucas Joos, Maximilian T. Fischer, Daniel A. Keim, and Johannes Fuchs. Aesthetic-driven navigation for node-link diagrams in vr. In Proceedings of the 2023 ACM Symposium on Spatial User Interaction, SUI ’23, New York, NY, USA, 2023. Association for Computing Machinery. doi:10.1145/3607822.3614537.
- [19] Lucas Joos, Maximilian T Fischer, Julius Rauscher, Daniel A Keim, Tim Dwyer, Falk Schreiber, and Karsten Klein. Visual network analysis in immersive environments: A survey. arXiv preprint arXiv:2501.08500, 2025. doi:10.48550/arXiv.2501.08500.
- [20] Anuradha Kar and Peter Corcoran. Performance evaluation strategies for eye gaze estimation systems with quantitative metrics and visualizations. Sensors, 18(9), 2018. doi:10.3390/s18093151.
- [21] Wilhelm Kerle-Malcharek, Stefan Paul Feyer, Falk Schreiber, and Karsten Klein. GAV-VR: An Extensible Framework for Graph Analysis and Visualisation in Virtual Reality. In Jean-Marie Normand, Maki Sugimoto, and Veronica Sundstedt, editors, ICAT-EGVE 2023 - International Conference on Artificial Reality and Telexistence and Eurographics Symposium on Virtual Environments. The Eurographics Association, 2023. doi:10.2312/egve.20231321.
- [22] Maurice Koch, Nelusa Pathmanathan, Daniel Weiskopf, and Kuno Kurzhals. How deep is your gaze? leveraging distance in image-based gaze analysis. In Proceedings of the 2024 Symposium on Eye Tracking Research and Applications, pages 1–7, 2024. doi:10.1145/3649902.3653349.
- [23] Matthias Kraus, Johannes Fuchs, Björn Sommer, Karsten Klein, Ulrich Engelke, Daniel Keim, and Falk Schreiber. Immersive analytics with abstract 3d visualizations: A survey. In Computer Graphics Forum, volume 41, pages 201–229. Wiley Online Library, 2022. doi:10.1111/cgf.14430.
- [24] Marcel Krüger, Qin Li, Torsten W. Kuhlen, and Tim Gerrits. A case study on providing immersive visualization for neuronal network data using cots soft- and hardware. In 2023 IEEE Conference on Virtual Reality and 3D User Interfaces Abstracts and Workshops (VRW), pages 201–205, 2023. doi:10.1109/VRW58643.2023.00050.
- [25] Oh-Hyun Kwon, Chris Muelder, Kyungwon Lee, and Kwan-Liu Ma. A study of layout, rendering, and interaction methods for immersive graph visualization. IEEE Transactions on Visualization and Computer Graphics, 22(7):1802–1815, 2016. doi:10.1109/TVCG.2016.2520921.
- [26] Elektra Kypridemou, Michele Zito, and Marco Bertamini. The effect of graph layout on the perception of graph properties. EuroVis (Short Papers), pages 1–5, 2020. doi:10.2312/evs.20201039.
- [27] Christof Körner. Sequential processing in comprehension of hierarchical graphs. Applied Cognitive Psychology, 18(4):467–480, 2004. doi:10.1002/acp.997.
- [28] Ruian Liu, Shijiu Jin, and Xiaorong Wu. Single camera remote eye gaze tracking under natural head movements. In Advances in Artificial Reality and Tele-Existence, pages 614–623, Berlin, Heidelberg, 2006. Springer. doi:10.1007/11941354_6.
- [29] Ana Beatriz Marques, Vasco Branco, Rui Costa, and Nina Costa. Immersive unit visualization with augmented reality. Multimodal Technologies and Interaction, 7(10):98, 2023. doi:10.3390/mti7100098.
- [30] AP Martinez-Cedillo, Nicoleta Gavrila, Aastha Mishra, Elena Geangu, and Tom Foulsham. Cognitive load affects gaze dynamics during real-world tasks. Experimental Brain Research, 243(4):82, 2025.
- [31] Fintan McGee, Benjamin Renoust, Daniel Archambault, Mohammad Ghoniem, Andreas Kerren, Bruno Pinaud, Margit Pohl, Benoît Otjacques, Guy Melançon, and Tatiana Von Landesberger. Visual analysis of multilayer networks, volume 8. Springer, 2021.
- [32] Jacob Miller, Mohammad Ghoniem, Hsiang-Yun Wu, and Helen C Purchase. On the perception of small sub-graphs. In International Symposium on Graph Drawing and Network Visualization, pages 213–230. Springer, Springer, 2023. doi:10.1007/978-3-031-49272-3.
- [33] Gavin J. Mooney, Helen C. Purchase, Michael Wybrow, Stephen G. Kobourov, and Jacob Miller. The Perception of Stress in Graph Drawings. In Stefan Felsner and Karsten Klein, editors, 32nd International Symposium on Graph Drawing and Network Visualization (GD 2024), volume 320 of Leibniz International Proceedings in Informatics (LIPIcs), pages 21:1–21:17, 2024. doi:10.4230/LIPIcs.GD.2024.21.
- [34] Fabricio Batista Narcizo, Fernando Eustáquio Dantas dos Santos, and Dan Witzner Hansen. High-accuracy gaze estimation for interpolation-based eye-tracking methods. Vision, 5(3), 2021. doi:10.3390/vision5030041.
- [35] Rudolf Netzel, Michel Burch, and Daniel Weiskopf. Comparative eye tracking study on node-link visualizations of trajectories. IEEE Transactions on Visualization and Computer Graphics, 20(12):2221–2230, 2014. doi:10.1109/TVCG.2014.2346420.
- [36] Mershack Okoe, Sayeed Safayet Alam, and Radu Jianu. A gaze-enabled graph visualization to improve graph reading tasks. Computer Graphics Forum, 33(3):251–260, 2014. doi:10.1111/cgf.12381.
- [37] Nelusa Pathmanathan, Seyda Öney, Maurice Koch, Daniel Weiskopf, and Kuno Kurzhals. Uncertainty-aware scarf plots. In Proceedings of the 2025 Symposium on Eye Tracking Research and Applications, pages 1–8. Association for Computing Machinery, 2025. doi:10.1145/3715669.3725872.
- [38] Alexander Plopski, Teresa Hirzle, Nahal Norouzi, Long Qian, Gerd Bruder, and Tobias Langlotz. The eye in extended reality: A survey on gaze interaction and eye tracking in head-worn extended reality. ACM Comput. Surv., 55(3), March 2022. doi:10.1145/3491207.
- [39] Mathias Pohl, Markus Schmitt, and Stephan Diehl. Comparing the Readability of Graph Layouts using Eyetracking and Task-oriented Analysis . In Oliver Deussen and Peter Hall, editors, Computational Aesthetics in Graphics, Visualization, and Imaging. The Eurographics Association, 2009. doi:10.2312/COMPAESTH/COMPAESTH09/049-056.
- [40] Bonita Sharif and Jonathan I. Maletic. An eye tracking study on the effects of layout in understanding the role of design patterns. In 2010 IEEE International Conference on Software Maintenance, pages 1–10, 2010. doi:10.1109/ICSM.2010.5609582.
- [41] Utkarsh Soni, Yafeng Lu, Brett Hansen, Helen C. Purchase, Stephen G. Kobourov, and Ross Maciejewski. The perception of graph properties in graph layouts. Comput. Graph. Forum, 37(3):169–181, 2018. doi:10.1111/CGF.13410.
- [42] J. Sorger, A. Arleo, P. Kán, W. Knecht, and M. Waldner. Egocentric network exploration for immersive analytics. Computer Graphics Forum, 40(7):241–252, 2021. doi:10.1111/cgf.14417.
- [43] Ben Steichen, Giuseppe Carenini, and Cristina Conati. User-adaptive information visualization: using eye gaze data to infer visualization tasks and user cognitive abilities. In Proceedings of the 2013 International Conference on Intelligent user interfaces, pages 317–328. Association for Computing Machinery, 2013. doi:10.1145/2449396.2449439.
- [44] Qi Sun, Budmonde Duinkharjav, and Anjul Patney. Modeling and optimizing human-in-the-loop visual perception using immersive displays: A review. In SID symposium digest of technical papers, volume 53, pages 190–193. Wiley Online Library, 2022. doi:10.1002/sdtp.15450.
- [45] Veronica Sundstedt and Valeria Garro. A systematic review of visualization techniques and analysis tools for eye-tracking in 3d environments. Frontiers in Neuroergonomics, 3, 2022. doi:10.3389/fnrgo.2022.910019.
- [46] M. Tory, M.S. Atkins, A.E. Kirkpatrick, M. Nicolaou, and G.-Z. Yang. Eyegaze analysis of displays with combined 2D and 3D views. In VIS 05. IEEE Visualization, 2005., pages 519–526, 2005. doi:10.1109/VISUAL.2005.1532837.
- [47] Yao Wang, Yue Jiang, Zhiming Hu, Constantin Ruhdorfer, Mihai Bâce, and Andreas Bulling. VisRecall++: Analysing and predicting visualisation recallability from gaze behaviour. Proceedings of the ACM on Human-Computer Interaction, 8(ETRA):1–18, 2024. doi:10.1145/3655613.
- [48] Yao Wang, Weitian Wang, Abdullah Abdelhafez, Mayar Elfares, Zhiming Hu, Mihai Bâce, and Andreas Bulling. SalChartQA: Question-driven saliency on information visualisations. In Proceedings of the CHI Conference on Human Factors in Computing Systems, pages 1–14. Association for Computing Machinery, 2024. doi:10.1145/3613904.3642942.
- [49] Colin Ware and Glenn Franck. Evaluating stereo and motion cues for visualizing information nets in three dimensions. ACM Trans. Graph., 15(2):121–140, April 1996. doi:10.1145/234972.234975.
- [50] Colin Ware and Peter Mitchell. Reevaluating stereo and motion cues for visualizing graphs in three dimensions. In Proceedings of the 2nd Symposium on Applied Perception in Graphics and Visualization, APGV ’05, pages 51–58, New York, NY, USA, August 2005. Association for Computing Machinery. doi:10.1145/1080402.1080411.
- [51] Colin Ware and Peter Mitchell. Visualizing graphs in three dimensions. ACM Transactions on Applied Perception, 5(1):1–15, January 2008. doi:10.1145/1279640.1279642.
- [52] Matt Whitlock, Stephen Smart, and Danielle Albers Szafir. Graphical perception for immersive analytics. In 2020 IEEE Conference on Virtual Reality and 3D User Interfaces (VR), pages 616–625, 2020. doi:10.1109/VR46266.2020.00084.
- [53] Fumeng Yang, James Tompkin, Lane Harrison, and David H Laidlaw. Visual cue effects on a classification accuracy estimation task in immersive scatterplots. IEEE Transactions on Visualization and Computer Graphics, 29(12):4858–4873, 2022. doi:10.1109/TVCG.2022.3192364.
- [54] Vahan Yoghourdjian, Daniel Archambault, Stephan Diehl, Tim Dwyer, Karsten Klein, Helen C. Purchase, and Hsiang-Yun Wu. Exploring the limits of complexity: A survey of empirical studies on graph visualisation. Visual Informatics, 2(4):264–282, 2018. doi:10.1016/j.visinf.2018.12.006.
- [55] Vahan Yoghourdjian, Yalong Yang, Tim Dwyer, Lee Lawrence, Michael Wybrow, and Kim Marriott. Scalability of network visualisation from a cognitive load perspective. IEEE Transactions on Visualization and Computer Graphics, 27(2):1677–1687, 2020. doi:10.1109/TVCG.2020.3030459.
- [56] Xin Zhao, Shuowen Fu, Rui Yang, Lei Yang, Yunpeng Chen, Jiang Zhang, Jiang Long, Fangfang Zhou, and Ying Zhao. Investigating visual perception of degree centrality in graph visualization. IEEE Transactions on Visualization and Computer Graphics, pages 1–11, 2025. doi:10.1109/TVCG.2025.3567129.