TReView: Visualizing the European Union Transparency Register

Abstract
We present TReView, the first visual analytics system for the exploration of the European Union (EU) Transparency Register, a large repository that aims to enhance transparency around lobbying activities within the EU, by enabling public oversight of meetings between lobbyists and EU officials.
Keywords and phrases:
Transparency Registry, European Union, Graph Visualization, Interactive Visualization, Visual AnalyticsCategory:
Poster AbstractFunding:
Cristiano Bernardini: MUR PRIN 2022JSLZW, Assessing Conflict of Interests.Copyright and License:
2012 ACM Subject Classification:
Mathematics of computing Graph algorithms ; Mathematics of computing Graph theory ; Theory of computation Graph algorithms analysisSupplementary Material:
Software (Source Code): https://github.com/CriBerna1703/Transparency-Register-Application.gitAcknowledgements:
We are grateful to Francesco Annunziata for his help in collecting useful data.Editors:
Vida Dujmović and Fabrizio MontecchianiSeries and Publisher:
1 Motivation and Contribution
The Transparency Register (TR) [9] is a public database established by the European Union (EU) in 2011 and continuously updated since then. It collects information about lobbyists – organizations, companies, and institutions – that seek to influence EU decision-making on specific topics or strategic areas of interest [2, 4, 5, 6]. However, despite the TR aims to enhance transparency by enabling public oversight of meetings between lobbyists and EU officials, the TR’s official website and related systems [3, 8] lack support for advanced data analysis. To address this limitation, we developed TReView, an interactive visual analytics system that employs multiple coordinated views to query and explore TR data from diverse perspectives TReView integrates a temporal view, a multilayer similarity graph view, and a flexible filtering subsystem, allowing users to focus on specific subsets of lobbyists, EU directorates, or topics of interest. The design of TReView has been driven by experts in the legal domain; its effectiveness is demonstrated through selected case studies.
2 System Design and Functionalities
The logical components, data, users, tasks, behind the design of TReView are the following [7].
-
Data. We collected most of the information in the TReView database by a scraping procedure that massively queries the online web site of the TR111https://transparency-register.europa.eu/searchregister-or-update/search-register_en. We adopted this approach for two main reasons: we could not find public APIs for accessing the TR; the open data made available by the EU222https://data.europa.eu/data/datasets/transparency-register?locale=en (as XML or Excel files) only contains partial information, not updated with the same frequency as the data in the web site.
-
Users. TReView is designed for two main user categories: academic researchers or practitioners, mainly in the fields of legal studies, political science, and sociology, interested in a better understanding of the dynamics of the lobbying activities behind the decision-making process of the EU; public officials, civil servants, journalists, or civil society activists, interested in investigating specific organizations, persons, or topics, and in discovering potential conflicts of interest in the lobbying activities.
-
Tasks. Following consultations with domain experts in legal studies and sociology, we identified a core set of three macro-tasks that TReView is designed to strongly support: T1 - Data Slicing and Filtering, to focus on specific time windows, lobbyists, organizations, Commission officials or directorates, and meeting topics. T2 - Temporal Analysis, to explore in detail the meetings between lobbyists and Commission officials along the temporal axis. T3 - Similarity Analysis, to recognize clusters of lobbyists that coordinate or behave similarly in terms of meeting topics or fields of interest.
User Interface.
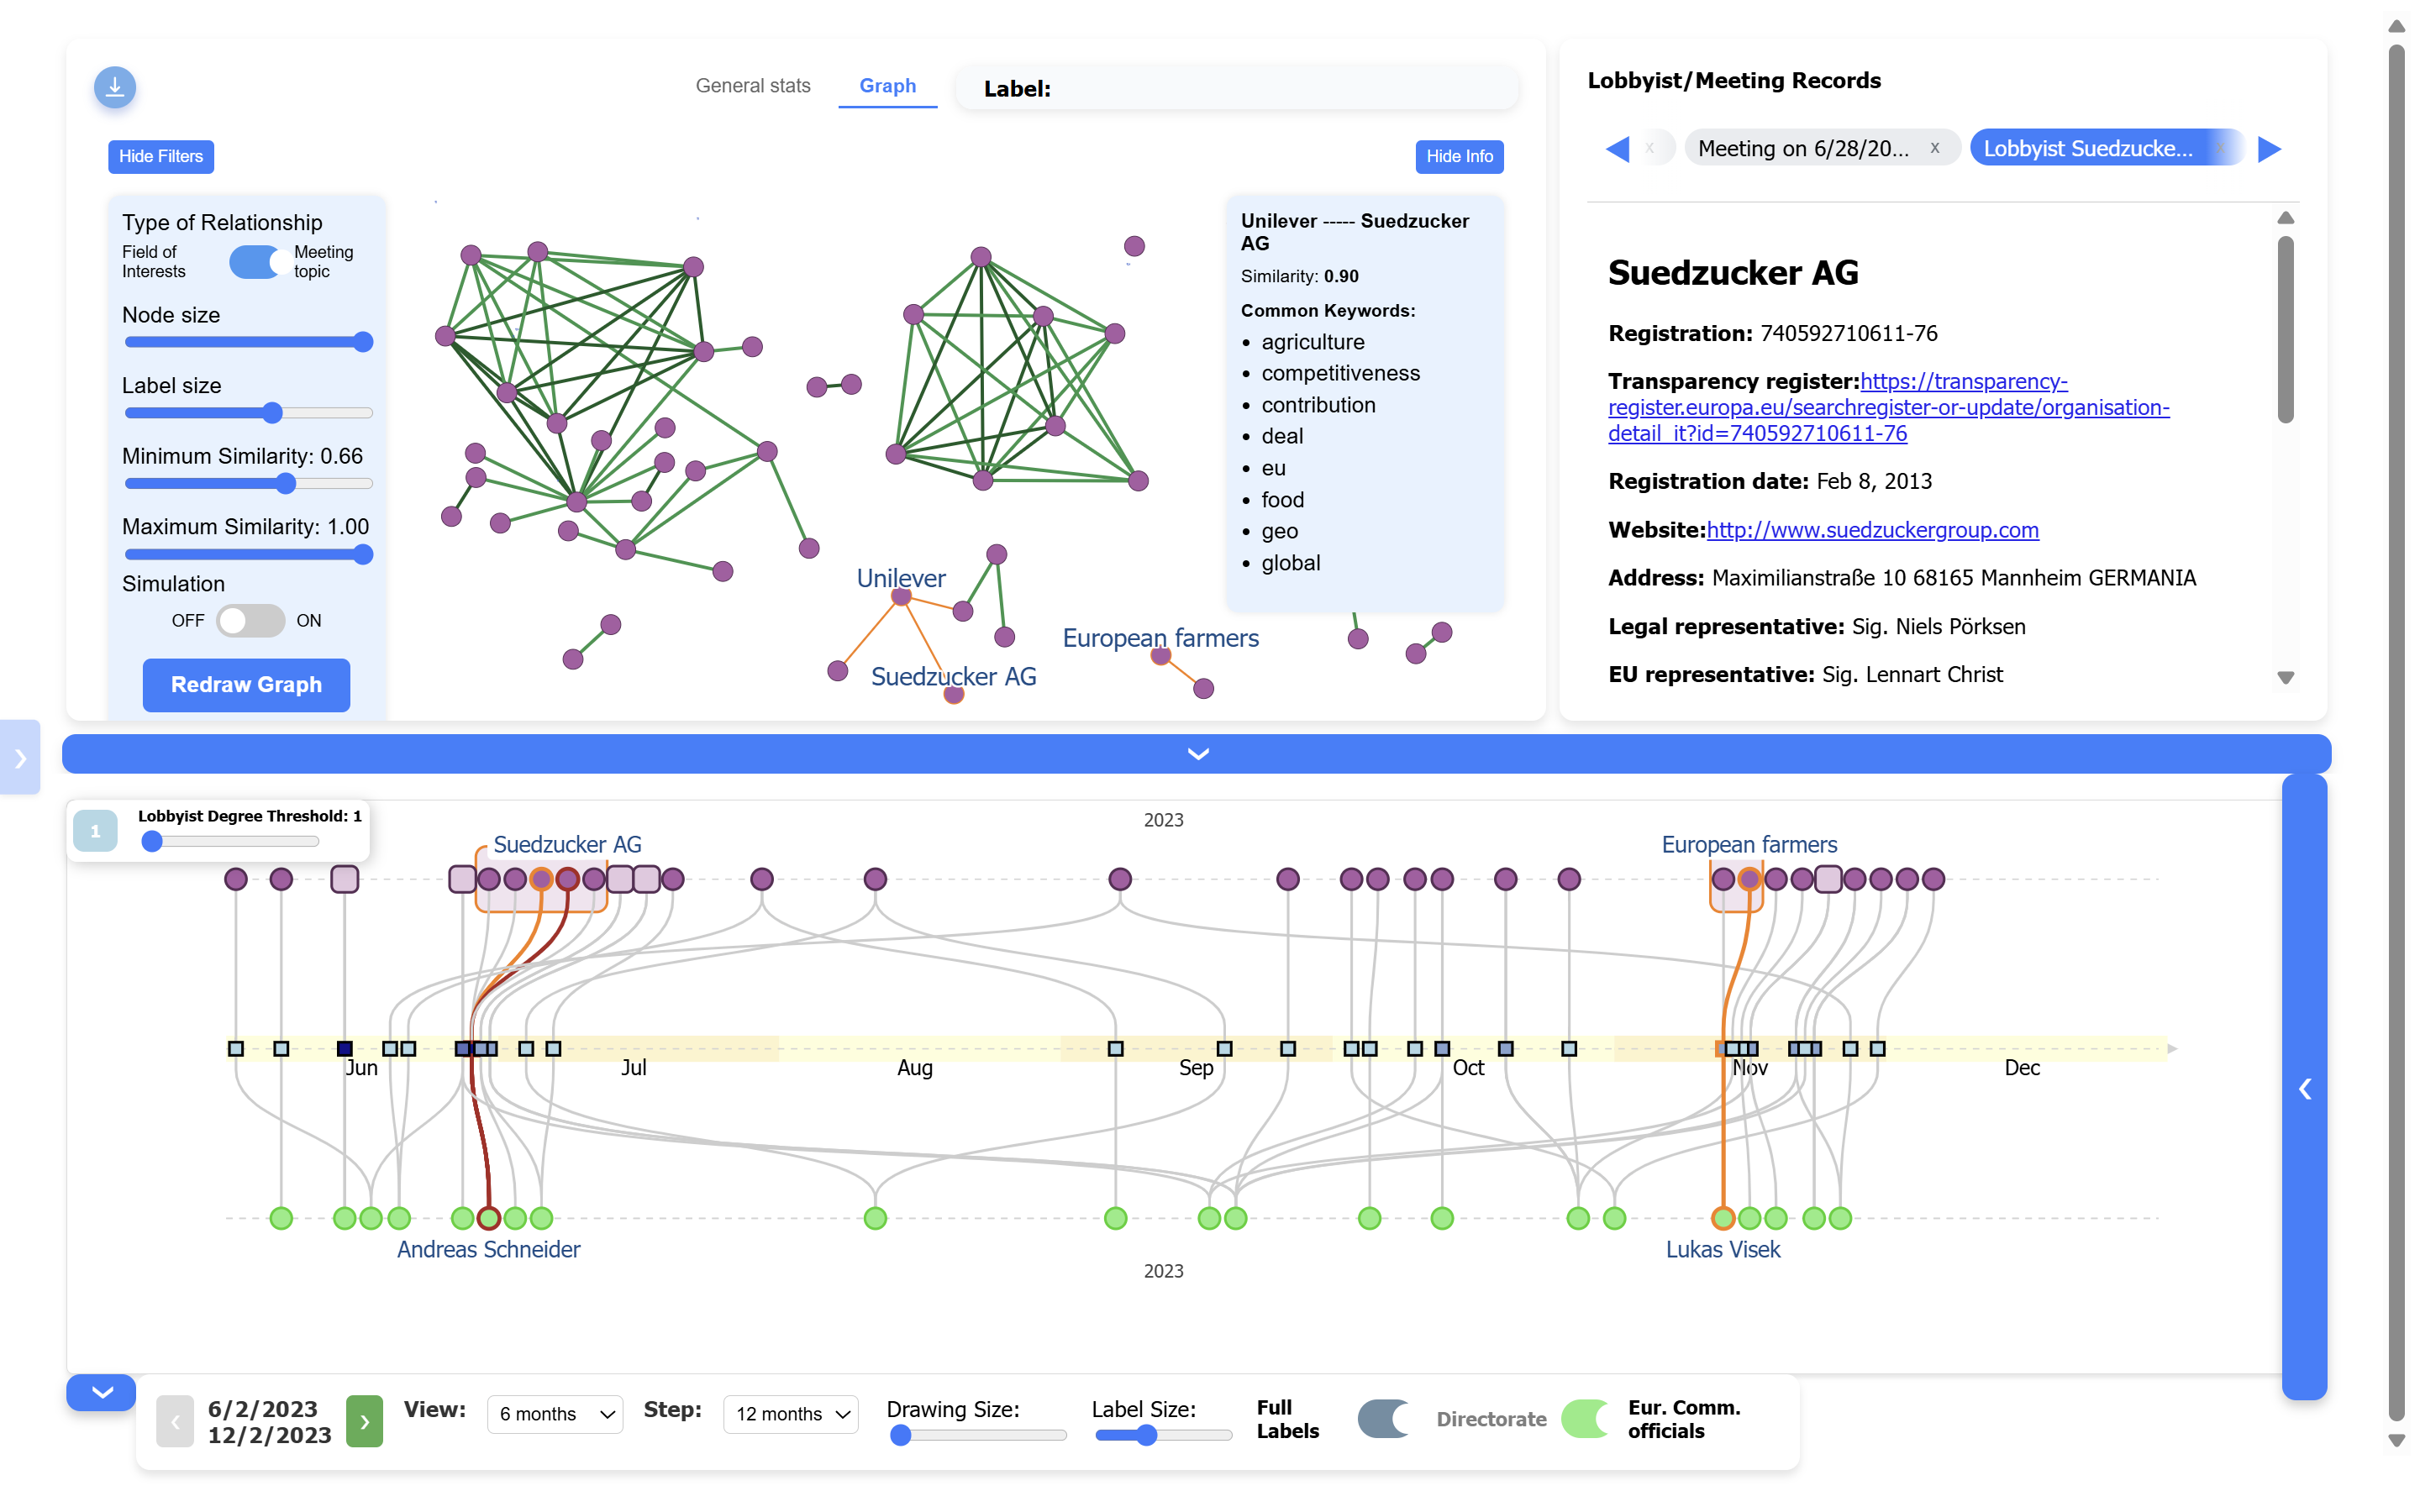
TReView’s user interface is designed to support the tasks described above; see TReView in Figure 1 for a snapshot of the main views of the interface.
The Temporal View exploits a graph-based visualization on three layers. The central layer of the diagram corresponds to the time axis, with the indication of the years and the months. The meetings are displayed (as small squared nodes) along this axis at their corresponding dates. The top layer reports the lobbyists as purple disks, each connected to all meetings in which it is involved; to save space, maximal subsequences of consecutive degree-one lobbyists are grouped into a single (square-shaped) cluster node, which can be expanded to reveal its elements. The bottom layer reports the UE officials as green nodes, still connected to their corresponding meetings; the user may also choose to display directorates instead of EU officials. Clicking on a node, a bar chart of its meeting distribution over time is shown.
The Graph View depicts a similarity network in the classical node-link style: the nodes are the lobbyists involved in the analyzed time period and the edges are similarities between lobbyists, based either on common topics that characterize their meetings with the EU officials or on common fields of interest. The user can interact with this view to adjust the similarity threshold and recognize relevant clusters of lobbyists. The diagram is computed with the force-directed algorithm in the D3.js library [1], engineered to effectively handle the different connected components of the graph, which dynamically change throughout the user interaction. The system exploits fast NLP techniques for real-time extraction of meeting topics and similarity computation.
The Lobbyist/Meeting Records panel displays detailed information about specific lobbyists and meetings upon user’s demand. At any time, a flexible Filter panel (not shown in Figure 1) can be used to focus on specific time periods, lobbyists, EU officials, and meeting’s topics.
3 Case Studies and Demonstration Video
To assess the usefulness of TReView, we conducted two case studies, driven by experts in the legal domain. The first study analyzed the lobbying activities behind the Digital Markets and the Digital Services Acts from December 2020 to December 2022. In addition to offering a clear view of lobbying dynamics, the study revealed a concerning pattern that calls into question the principle of separation of powers – specifically, the divide between legislative and executive branches. The second case studies analyzed the the lobbying dynamics in the automotive sector since the launch of the EU Green Deal strategy on December 2019. It revealed that a high number of EU meetings were held with representative associations of the automotive sector rather than directly with key private companies in the field. Also, a surge in meetings in February 2025 allowed us to discover the promotion of a comprehensive EU strategy aimed to preserve industrial competitiveness and promote decarbonization at the same time. A short video on TReView is available at https://youtu.be/lGq-h2c9GK0.
References
- [1] Michael Bostock, Vadim Ogievetsky, and Jeffrey Heer. D3 Data-Driven Documents. IEEE Transactions on Visualization and Computer Graphics, 17:2301–2309, 2011. doi:10.1109/TVCG.2011.185.
- [2] Raj Chari. New perspectives on lobbying regulation and reform: two generations of research. Interest Groups & Advocacy, 13:381–395, 2024.
- [3] Transparency International EU. EU Integrity Watch. https://www.integritywatch.eu/, 2025.
- [4] Nuria Font and Ixchel Pérez-Durán. Legislative transparency in the European Parliament: Disclosing legislators’ meetings with interest groups. JCMS, 61(2):379–396, 2023.
- [5] Sofia Heikkonen. Transparency materialised: how registers can regulate access to documents? Cambridge University Press, 3(1), 2024.
- [6] Joan R. Martin and Irene A. Galcerà. Lobbying in the EU: prospects and challenges of the mandatory transparency register. Front. Polit. Sci., 6, 2025. doi:10.3389/fpos.2024.1508017.
- [7] Silvia Miksch and Wolfgang Aigner. A matter of time: Applying a data-users-tasks design triangle to visual analytics of time-oriented data. Comput. Graph., 38:286–290, 2014. doi:10.1016/J.CAG.2013.11.002.
- [8] Corporare Europe Observatory and LobbyControl. LobbyFacts.eu. https://www.lobbyfacts.eu/, 2025.
- [9] European Union. Trasparency register. https://transparency-register.europa.eu/, 2025.