Investigating Crossing Perception in 3D Graph Visualisation

Abstract
Human perception and understanding of graph drawings is influenced by a variety of impact factors for which quality measures such as the number of crossings are used as a proxy indicator. For the more and more common stereoscopic 3D (S3D) graph visualisations, evidence is required to better understand graph perception and its relation to quality measures. We investigate the perception of crossing configurations in S3D graph visualisations and present the results of a study.
Keywords and phrases:
Graph Perception, Stereoscopic 3D Graph Visualisation, Crossing ConfigurationsCategory:
Poster AbstractCopyright and License:
2012 ACM Subject Classification:
Human-centered computing Empirical studies in visualization ; Human-centered computing Virtual reality ; Human-centered computing Graph drawings ; Human-centered computing Visual analyticsFunding:
We acknowledge funding by DFG under Germany’s Excellence Strategy – EXC 2117 – 422037984, and DFG project ID 251654672 – TRR 161; we also acknowledge funding by MUR PRIN Project no. 2022TS4Y3N –1405 EXPAND and by MUR PON Project ARS01 00540 RASTA.Editors:
Vida Dujmović and Fabrizio MontecchianiSeries and Publisher:
1 Motivation
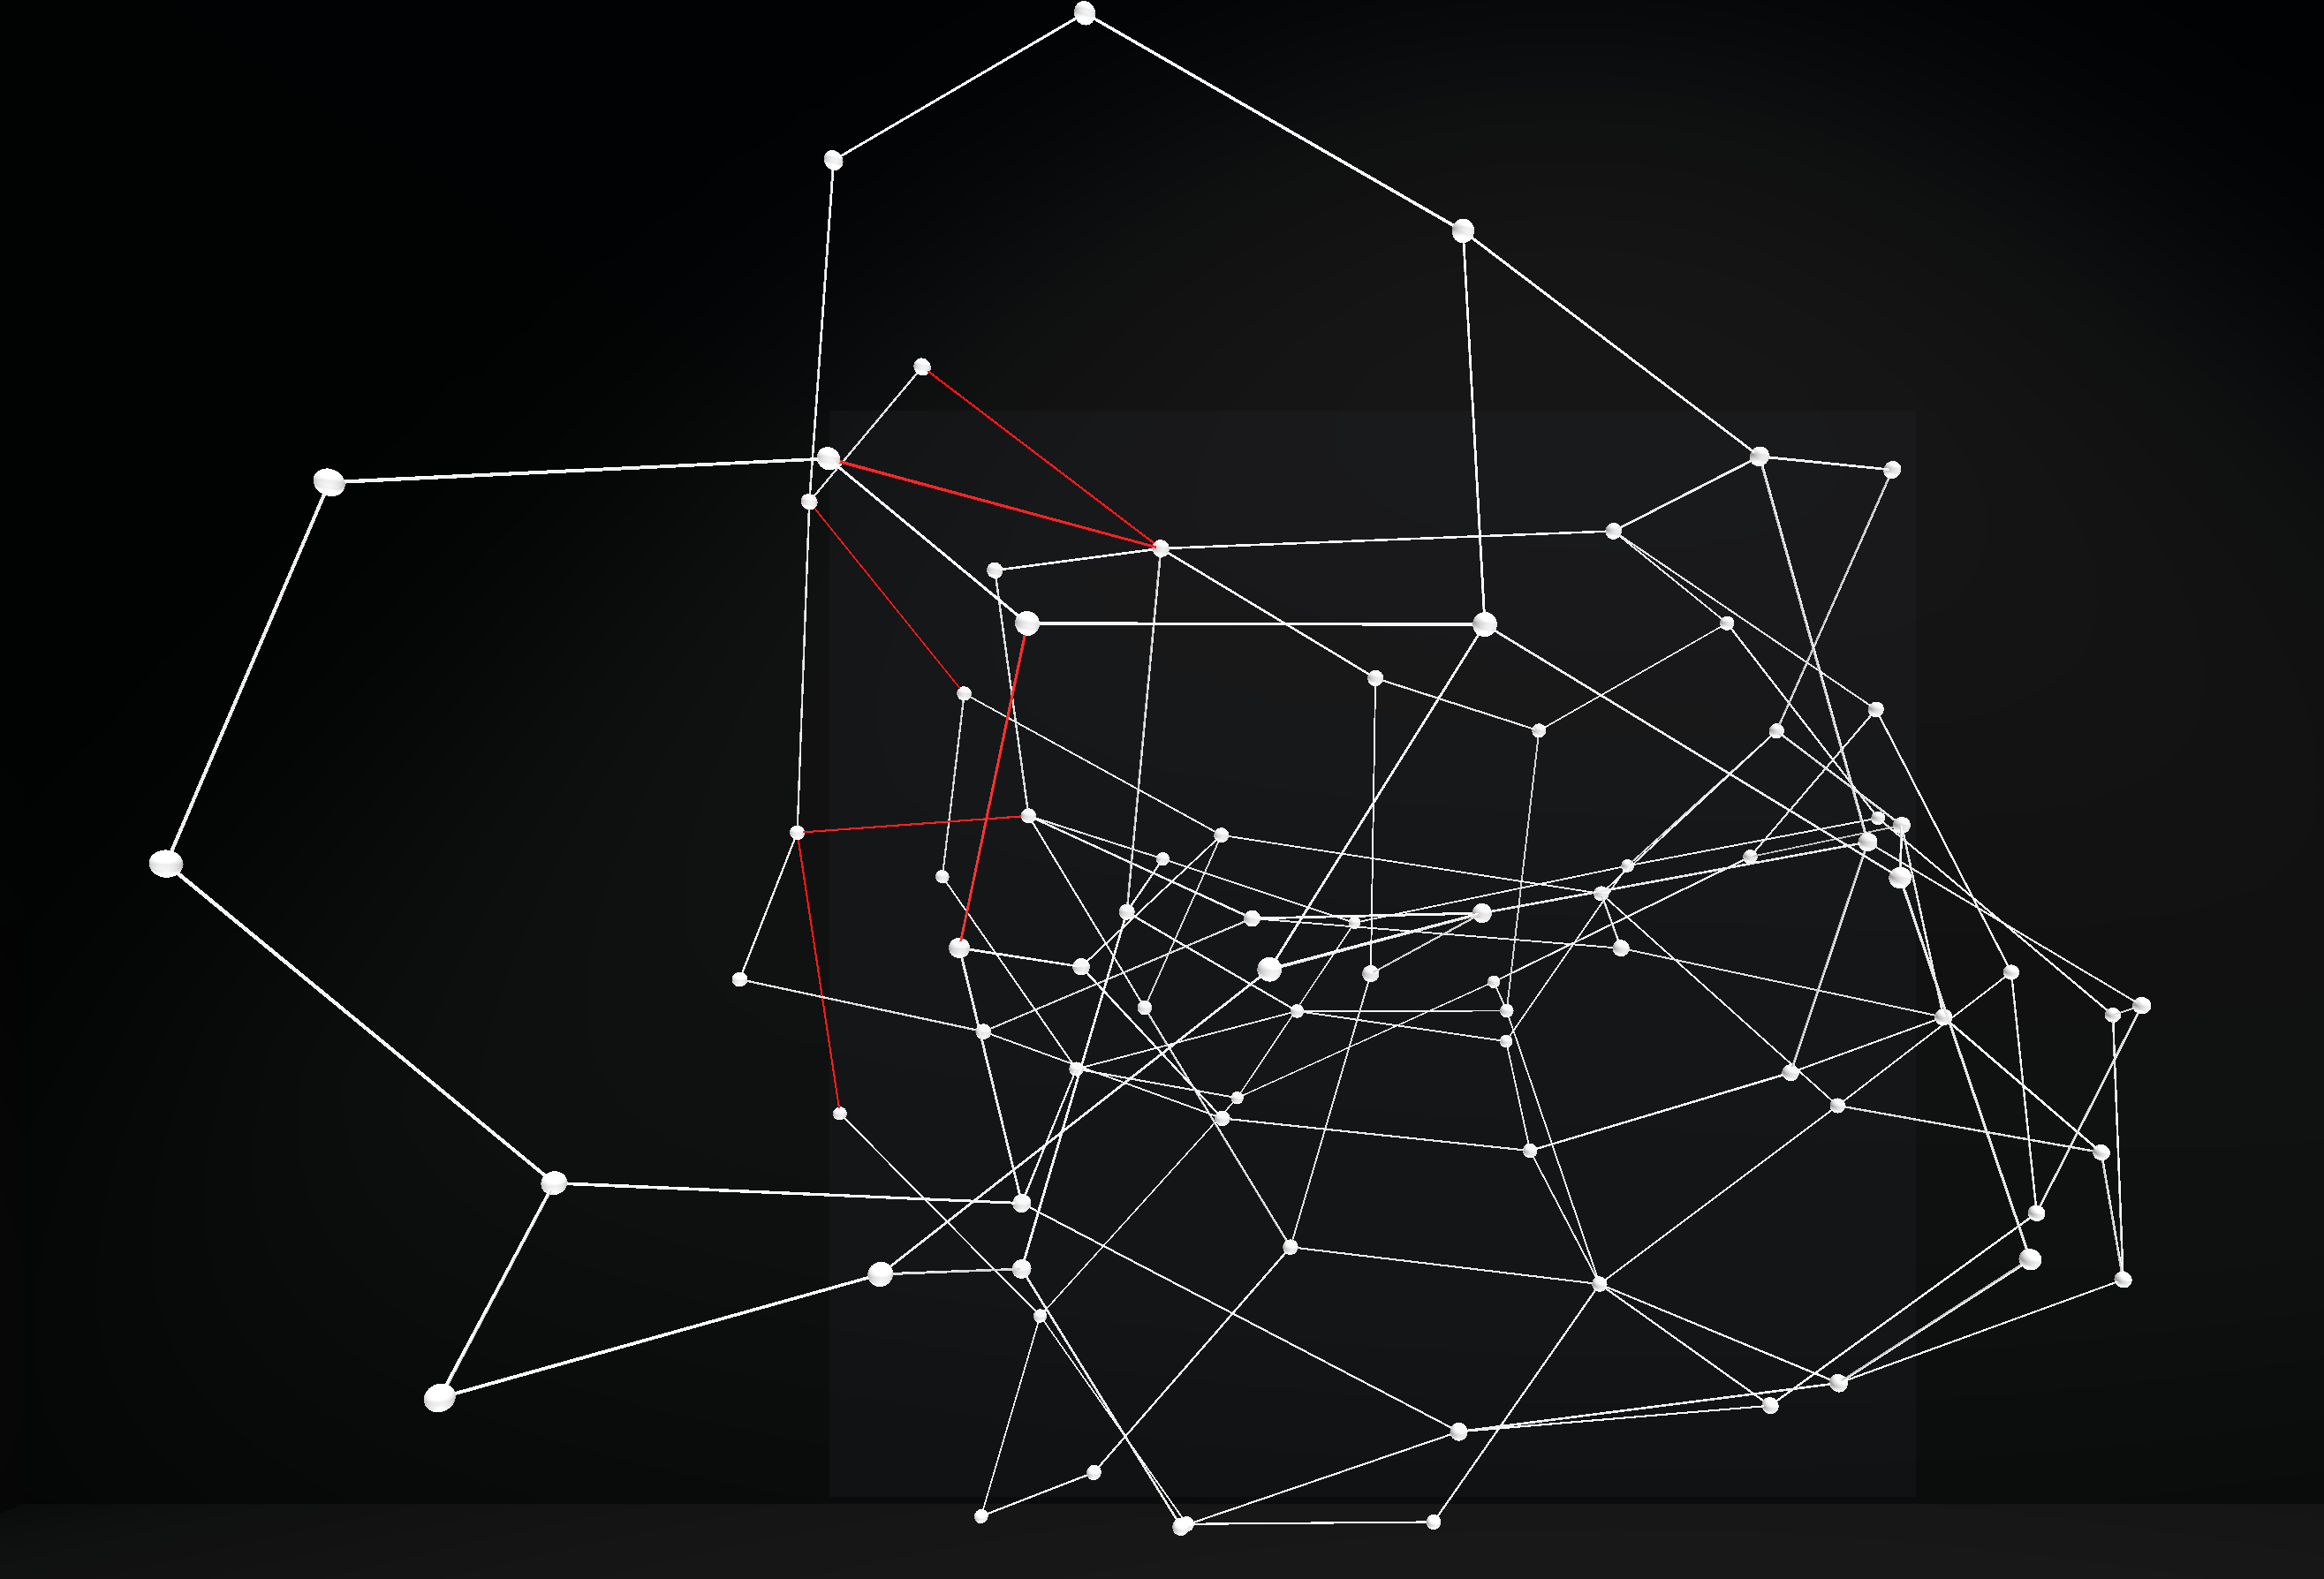
The investigation of impact factors for graph perception is important to evaluate and improve quality measures and drawing algorithms as well as to better understand human graph perception. The number of edge crossings in a 2D graph drawing has long been a main quality measure for drawing evaluation and is still regularly investigated and reported. Their impact is however dependent on further factors such as graph size or crossing angle [6, 3, 9]. The use of stereoscopic 3D graph visualisations has gained attraction over the last years, and results from several studies indicate that they can improve analysis efficiency for a range of analysis scenarios [4, 1, 2, 7, 10]. The importance and effect of impact factors for perception might differ from the classical 2D setting, e.g. due to the influence of depth cues and eye depth focus. While edge crossings can also occur in 3D, there are edge configurations in space that are not crossings but might be perceived as such from a specific viewpoint. Such configurations create crossings when projected on the corresponding 2D image plane and could impact readability similar to 2D crossings. To indicate that most of such edge configurations are not edge crossings in 3D per se, but could be perceived as such, we call them ‘projective edge crossing configurations’, or ‘PECC’ in short. The additional depth aspect and the subsequent impact factor of edge distance in space might further influence the importance of those configurations for readability, and also change the influence of aspects such as the perceived crossing angle. We investigate the impact of such factors in an empirical study and report on findings of difference between major factor categories.
2 Study Design and Setup
As an initial step to investigate the effect of PECCs on graph perception in S3D, we investigate their influence on task performance. As controlled impact factors that serve as independent variables for our study, we add the depth distance of the edges in 3D space at the projected crossing points (IV3) to the established criteria of number of crossings (IV1) and crossing angle (IV2) (which we measure in the projection as an indicator of the perceived number and angles). The study participants were asked to perform three established tasks on 3D graph visualisations in VR: shortest path (SP), common neighbours (CN), and memorisation (ME). We recorded the completion time and accuracy, and the participants were told to perform tasks as accurately and as quickly as they could, while the pace was controlled by the participant. We chose a VR environment for the study, as we could fully control the appearance of the environment and graphs to minimise distraction. The participants remained seated during the study, wearing a head-movement tracking VR HMD (Meta Quest 2), with graph visualisations shown centred in front of their viewpoint, see Figure 1. Except for small head movements, there is no interaction that allows the viewer to change the visual representation of the graphs, in order to avoid changes in the impact factor values. We implemented a Unity application based on the VR graph analysis framework GAV-VR [5].
For the stimuli, we restricted our study to a single graph generator model, the Newman-Watts-Strogatz random graph model, which allows to create graphs with a good combination of local clustering and shortest path lengths as often found in practice [8]. For the layout we decided to use a standard spring-model layout, which provides a reasonable readability for the tasks, as tested by us before the study. In order to test clearly separable conditions for our independent variables, the stimuli were categorised into factor levels as having either low or high number of (projection) crossings - up to (level L) and at least one per task-related edge on average (level H), crossing angles - below (level L) and above (level H), and crossing point distances - as fraction of full graph representation depth (up to level L and above level H). We calculate these variables task-related: Instead of measuring them across the whole graph, we investigate PECCs that are involving task-relevant edges, i.e. (shortest) path edges for SP and ME and edges adjacent to the selected nodes for CN. This results in eight conditions, encoded as XYZ in the following, where X indicates the level for IV1 (H for high, L for low), Y the level of the average IV2, and Z the level of the average IV3. We recruited participants ( male, female) at our university, aged 19-36 years (avg. 24.46). Thirteen of them reported prior VR experience, and seven reported previous graph analysis experience. All participants reported normal or corrected-to-normal vision. We performed a within-subjects experiment and counter-balanced task and condition order.
3 Results
We assumed that, in line with previous studies in 2D setups, it will be easier to perform the tasks with less crossings and larger angles, and in addition that larger edge distance would be the easier factor level, too. In summary, we have for accuracy significant differences between high and low PECC numbers (all tasks), but only for task SP between high and low angles and between high and low distances. For completion time (see Table 1), we recorded significantly shorter times for low PECC number combinations (LXX) across all tasks, shorter times for low angle combinations (XLX) for tasks SP and CN, and no significant differences for distance levels. We could see significant impact on both accuracy and completion time based on differences between pairs of conditions, but also between low and high levels of the number of PECC. Compared to known 2D results, we could observe similar effects for the number, but in contrast to 2D results no similar result for angles, which we deem an important find to be further investigated in future research. For depth impact, we established significant differences between high and low levels of PECC distance. Thus, we think that a deeper investigation of PECC impact factors should be a topic of future research to improve layout quality measures and algorithms for S3D.
![[Uncaptioned image]](ConditionTable.png)
References
- [1] Stefan P Feyer, Bruno Pinaud, Stephen Kobourov, Nicolas Brich, Michael Krone, Andreas Kerren, Michael Behrisch, Falk Schreiber, and Karsten Klein. 2D, 2.5 D, or 3D? an exploratory study on multilayer network visualisations in virtual reality. IEEE Transactions on Visualization and Computer Graphics, 30(1):469–479, 2023. doi:10.1109/TVCG.2023.3327402.
- [2] Nicolas Greffard, Fabien Picarougne, and Pascale Kuntz. Beyond the classical monoscopic 3D in graph analytics: An experimental study of the impact of stereoscopy. In 2014 IEEE VIS International Workshop on 3DVis (3DVis), pages 19–24, 2014. doi:10.1109/3DVis.2014.7160095.
- [3] Weidong Huang, Seok-Hee Hong, and Peter Eades. Effects of Crossing Angles. In 2008 IEEE Pacific Visualization Symposium, pages 41–46, 2008. doi:10.1109/PACIFICVIS.2008.4475457.
- [4] Lucas Joos, Maximilian T Fischer, Julius Rauscher, Daniel A Keim, Tim Dwyer, Falk Schreiber, and Karsten Klein. Visual network analysis in immersive environments: A survey. arXiv preprint arXiv:2501.08500, 2025. doi:10.48550/arXiv.2501.08500.
- [5] Wilhelm Kerle-Malcharek, Stefan P. Feyer, Falk Schreiber, and Karsten Klein. Gav-vr : an extensible framework for graph analysis and visualisation in virtual reality. In Jean-Marie Normand, editor, ICAT-EGVE 2023, pages 131–139. The Eurographics Association, 2023. doi:10.2312/egve.20231321.
- [6] Stephen G. Kobourov, Sergey Pupyrev, and Bahador Saket. Are crossings important for drawing large graphs? In Christian Duncan and Antonios Symvonis, editors, Graph Drawing, pages 234–245. Springer Berlin Heidelberg, 2014. doi:10.1007/978-3-662-45803-7_20.
- [7] Oh-Hyun Kwon, Chris Muelder, Kyungwon Lee, and Kwan-Liu Ma. A study of layout, rendering, and interaction methods for immersive graph visualization. IEEE Trans. Vis. Comput. Graph., 22(7):1802–1815, 2016. doi:10.1109/TVCG.2016.2520921.
- [8] M.E.J. Newman and D.J. Watts. Renormalization group analysis of the small-world network model. Physics Letters A, 263(4):341–346, 1999. doi:10.1016/S0375-9601(99)00757-4.
- [9] Helen Purchase. Which aesthetic has the greatest effect on human understanding? In Giuseppe Di Battista, editor, Graph Drawing, pages 248–261. Springer Berlin Heidelberg, 1997. doi:10.1007/3-540-63938-1_67.
- [10] J. Sorger, A. Arleo, P. Kán, W. Knecht, and M. Waldner. Egocentric network exploration for immersive analytics. Comput. Graph. Forum, 40(7):241–252, 2021. doi:10.1111/cgf.14417.