Automatic Layout of Railroad Diagrams

Abstract
Railroad diagrams (also called “syntax diagrams”) are a common, intuitive visualization of grammars, but limited tooling and a lack of formal attention to their layout mostly confines them to hand-drawn documentation. We present the first formal treatment of railroad diagram layout along with a principled, practical implementation. We characterize the problem as compiling a diagram language (specifying conceptual components and how they connect and compose) to a layout language (specifying basic graphical shapes and their sizes and positions). We then implement a compiler that performs line wrapping to meet a target width, as well as vertical alignment and horizontal justification per user-specified policies. We frame line wrapping as optimization, where we describe principled dimensions of optimality and implement corresponding heuristics. For front-end evaluation, we show that our diagram language is well-suited for common applications by describing how regular expressions and Backus-Naur form can be compiled to it. For back-end evaluation, we argue that our compiler is practical by comparing its output to diagrams laid out by hand and by other tools.
Keywords and phrases:
syntax diagram, graph layout, line wrapping, pretty-printingCopyright and License:
![[Uncaptioned image]](x1.png) © Shardul Chiplunkar and Clément Pit-Claudel; licensed under Creative Commons License CC-BY 4.0
© Shardul Chiplunkar and Clément Pit-Claudel; licensed under Creative Commons License CC-BY 4.0
2012 ACM Subject Classification:
Human-centered computing Visualization ; Software and its engineering Software notations and toolsSupplementary Material:
Software (Source Code): https://github.com/epfl-systemf/librrd/releases/tag/ecoop2026-artifact [20]Acknowledgements:
The authors thank Viktor Kunčak, Emir Demirović, and Hugo Herbelin for many insightful discussions, and the anonymous peer reviewers for their helpful feedback. Both authors are members of the EPFL-Inria REMPAR associate team.Funding:
This work was funded in part by the Swiss National Science Foundation (SNSF) under grant no. 10003649. This material is based upon work supported by the Air Force Research Laboratory (AFRL) and Defense Advanced Research Projects Agencies (DARPA) under Contract No. FA8750-24-C-B044. Any opinions, findings, and conclusions or recommendations expressed in this material are those of the author(s) and do not necessarily reflect the views of the AFRL and DARPA.Supplementary Material:
Software (ECOOP 2026 Artifact Evaluation approved artifact): https://doi.org/10.4230/DARTS.12.1.13Editors:
Robbert Krebbers and Alexandra SilvaSeries and Publisher:
 Leibniz International Proceedings in Informatics, Schloss Dagstuhl – Leibniz-Zentrum für Informatik

1 Introduction
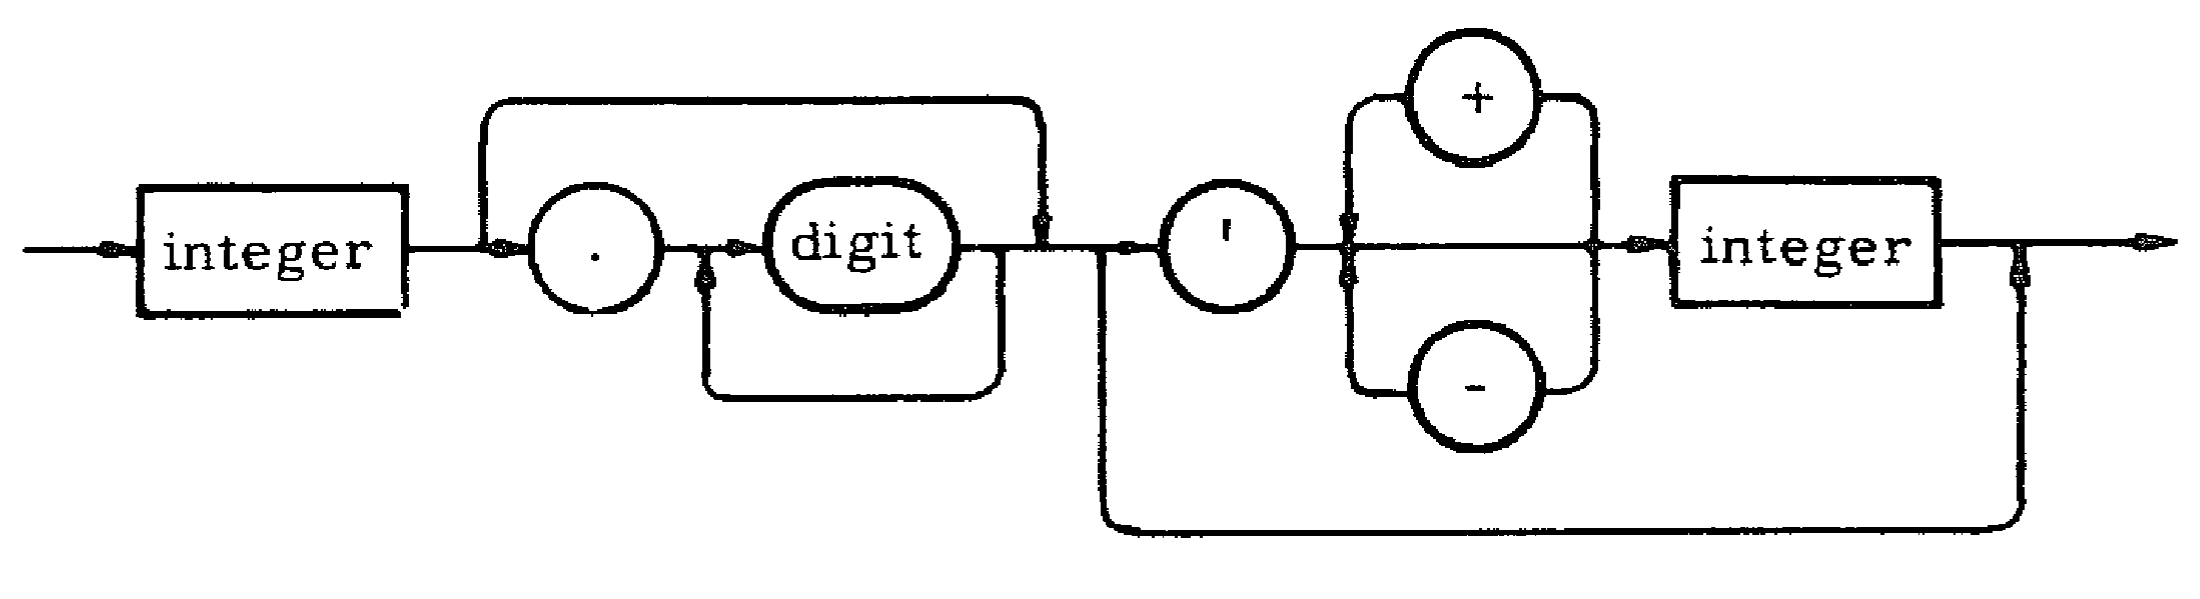
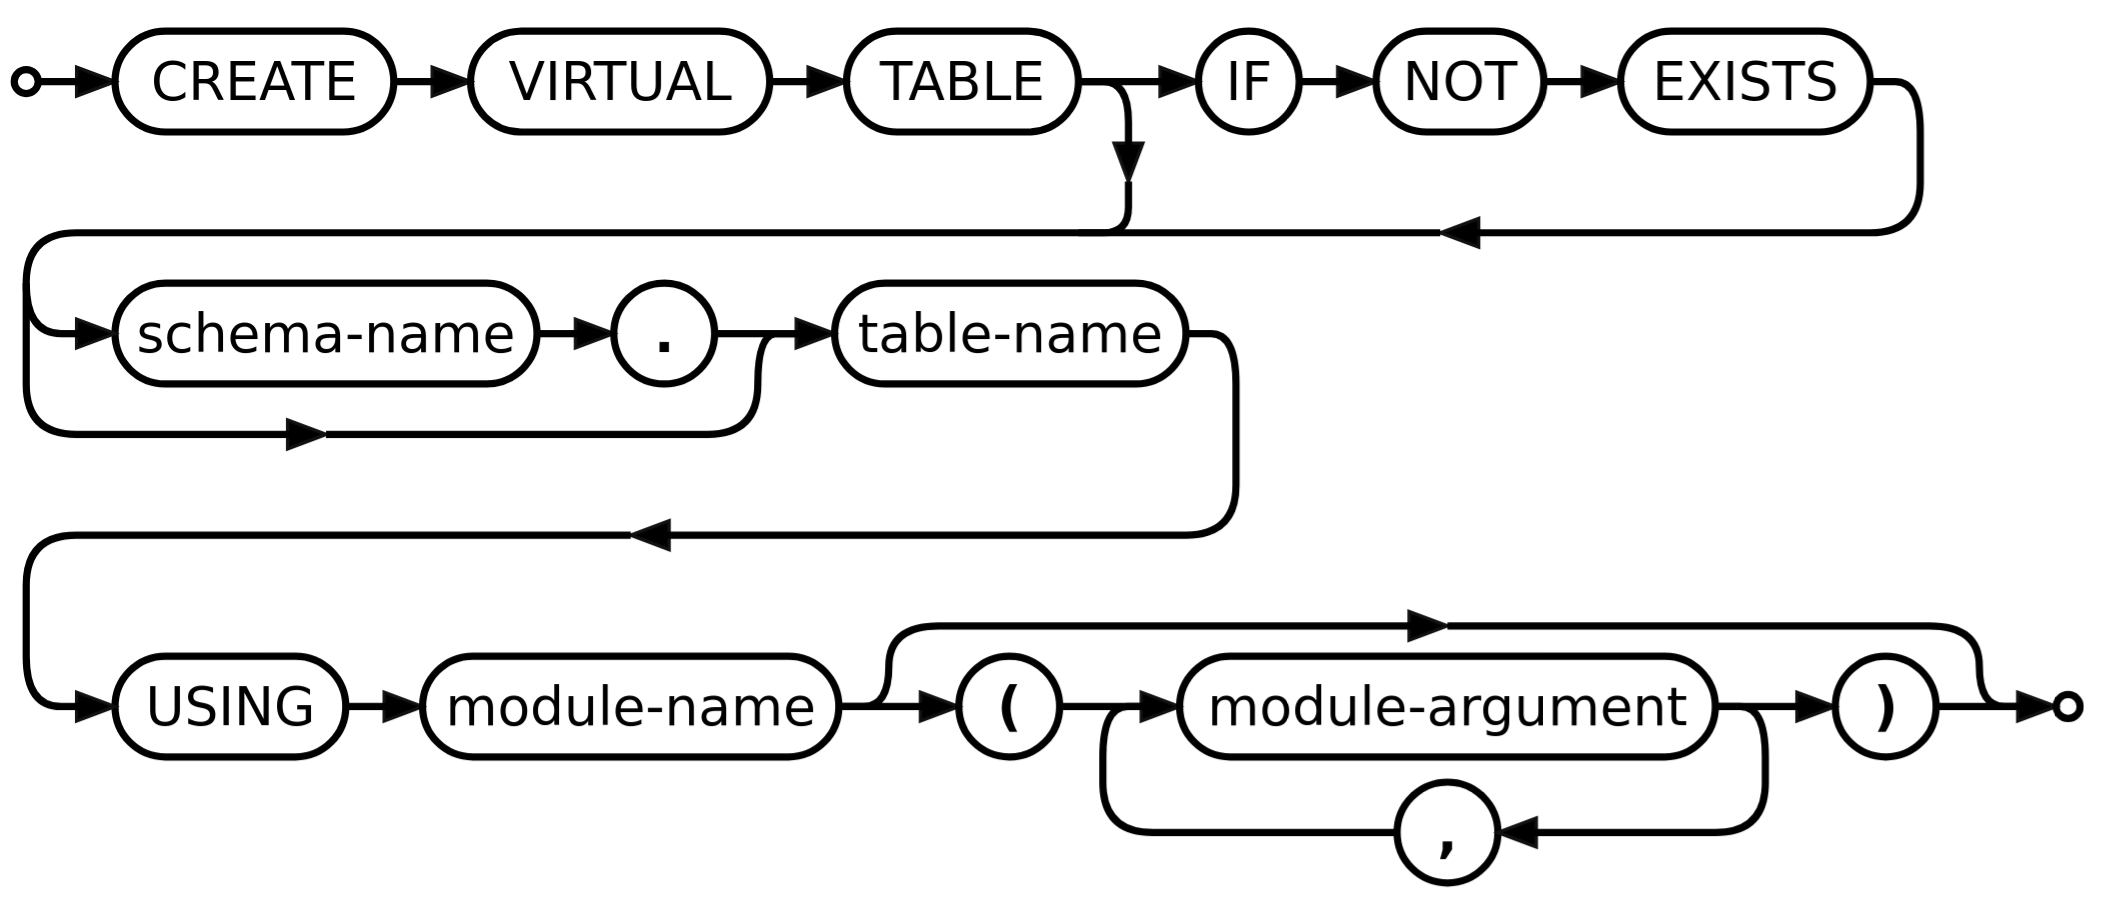
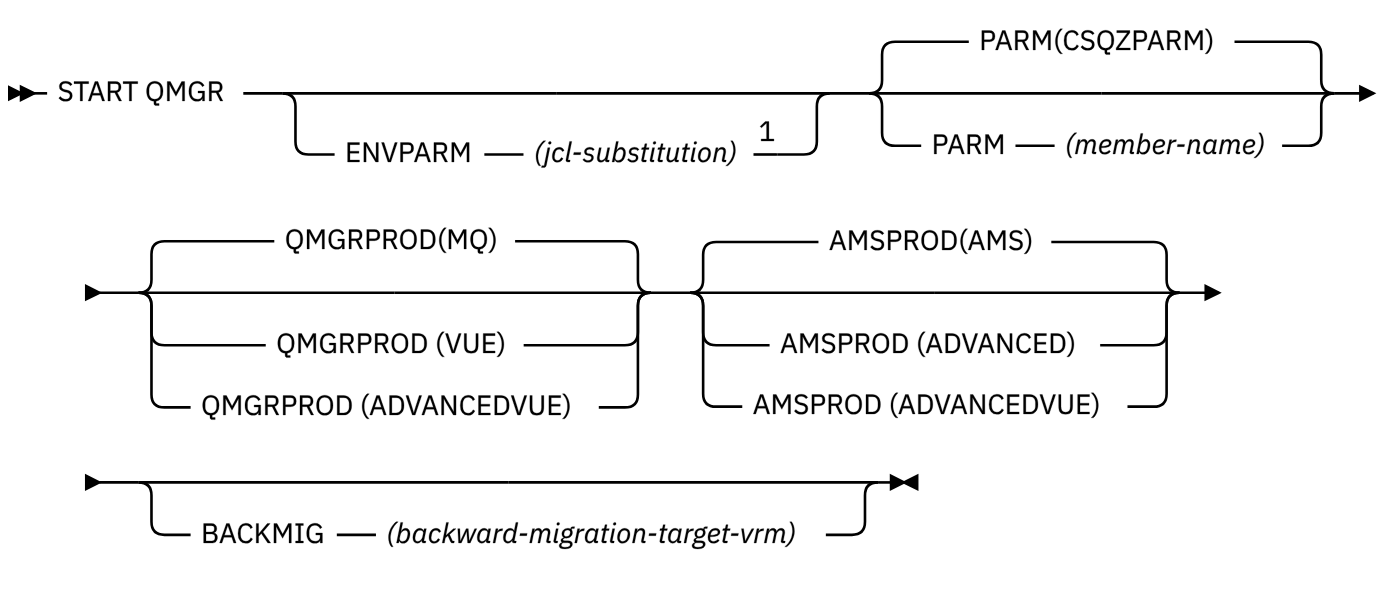
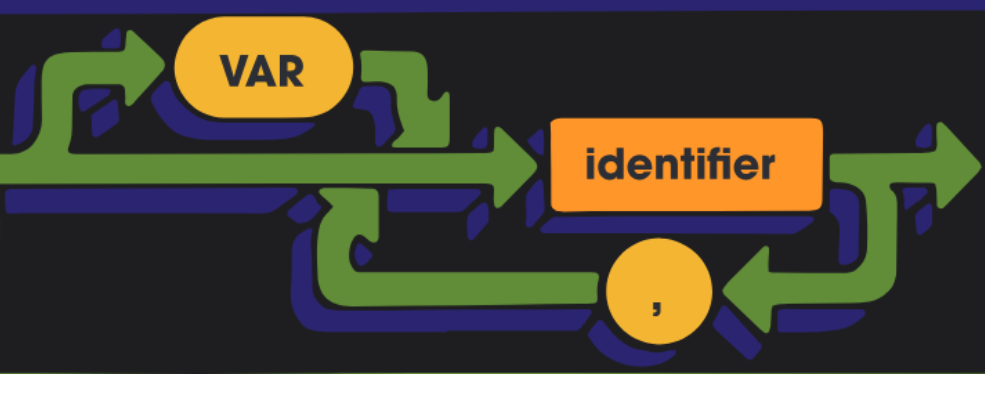
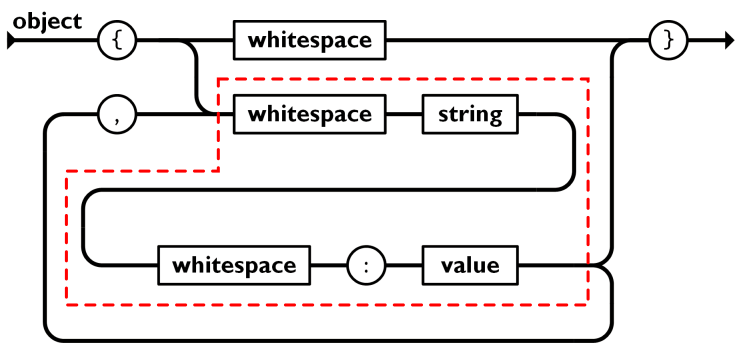
Railroad diagrams, also called syntax diagrams, are a class of schematic visualizations of formal grammars. Common uses include documenting general-purpose and domain-specific languages (Figure 1) and teaching and illustrating regular languages [9, 6, 40, 18]. While some sources explain how to read the diagrams, many do not – including [97], despite being the first (to our knowledge) published instance.111See [83] for further evidence of this being the first usage. This suggests that railroad diagrams have been considered intuitive or common enough to need no explanation since at least 1970.
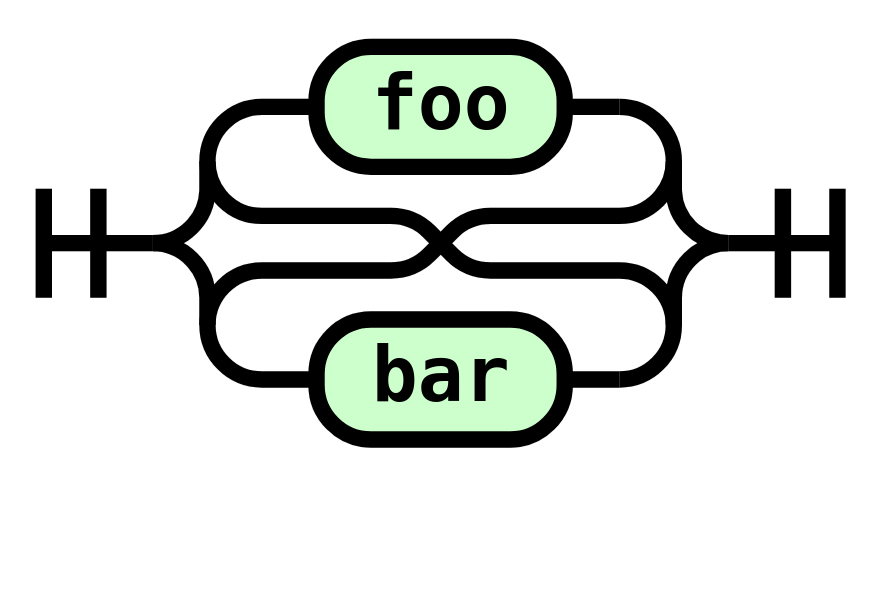
There are many decisions to make when drawing a railroad diagram. Some concern its semantic content, such as whether to represent recursion with a visual loop or a named self-reference. Some are purely stylistic, such as the choice of colors. The rest are about layout: the visual arrangement (positions, sizes) of the basic shapes that constitute the diagram. (See Figure 3.) These layout decisions are what we focus on in the present work.
Automating the layout of structured objects for display is a well-studied problem. Examples include wrapping paragraphs of text [56, 50, 68, 11, 25], pretty-printing code [74, 10, 42, 65, 75, 84, 94], arranging content on web- and physical pages [92, 22, 46, 48], graph-drawing [86, 100, 35], and visualizing data and statistics [96, 95, 38, 79, 13, 43]. While automation makes layout less tedious, error-prone, and hard-to-update than doing it by hand, it loses some of the freedom to choose between valid alternative layouts. Useful automation must identify, and often let the user specify, which choices are reasonable or desired: it must formally characterize the layout problem. Indeed, formal study underlies practical tools in almost all the research cited above. For instance, pretty-printers from the seminal [65] to the modern [74] have had formalism at their core, and text wrapping has even been cast as a model problem for formalism-driven programming [11, 25].
However, a class of layout problems that so far has not enjoyed the benefits of automation are those that exhibit a hierarchically nested reading order, like structured control flow graphs and electrical and hardware circuit diagrams, which we call 1.5-dimensional problems. Our terminology stems from the observation that some layouts have 1-dimensional structure with a global, linear reading order, such as for text or code (first left-to-right, then top-to-bottom, in English), whereas others use available space more freely in 2 dimensions without a strict reading order, such as node-link graphs. 1.5-dimensional layouts are intermediate. Like 1-dimensional layouts, they can be wrapped to fit a target size, but subcomponent layouts can split or merge while still independently participating in the reading order. Meanwhile, they could be seen as stylized 2-dimensional layouts of directed graphs, but conventional graph layouts are much less rigid and structured, whether done by hand or by standard algorithms. The fact that many 1.5-dimensional layouts are still created by hand or with ad hoc adjustments to general-purpose graph layout tools222E.g., a 2021 dissertation about visualizing control flow graphs [27] states that visualizers “commonly use general layered layout algorithms such as [GraphViz’s] Dot”, even though that makes “formulating the constraints for high-level requirements such as preserving program structures […] challenging”. is evidence of the lack of a satisfactory automated alternative – and of the potential value of a principled, formal approach.
1.1 Contributions
In this paper, we study the layout of railroad diagrams as an emblematic instance of a 1.5-dimensional problem, whose challenges – nested wrapping, alignment and justification, wide hand-drawn stylistic variation – are representative of the class. More precisely, we formalize and develop an algorithm for railroad layout:
-
1.
We define a diagram language and a layout language (Subsection 2.1, Subsection 2.2) that lets us precisely specify railroad layout as compilation from the former to the latter (Subsection 2.4).
-
2.
We show that our formalism is realistic despite being simple: it captures most of the variation in hand-drawn railroad diagrams and guides the design of a practical algorithm.
-
3.
We design a three-step compilation algorithm, illustrated in Figure 4, consisting of vertical alignment, then wrapping to meet a target width, and finally horizontal justification.
-
4.
We frame wrapping as parametric optimization and develop practical heuristics (Subsection 3.2).
-
5.
We implement the compiler that we describe.
First, we present our formalism (Section 2) and then our algorithm (Section 3), although the two evolved together in reality. Then, we argue that our formalism is realistic by showing that common grammar notations are easy to translate to our diagram language (Subsection 4.1) and that most manual layouts can be expressed in our layout language (Subsection 4.2). We further argue that our algorithm compares favorably to manual layout, going beyond existing tools (Subsection 4.3) while being performant enough for interactive use (Subsection 4.4). Lastly, we discuss how prior work in layout and diagramming relates to ours (Section 5).
The novelty of our solution lies in its practical, principled approach to automatic railroad layout, notably for wrapping. When used as static documentation, railroad diagrams are often laid out and updated by hand (e.g. Figures 1 and 5 except 5(d)). Manual layout is tedious and hard to update [15], especially when reflowing a wrapped layout or maintaining differently-wrapped layouts for different media. Worse, it is prone to semantic errors and stylistic inconsistencies (e.g. Figures 25 and 26) [15]. Beyond addressing these problems with automation, our tool can also reproduce many existing manual layouts and produce comparable alternatives for the rest, making it a practical replacement. Further, it is unique in its principled approach aiming for convenient layout “idioms” and “cost-benefit balance” [21], with exploratory, interactive theorem-proving and programming environments in mind. For instance, few other tools perform automatic wrapping, and none let the user control it.
Formalism has long served as a tool for clarity of thought and computational expression in layout research, and we follow suit. We hope that formal foundations will aid further study of railroad layout beyond our work and of its applications beyond syntax. As an example, an extension of regular algebra gives Kleene Algebra with Tests (KAT), a powerful formalism for equational reasoning about programs and control flow [57]; a corresponding slight extension to railroad diagrams can illustrate KAT terms (e.g. Figure 3). Recent work on the formal semantics of railroad diagrams and similar diagrammatic calculi [40, 69, 2] as well as formally verified web layout [67, 66] and pretty-printing [74] suggests several directions for future work. More broadly, structured layout remains an open problem for ubiquitous diagrammatic notations, and we hope railroad-style layout may play a part in a unifying solution.
1.2 Glossary
- diagram
-
A conceptual specification in terms of components and how they connect and compose. It has no height, width, or other visual properties, but it has structure.
- layout
-
A graphical specification in terms of basic shapes and their sizes and positions. It has visual properties like height and width, but also retains structure from which the diagram can be recovered. It is the result of laying out a diagram, possibly under constraints like width. Figure 3 illustrates how a diagram can have many different layouts.
- rendering
-
A concrete realization of a layout, in a format that can be directly displayed (like a bitmap) or executed for display (like canvas drawing instructions).
A diagram cannot be directly rendered, but must first be laid out. Yet, to have a visual reference for raw or partially laid-out diagrams, we use layouts rendered with dashed red lines, sometimes partly built by hand, e.g. to depict ill-formed intermediate states in Figure 4. Proper layouts are in solid black and are all generated by our tool.
- 1.5-dimensional layout problem
-
When layouts exhibit a hierarchically nested reading order. See the last paragraph before Subsection 1.1. Our definition aligns with previous, more limited uses of the term, discussed further in Section 5.
- bounding box
-
The smallest axes-aligned rectangle that completely encloses a shape.
- flexbox
2 A formal account of railroad diagrams and their layout
There is a lot of variation in what are called “railroad diagrams” by their creators, because the term has never been formally defined before, and because they are often hand-drawn. Much of it can be ascribed to æsthetic choices that will naturally vary from author to author. Yet, even after abstracting a unifying visual schema or grammar, some structural variation remains. We choose to exclude a part of it from our scope to achieve succinct definitions that nonetheless capture a large portion of the variation seen in the wild, which we quantify in Subsection 4.2 and Subsection 4.3. Our three exclusions are illustrated in Figure 5 and explained below.
First, we only consider well-nested diagrams: diagrams composed of n-ary sequences of subdiagrams in the same direction, binary stacks of subdiagrams (potentially in opposite directions), and atomic tokens. This almost describes two-terminal series-parallel (SP) graphs, except that they are usually defined to be either undirected or acyclic [14, 2], whereas we allow cycles. (We further discuss SP graphs in Section 5 and justify why stacks are binary in Subsection 2.1.) This criterion naturally extends to layouts: the well-nesting of a diagram must be reflected in the visual nesting of its layout. Specifically, we only consider layouts where the bounding box of each sublayout (corresponding to the decomposition above) does not overlap with those of unrelated sublayouts. The bounding boxes then have the same nesting structure as the diagram. Figures 5(a) and 5(b) are examples of ill-nested diagrams and layouts.
Next, we require layouts to have a single semantic axis: all sublayouts (corresponding to the diagram decomposition) must be laid out horizontally. 5(c) is an example violation.
Lastly, we exclude constructs we have not found to be in common use, even if some railroad diagram tools can produce them. 5(d) is an example from a popular library.
(One additional condition is not essential but simplifies our presentation: the backward component of a loop must not be above the forward component, as in 1(a). Including such loops would be straightforward but would make our formalism longer and more confusing.)
2.1 The diagram language
We define our diagram language inductively in Figure 7. The first two cases are terminal and nonterminal tokens parameterized by a string label. The next case is a sequence with zero or more subterms. The last case is a stack with exactly two subterms, parameterized by a polarity, + or -. An empty sequence () is also denoted . For the rest of this paper, a “diagram” is a term in this language. The constructors are illustrated in 6(a).
Although laid-out stacks often appear to have more than two subdiagrams (e.g. the three-way stack in 1(a)), we find that having stacks be only binary is the simplest model that accounts exactly for all possible layouts. We use the same constructor for positive and negative stacks because both result in a layout with (i) vertically stacked sublayouts with brackets on the sides, (ii) no wrapping opportunities beyond what the sublayouts present, and (iii) possible collapsing with a containing stack. However, they differ in when such collapsing is possible, such as in 6(b). We thus need layout well-formedness rules to capture such differences, and in Subsection 2.3, we state a clean set of such rules while treating all stack layouts as binary. Consequently, to simplify the relation between diagrams and layouts, we treat (diagram-level) stacks as binary, too. (The association order of nested binary positive stacks does not affect the rendering, unlike negative stacks (see Subsection 4.1).)
In contrast to stacks, the association order of subdiagrams in a sequence has no bearing on the layout, so sequences are -ary without ado. Formally, the canonical form of a diagram is the result of repeatedly splicing nested sequences, a trivially confluent rewriting: any sequence (D1 …) with a subdiagram Di which is itself a sequence (Di1 …) is rewritten to (D1 … Di1 … …), replacing Di with its subdiagrams. We call two diagrams equivalent if they have the same canonical form.
2.2 The layout language
| diagram | d | := | "lbl" | [lbl] |
| | | (d…) | ||
| | | (pol d d) |
| direction | dir | := | ltr | rtl |
| width | w | := | real 0 |
| label, marker | lbl, mk | := | string |
| terminal flag | tm? | := | boolean |
| polarity | pol | := | + | - |
| row number | r | := | integer > 0 |
| proportion | p | := | 0 real 1 |
| layout | |
|---|---|
| := | (rail dir w) |
| | | (space dir) |
| | | (station dir lbl tm?) |
| | | (hconcat dir …) |
| | | (vconcat-inline dir ts ts mk |
| …) | |
| | | (vconcat-block dir ts ts pol ) |
| tip specification ts | |
| := | vertical |
| | | (logical r) |
| | | (physical p) |
We define our layout language inductively in Figure 9 and illustrate it in Figure 10. The constructors, and their parameters beyond direction (left-to-right or right-to-left), are:
-
(atomic constructors) rails, with a nonnegative real width; spaces; and stations, with a string label and a terminal flag indicating whether it is a terminal;
-
a horizontal concatenation of one or more subterms;
-
an inline vertical concatenation (“inline VC”) of two or more subterms, with a string marker and left and right tip specifications; and
-
a block vertical concatenation (“block VC”) of exactly two subterms, with a polarity (positive or negative) and left and right tip specifications.
A tip is where a layout starts or ends, and where a containing layout can connect to enter or exit it. Naturally, each layout has a tip on either side. Either tip of a VC can be specified as:
-
vertical, for collapsing with a containing stack;
-
a logical row number, a positive integer, to align with an inner sublayout after collapse; or
-
a physical proportion, a real between 0 and 1, interpolating between the highest (0) and lowest (1) possible tips, which are not necessarily aligned with logical rows.
Any other layout has (logical 1) tips on both sides by default. Lastly, we define the start and end sides of an inline VC as left and right if the direction is left-to-right, else vice versa.
2.3 Layout well-formedness
Unlike diagrams, not all layouts in the language above are well-formed. For instance, a right-to-left horizontal concatenation must be constructed with right-to-left sublayouts, in visual (i.e., reverse) order (e.g. bottom left of Figure 10). In informal terms, our definition of well-formedness (to follow) aims to avoid “nonsense” layouts, where, say, a collapsed edge has no consistent direction, or sublayouts are visually disconnected. Moreover, a well-formed layout leaves no ambiguity or context-dependence in its rendering.
To state the well-formedness rules, we must first define three other layout properties: width, number of logical and connectable rows on either side, and up- and down-connectability on either side. The definition of width below assumes a constant , the unit width around curves and boxes.
-
The width of a rail is its width parameter.
-
The width of a space is .
-
Stations have implementation-dependent widths, plus .
-
The width of a horizontal concatenation is the sum of its sublayouts’.
-
The width of an inline VC is the sum of: (i) the width of its first sublayout; (ii) the width of its marker (implementation-dependent); and (iii) if its start-side tip specification is a physical proportion other than 0 (i.e. if it needs a bracket), and likewise for its end side if other than 1.
-
The width of a block VC is that of its first sublayout, plus for each non-vertical tip.
The multiples of account for vertical brackets in the rendering, e.g. as illustrated by Figure 13 for a block VC.
Second, we define the number of logical rows on either side. The number of connectable rows is equal to the logical one except where noted. All tips and numbers of rows refer to the same universally quantified side:
-
Spaces, rails, stations, and block VCs with a non-vertical tip all have 1 row.
-
A horizontal concatenation has as many rows as its sidemost sublayout.
-
An inline VC has as many rows on its start side as its first sublayout on that side, and likewise for its end side with its last sublayout.
-
A positive block VC with a vertical tip has as many rows as the sum of the number of connectable rows of its top and bottom sublayouts.
-
A negative block VC with a vertical tip has as many logical rows as the sum of its top and bottom sublayouts, minus the number of connectable rows of its top sublayout, plus 1; and only 1 connectable row. (See Figure 13.)
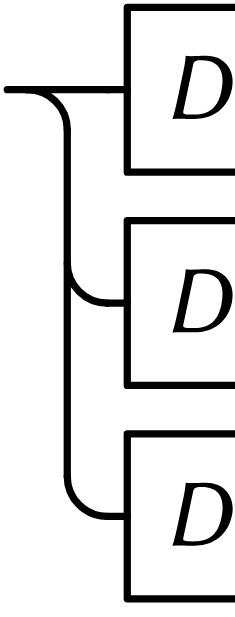
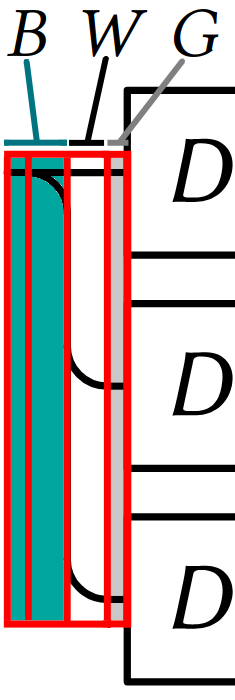
Third, we define up- and down-connectability on either side. Up-connectability is meant to capture if a layout can be connected to “from above” when contained in block VCs, and likewise for down-connectability; see Figure 13. “Both-” and “neither-connectable” have their natural meanings. “Up-/down-” means up- and down- separately. On each side:
-
Rails, stations, and block VCs with a non-vertical tip are all neither-connectable.
-
A space is both-connectable.
-
A horizontal concatenation is up-/down-connectable only if its sidemost sublayout is.
-
An inline VC is up-/down-connectable on its start side only if its first sublayout is; and likewise on its end side with its last sublayout.
-
The up-/down-connectability of a block VC with a vertical tip and polarity pol depends on the nature of its top/bottom sublayout and is best described with tables. Below, “if top/bot” means “if the top/bottom sublayout has the property under consideration”.
pol top sublayout up-ctbl. + -ve block VC no + else if top - +ve block VC no (Figure 13) - else if top pol bot sublayout down-ctbl. + -ve block VC no + else if bot - -ve block VC no - else if bot
Finally, we can state the well-formedness rules, also presented as formulae in Figure 14.
- WFr, WFsp, WFst
-
Rails, spaces, and stations are well-formed.
- WFc
-
A horizontal or inline vertical concatenation is well-formed if all sublayouts are well-formed and have the same direction as .
- WFhc
-
In addition to WFc, a horizontal concatenation is well-formed if all sublayouts are neither-connectable, except possibly its sidemost sublayouts.
- WFt
-
A VC is well-formed if, on either side, if the tip is (logical r), then r is no greater than the number of logical rows; or if it is vertical, then the VC is either up- or down-connectable.
- WFivc
-
In addition to WFt, an inline VC is well-formed if:
-
All sublayouts are neither-connectable, except possibly the first sublayout on its start side or the last sublayout on its end side.
-
The first and last sublayouts have the same width , and the other sublayouts have width , where is the width of the marker.
-
- WFbvc
-
In addition to WFt, a block VC with direction dir and polarity pol is well-formed if:
-
Both sublayouts are well-formed and have the same width.
-
The top sublayout is down-connectable on each side, and has direction dir.
-
The bottom sublayout is up-connectable on each side, and has direction dir iff pol is +.
-
-
In addition to all the above, a top-level (i.e. outermost) layout is well-formed if it is neither-connectable on both sides.
2.4 Compilation or “laying out” relation
To lay out a diagram is to compile a diagram d to a layout l such that (i) d and (diagram-of l ) are equivalent, with equivalence as defined at the end of Subsection 2.1, and the function diagram-of as defined below; and (ii) (l ) as defined above.
| (diagram-of (space dir)) | := () |
| (diagram-of (rail dir w)) | := () |
| (diagram-of (station dir label #t)) | := "label" |
| (diagram-of (station dir label #f)) | := [label] |
| (diagram-of (hconcat ltr l1 … ln)) | := ((diagram-of l1) … (diagram-of ln)) |
| (diagram-of (hconcat rtl l1 … ln)) | := ((diagram-of ln) … (diagram-of l1)) |
| (diagram-of (vconcat-inline dir lts rts mk l1 … ln)) | := ((diagram-of l1) … (diagram-of ln)) |
| (diagram-of (vconcat-block dir lts rts pol l1 l2)) | := (pol (diagram-of l1) (diagram-of l2)) |
3 A three-step layout algorithm
In the previous section, we defined the problem of railroad layout. In this section, we describe how we solve it. The space of possible layouts for a diagram is large, with several degrees of freedom at each level of nesting; our solution aims to navigate that space while balancing flexibility, efficiency, and ease of use. In broad strokes, our algorithm has three steps (illustrated in Figure 4 below):
-
1.
Alignment: determining whether the layout of each subdiagram collapses with its container, and if not, determining its vertical positioning; controlled by the align-items policy.
-
2.
Wrapping: deciding how to wrap the sublayouts of each sequence across visual rows to meet a target width. We discuss wrapping parameters in Subsection 3.2.
-
3.
Justification: deciding how to distribute the width available inside a container among and around its sublayouts; controlled by the justify-content policy.
Operationally, each step targets an aspect of the compilation relation from Subsection 2.4. Alignment is about choosing tip specifications and placing spaces such that the layout is well-formed. Wrapping is about choosing a composition of horizontal and inline vertical concatenations for each sequence. Justification is about placing rails (-sequences) to add up to the correct widths. None of these choices affect diagram equivalence as defined at the end of Subsection 2.1.
| id | := | (station dir lbl tm?) |
| | | (dir id…) | |
| | | (vconcat-block dir | |
| pol id id) |
| ad | := | (station dir lbl tm?) |
| | | (dir ts ts ad…) | |
| | | (vconcat-block dir | |
| ts ts pol ad ad) | ||
| | | (space dir) |
| sequence wrap of d | |||
| swd | := | rowd | |
| | | (vconcat-inline dir | ||
| ts ts mk rowd rowd rowd…) | |||
| rowd | := | (hconcat dir d d…) | |
| locally wrapped diagram | |||
| lwd | := | (station dir lbl tm?) | |
| | | (vconcat-block dir | ||
| ts ts pol lwd lwd) | |||
| | | (space dir) | ||
| | | ordered set swlwd… | ||
| global wrap | |||
| gw | := | (station dir lbl tm?) | |
| | | (vconcat-block dir | ||
| ts ts pol gw gw) | |||
| | | (space dir) | ||
| | | swgw | ||
| globally wrapped diagram | |||
| gwd | := | ordered set gw… |
In this section, we build our layout algorithm as a progressive lowering from diagrams to layouts. The first lowering is immediate: per the compilation relation, tokens become stations; stacks become block VCs, although tip specifications are not known yet; and bottom subdiagrams of negative stacks sequences are reversed. Assuming the top-level term is left-to-right, it is easy to compute subterm directions to satisfy the directional conditions of well-formedness. This gives an immediate diagram as in Figure 15.

3.1 Alignment and justification à la flexbox
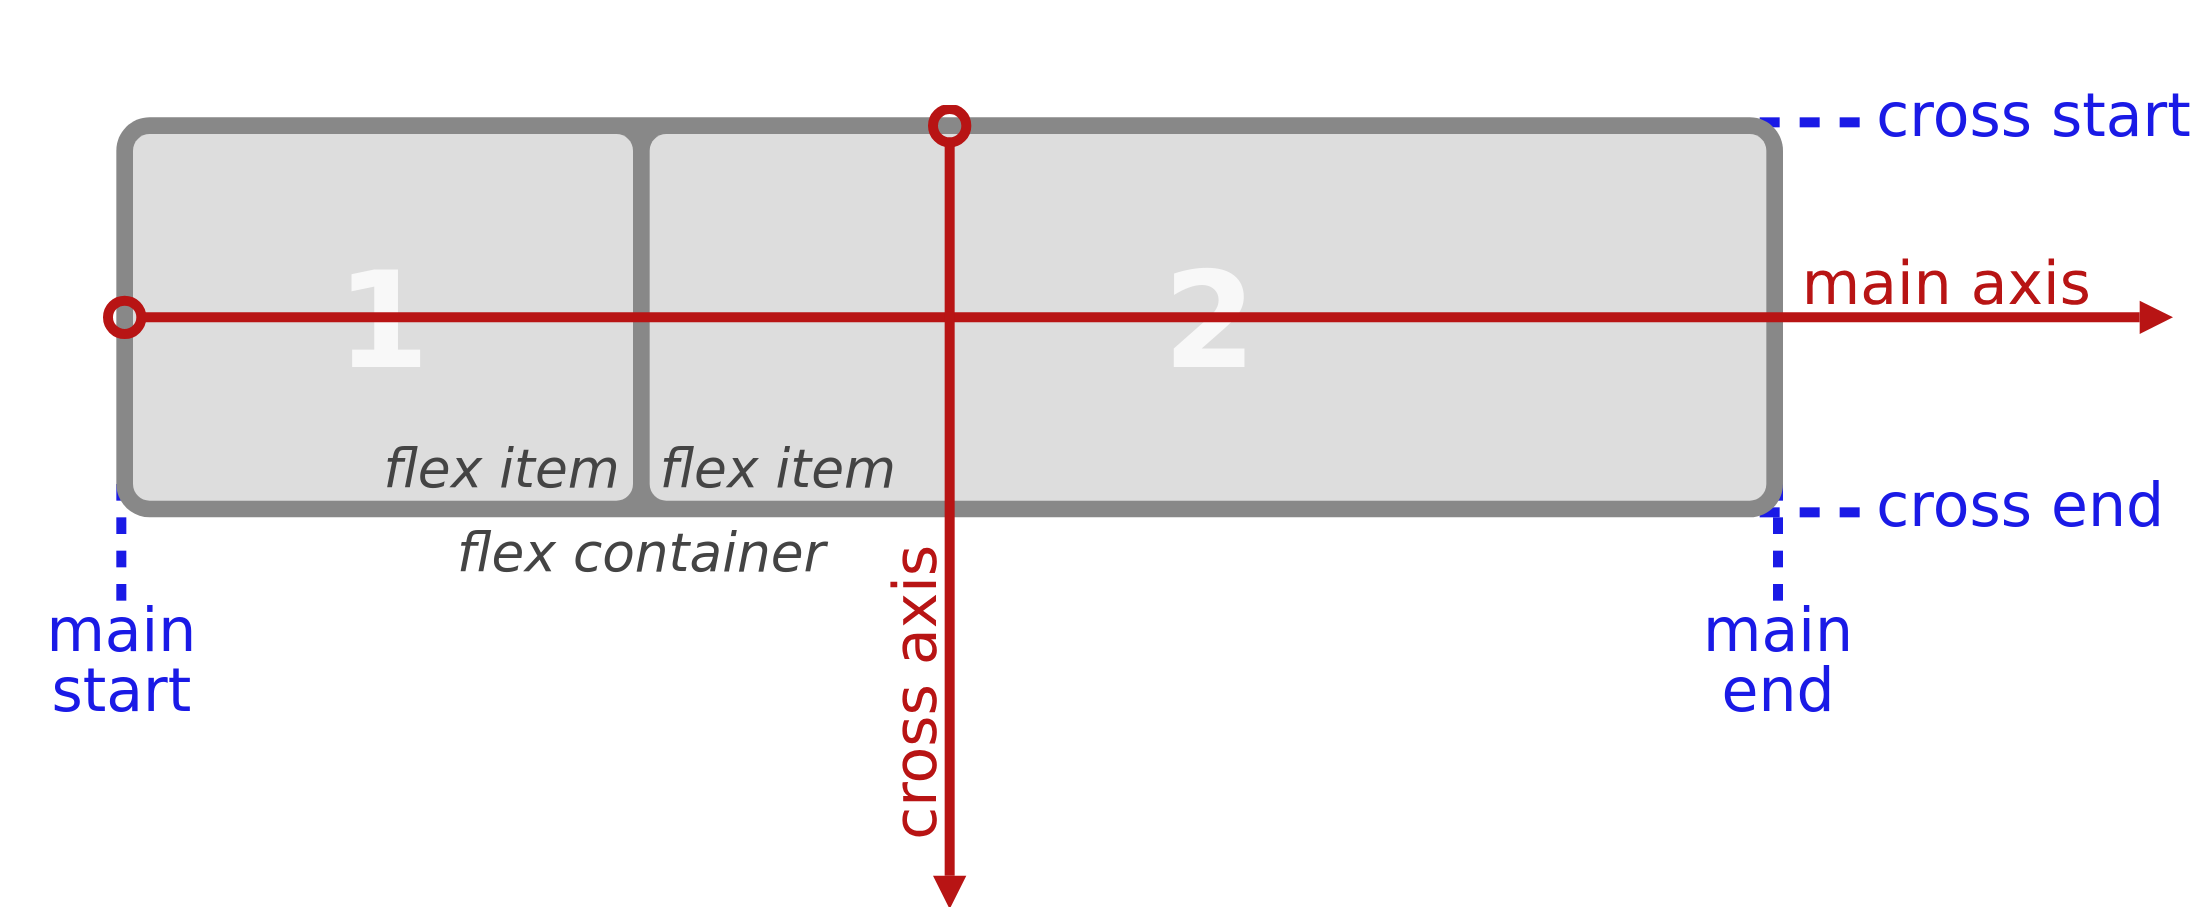
Layouts of linear content often have a main axis aligned with the inherent linear order and an orthogonal cross axis, each with a natural start and end side.333Although we explain our terminology without further citation below, it is heavily inspired by the CSS Flexible Box Layout Module [92], or flexbox for short. We discuss key differences in Section 5. E.g., the main axis of English text is left-to-right, and the cross axis is top-to-bottom (18(a)); the main axis of a vinyl is circular, and the cross axis is radial. Railroad layouts have a horizontal main axis with a direction per their dir parameter, and a top-to-bottom cross axis. Then, alignment and justification are about the cross- and main-axis positioning of sublayouts, respectively.
Railroad alignment is best described in terms of the tips of each layout on each side, rather than the positions of their bounding boxes. For example, the sublayouts of sequences in 18(b) cannot be explained as top-, center-, or bottom-aligned with respect to their bounding boxes. It is simpler to say that each is laid out with a default choice of logical tips, and the containing layouts are formed by positioning the sublayouts so as to align the tips. An alignment policy, then, specifies for any diagram which tips its subdiagrams are to be laid out with under which circumstances. Alignment accounts for collapsing: a subdiagram contained in a stack may be laid out with a vertical tip to collapse with its container. 18(c) illustrates the alignment policies we suggest. “Baseline” captures common patterns beyond the three simpler positional ones, such as choosing logical 2 tips for a stack whose top subdiagram is an empty sequence and bottom has only one row. It also demonstrates that the left and right tips of a layout need not be at the same height.
Thus, alignment lowers an immediate diagram to an aligned diagram as presented in Figure 16, where each sequence and stack has tip specifications for its eventual layout, and spaces are explicit. To ensure well-formedness, our compiler: (i) specifies vertical tips and inserts spaces to make the sublayouts of block VCs correctly connectable (WFbvc), as the recursive definitions of connectability have only spaces as their positive base case; (ii) avoids their negative base cases by conservatively never specifying vertical tips for negative block VCs;444Creators sometimes prefer negative block VCs to not collapse even when possible, such as in Figure 3. and (iii) avoids inserting spaces in the middle of a sequence (WFhc, WFivc) or at the ends of an outermost sequence ().
Next, wrapping turns each sequence into a set of possible compositions of horizontal and inline vertical concatenations (wraps) and orders them by preference. We describe this process in detail in the next section but assume its result, viz. Figure 17, to explain justification below. In particular, we assume the min-content and max-content widths are defined for each term: the minimum width of its eventual layout if, respectively, all wrapping opportunities are taken, or none are.
The last step of lowering to the layout language is justification. It chooses one of the possible wraps and distributes extra width around and among items in each (wrapped) row, aiming to ensure three properties at each level of nesting, explained in Figure 19. The policies for distributing width around items (if any) are illustrated in 18(d). This process satisfies width-related well-formedness criteria by creating horizontal concatenations and rails while preserving diagram equivalence.
Our compiler implements justification as a recursive algorithm on wrapped diagrams with an additional target-width argument. The top-level target-width the user requests must be at least the min-content of the top-level diagram to ensure that some layout is possible. Then:
-
For stations and spaces, the algorithm does nothing, as they are inflexible.
-
For each vertical concatenation, the algorithm (i) subtracts the fixed widths associated with tips and markers from target-width; (ii) ensures that each subdiagram is a horizontal concatenation (potentially by constructing one); and finally (iii) recurses on each (horizontal concatenation) subdiagram with the (updated) target-width.
-
For each ordered set of wraps, the algorithm selects the first (i.e. most preferred) wrap whose min-content is no greater than target-width (i.e. which is guaranteed to fit).
| (i) | All subdiagrams must have at least their min-content widths (, in the illustration) and at least a gap-width (a global parameter) rail between them. | |
| (ii) | As the available width grows, all subdiagrams should grow to their max-content widths (, ) at equal rates.555In (ii), “at equal rates” means in proportion to the difference between the max- and min-content of each subdiagram. In (iii), it means in proportion to the max-content. In theory, different proportions could be used (e.g. nonlinear), but in practice, the difference is barely noticeable (a few pixels at most). | |
| (iii) | Only after all have reached their max-content widths should any extra width () be used, in part for spacing (, where fa is a global parameter flex-absorb) and in part for letting subdiagrams grow further at equal rates, if they can. |
For each horizontal concatenation, the algorithm is more involved:
-
1.
Let aw and rw be variables representing the absorbed and remaining width to be distributed around and among sublayouts, respectively. Let swi be variables representing the subwidths assigned to each subdiagram di, for 1 i n.
-
a.
Initialize aw to (minimum spacing).
-
b.
Initialize each swi to di.min-content (minimum widths).
-
c.
Initialize rw to .
We will maintain the invariant . By the end, .
-
a.
-
2.
Let the growth width . Let the maximum growth width . Increment each swi by , and decrement rw by mg.
-
3.
Increment aw by , and decrement rw by the same amount.
-
4.
Let dj, etc. denote only those subdiagrams that are concatenations (and hence can grow further). If there are none, increment aw by rw and set rw to zero. Else, increment each swj by and set rw to zero.
-
5.
Distribute aw among rails between and around subdiagrams per justify-content, gap, and the current direction. Recursively justify each subdiagram with target width swi. Return a new horizontal concatenation with said justified subdiagrams and rails.
We make three remarks about the relationship between alignment and justification. First, alignment applies to each sublayout of a container individually, whereas justification only makes sense as a collective property of all the sublayouts taken together, so the former policy is called align-items and the latter justify-content. Second, if a sequence wraps across multiple rows, alignment and justification apply to each row independently, although policies may specify different behaviors for the first, middle, and last rows. And third, alignment actually depends on the justification policy, because the side of a stack can collapse with its container only if the two are guaranteed to be directly adjacent, without the possibility of any rails in between (e.g. Figure 20). Now, justification must happen after wrapping because it works on each wrapped row, and wrapping must happen after alignment because it depends on widths, which depend on tip specifications; but the dependency is not circular, because alignment only depends on the justification policy, and not its realization.
The net result of the lowering is thus a well-formed layout, equivalent to the original diagram, that has width exactly target-width, with alignment and justification per the align-items, justify-content, flex-absorb, and gap global parameters.
3.2 Wrapping as optimization
Many layout problems are stated in terms of hard constraints and softer optimization objectives. 1-dimensional problems like text wrapping and code pretty-printing treat layout width as a hard constraint, while trying to minimize properties like height,666This seems obvious but bears further thought. It is the main axis that has a hard constraint, and the cross axis that is subject to minimization. Layouts with different reading orders behave accordingly: for instance, traditional Chinese calligraphy was laid out on horizontal scrolls, with a top-to-bottom main axis (limited by paper height) and a right-to-left cross axis (e.g. [33]). 1-dimensional layouts are informally often measured along the cross axis – books in pages, code in lines, scrolls in inches – implicitly assuming the layout makes good use of a reasonable main-axis size. deviance from normative spacing, and drastic variation between lines [56, 74]. In contrast, the constraints and objectives for 2-dimensional layout problems are typically isotropic properties, unlike size. For instance, among Graphviz’s 8 graph layout algorithms, 5 do not favor any axis over another; 1 (“circo”) distinguishes radial and circular axes, but minimizes edge crossings (independent of direction); and 2 (“dot” and “twopi”) are explicitly hierarchical layouts that impose a 1-dimensional structure of discrete “ranks” or “levels”) on the graph [35].
| SW1 | |
|---|---|
| WD1 | |
| SW2 | |
| WD2 |
Railroad layouts, being 1.5-dimensional, fall somewhere in between. Like 1-dimensional layouts, they follow a reading order and are wrapped in practice, so we treat target width as a hard constraint (and in fact, an exact one, as railroad layouts stretch more and suffer less from sparse rows than text or code). But Figure 22 illustrates how the usual parameters of 1-dimensional layout – width, height, and balance – cannot explain the additional “.5 dimension” of railroad layout decisions. Informally, layouts with less and shallower wrapping are preferred, while trying to make good use of available space.
One of our key contributions is to identify that encoding these preferences as optimization for just the wrapping step is sufficient for practical purposes, instead of phrasing the whole railroad layout problem as optimization. This helps us avoid the instability typical of optimization-based 2-dimensional layouts and develop heuristics for local wrapping (of every sequence) in addition to global wrapping (of the whole diagram). In computational terms, we express the result of wrapping as a total order over possible wraps, i.e. compositions of horizontal and inline vertical concatenations for each sequence, either per sequence (“local”) or for all sequences in the diagram at once (“global”). This results in a locally or globally wrapped diagram as in Figure 17. Standard techniques can then find the optimal (per the total order) wrap subject to a target width constraint.777Technically, a total order is stronger than we need: an order in which any subset of wraps bounded by width has a least element would be sufficient. However, we have not found the distinction to matter.
Next, rather than try to define a single total order to cater to all styles and use cases, we describe a few principled optimality parameters that explain wrapping decisions we observed in the wild. We begin with three preliminary definitions: the wrap specification for a sequence, the min-content and max-content widths of a wrapped diagram, and the height of a globally wrapped diagram.
A wrap specification encodes a composition of horizontal and inline vertical concatenations for a sequence as a set of positive integer wrap points, each specifying the index of the first subdiagram on a row (and hence each no less than 1 and no greater than the number of subdiagrams). Naturally, 1 must be a wrap point; the wrap specification {1} means there is only one row, i.e. a horizontal concatenation, and other specifications signify an inline VC containing horizontal concatenations.888Although it would be valid to nest inline VCs further, our encoding cannot express it, because we have not found it useful in practice and it can be achieved with nested sequences anyway. For example, for the sequence d1, d2, d3, d4, the wrap specification {1, 4} means d1, d2, and d3 are on the first row, and d4 is on the second.
The min- or max-content width of a wrapped diagram is the minimum width of its eventual layout if, respectively, all wrap points are taken, or none are.
-
For stations and spaces, both are equal to the layout width as defined in Subsection 2.2.
-
For a horizontal concatenation, min-content is computed just like the layout width, except using the min-contents of its subdiagrams instead of their layout widths, and accounting for the minimum gap between subdiagrams; and likewise for max-content.
-
For a vertical concatenation, min-content is computed just like the layout width, except using the maximum min-content among its subdiagrams instead of the layout width of the first sublayout; and likewise for max-content.
-
For a set of wrapped diagrams, min-content is the minimum value of min-content, and max-content is the max-content of the element in which all wrap specifications are {1}.
Note that we are not actually performing layout to compute these properties, but just using the same formulae. Note also that a globally wrapped diagram is a set of global wraps, but global wraps contain no sets themselves (see Figure 17). Hence, min- and max-content coincide for a global wrap and are equal to its layout width, which we will call just the content width, because their formulae only differ when there is a set of possibilities.
Lastly, the height of a global wrap is straightforward to compute. Stations have implementation-dependent heights; the height of a vertical concatenation is the sum of the heights of its subdiagrams, plus any space between rows; and the height of a horizontal concatenation can be computed by vertically aligning the internal tips of its subdiagrams to form a “baseline”, and taking the difference between the largest extent above and below that baseline of any subdiagram.
We can now explain the wrapping decisions we observed in manual layouts as finding an optimal global wrap with the objectives below. means gw1 is preferable to gw2.
- Greater content width.
-
In other words, we prefer layouts that use more of the available width. All else being equal, implies .
- Less and shallower wrapping.
-
Let the depth of each term t in a global wrap be defined as zero for the top-level term and one greater than the containing term for each subterm. Let be the length of the wrap specification if t is a sequence wrap, else zero. Let be a real-valued depth penalty function and a real-valued wrap-length penalty function. Then, the wrap penalty is . We need and to be monotonic and positive. All else being equal, implies .
- Lower height.
-
All else being equal, implies .
The last three criteria are phrased in terms of “all else being equal” assumptions. Two practical ways to satisfy them all at once are (i) to make a lexicographic order, defining a priority order among the three, or (ii) to make a numerical order on a linear combination of content width, wrap penalty, and height, where the first has a negative weight and the other two have positive weights. Either option makes a total order.
Of course, it is impractical to enumerate all global wraps to choose one: a diagram with sequences of subdiagrams each has possible wraps. This motivates our locally wrapped diagrams, for which a recursive layout process can alternate between justification and choosing a wrap for each sequence, avoiding the combinatorial explosion. Below, we translate the global objectives into reasonable local versions. Recall that min-content and max-content are now distinct, and the unresolved ambiguity in subterms means that we cannot yet compute the height of a diagram.
- Lesser max-content width beyond target width.
-
For global wraps, we prefer greater content widths for using more of the available space, because we know they are no greater than the target width. But for sequence wraps, the max-content width is typically greater than the target width; the smaller the excess, the closer its subdiagrams will be to their “full” max-contents, reducing further nested wrapping. (See Figure 22.)
- Lesser max-content width for multi-row sequences.
-
As the max-content of a multi-row sequence is the maximum of its subdiagrams’, minimizing it leads to more balanced rows and better use of horizontal space, as moving any subdiagram from one row to another would only increase it. (The first row of Figure 22 illustrates this objective.)
- Less and shallower wrapping.
-
As for global wraps.
As before, lexicographic order or numerical order on a linear combination of max-content and the wrap penalty are practical choices. (min-content seems irrelevant to the order. It roughly scales with the width of the widest or most deeply nested station in a diagram, not with any holistic property. Moreover, in our experiments, we have not yet found a case in which min-content distinguishes between two otherwise equal sequence wraps.)
3.3 Implementation
We implemented a prototype of the algorithm above in Scala (compiled with Scala.js). It is available at github.com/epfl-systemf/librrd. As a summary, the parameters to layout are:
-
the target width (and whether it should be achieved by global or local wrapping);
-
align-items, the policy for vertical alignment of sublayouts;
-
justify-content, the policy for horizontal justification of sublayouts;
-
flex-absorb, the proportion of any extra width a horizontal concatenation uses for justification before passing the rest on to its sublayouts; and
-
the minimum gap between sublayouts of a horizontal concatenation.
Layouts are rendered to SVG with classes and hierarchical structure amenable to further CSS styling. Our implementation is 1141 SLOC (excluding empty lines and comments), plus 314 SLOC for rendering. A web UI is available at systemf.epfl.ch/etc/librrd/. It implements an order over sequence wraps (local wrapping) that we have found to work well in practice, which first minimizes with wrap-length penalty and depth penalty , and then minimizes max-content.
4 Evaluation
We started Section 2 by defining a language to express railroad diagrams, and by the end of Section 3, we had a principled algorithm to produce layouts ready for rendering. In this section, we evaluate whether both ends of this pipeline are practical. For the front end, we show that our diagram language is well-suited for common applications, viz. illustrating formal grammars, by describing how regular expressions and Backus-Naur form can be compiled to it (Subsection 4.1). For the back end, we argue that our compiler is practical by comparing its output to diagrams laid out by hand (Subsection 4.2) and by other tools (Subsection 4.3). We also show that our compiler is performant enough for interactive use (Subsection 4.4).
4.1 Regular expression and Backus-Naur frontends
A recursive translation from nonempty regular expressions to our diagram language is given in 23(a). (It is identical to the construction in [40].) An empty regular expression (i.e. 0, the empty language) cannot be drawn; to draw an arbitrary regular expression, 0s must first be eliminated using standard equivalences like .
For a grammar specified in Backus-Naur form (BNF), the right-hand side of each rule is translated to a railroad diagram. A rule can refer to another of name a with the syntax <a>, represented as a nonterminal token [a]. The rest of the translation is also in 23(a).
Although technically sufficient, the treatment of iteration/recursion in both translations above is a little unsatisfying. Consider the definition of JSON list syntax as a regular expression and in BNF in 23(b), and the translation to railroad diagrams, assuming a list item is separately defined. In the regular expression diagram, we may prefer item to appear only once, as the top of the negative stack; similarly, we may prefer to make the recursion explicit in the BNF diagram as a negative stack. But we may prefer this transformation not to happen if there are several kinds of lists, and it just happens to be the case in the one depicted above that the first item is of the same kind as the rest. We cannot accommodate such preferences merely by adding rules to our translation table. Rather, seen as a notation for syntax diagrams, both regular expressions and BNF have a conflict between canonicity – objects are equivalent iff their representations are equal – and idiomaticity – the ability to conveniently express common representation idioms, like negative stacks for recursion. (This terminology was introduced by [21].)
Our diagram language, together with our approach to its compilation, is idiomatic, as it is specifically designed to express railroad diagrams under common constraints. However, it is not canonical: nested positive stacks can be reassociated without affecting the rendering, and the diagram (- (- D1 D2) D3) can seemingly be rewritten to (- D1 (+ D2 D3)). The deeper problem is that railroad diagrams do not yet enjoy the solid theoretical foundations of other syntax notations, from either the theory of computation or graph automata, that would let us reason more precisely about rewriting, canonicity, and semantics in general.
4.2 Manual layout in the wild
Figure 5 showed a few examples of diagrams outside our scope, chosen due to their broad variety of complex layout features, from corpuses that are often considered a reference by other illustrators to emulate. In Figure 24, we show our best approximation of each. It would not make sense to directly compare rendering properties like width and height, because they depend as much on stylistic choices like fonts and spacing as on layout. Neither would it make sense to compare wrap penalties, because we cannot infer the penalty functions implicitly expressed in those diagrams. We can only argue that our layouts are comparably compact and readable with the additional merit of being automatically laid out. Meanwhile, it is worth noting that the diagrams in Figure 5 (except 5(d)) were laid out by hand to document very widely used syntaxes: Apple Pascal, JSON, and SQLite. High-impact settings may motivate creators to invest in custom manual layout even when automated tools are available.
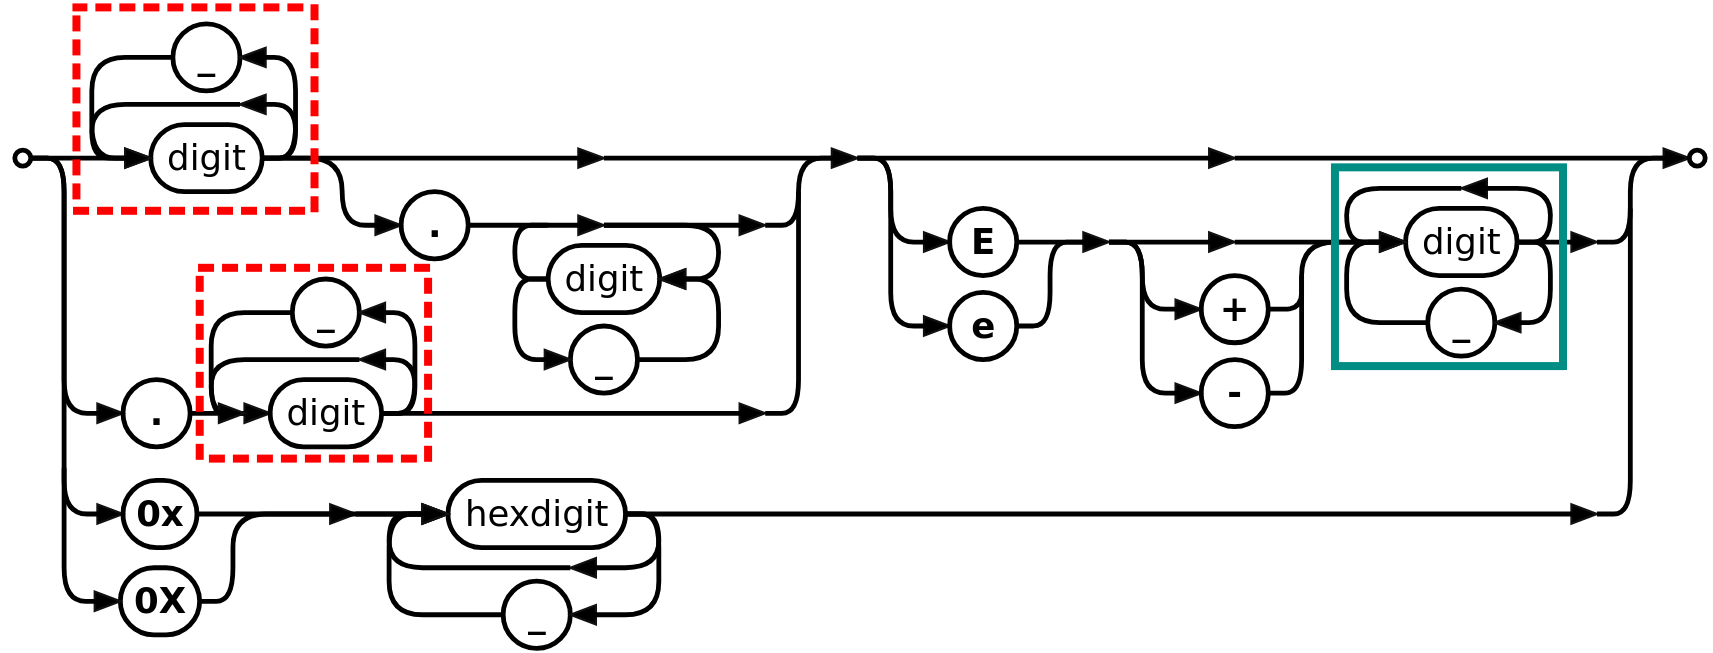
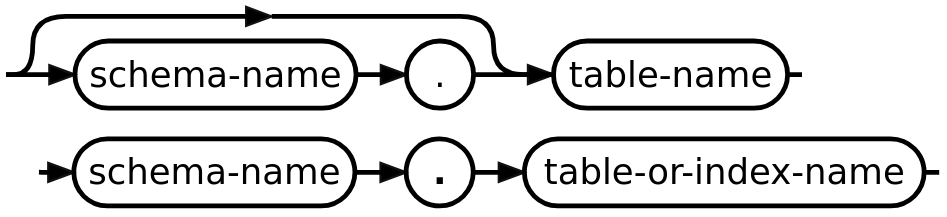
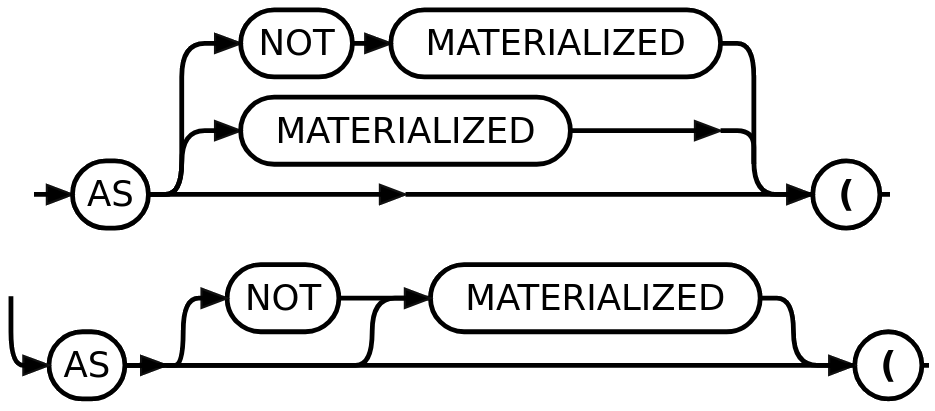
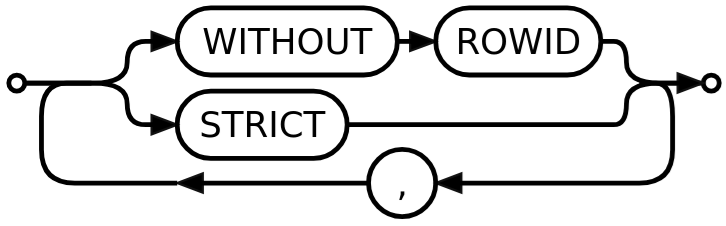
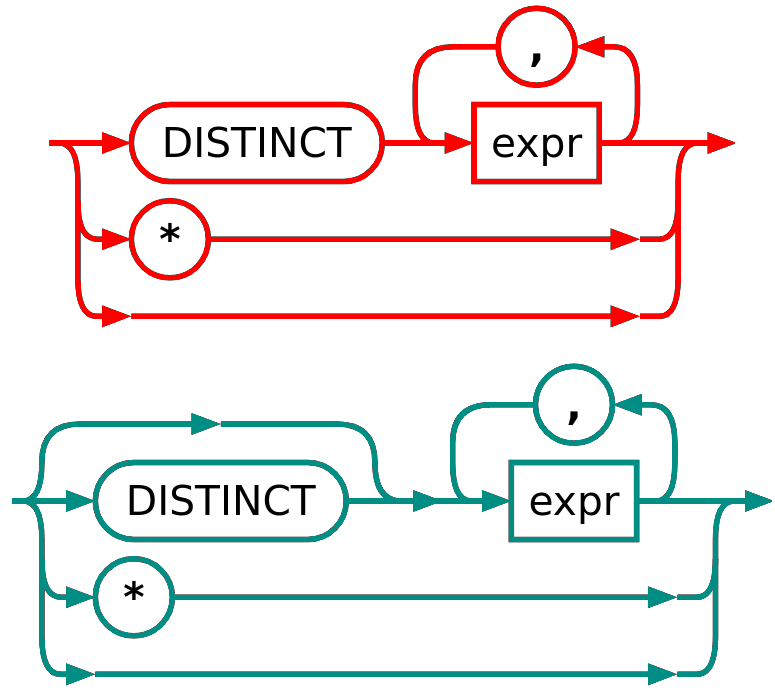
SQLite has made a particular effort to maintain high-quality railroad diagrams documenting its complete input syntax over many years, which makes for an instructive case study. A brief history (from check-ins 289df32643 and 9f5383c824): the diagrams were first introduced in 2008, using Tcl scripts to render from a railroad layout DSL. In 2020, striving for “additional flexibility in the formatting of syntax diagrams [to make them] easier to read and understand [and] maintain”, the project moved to directly specifying renderings in Pikchr, a modernized implementation of the PIC graphics language [71, 51]. The manual renderings indeed have many features the automatic ones did not: custom alignment and justification, more wrapping and collapsing, etc. But, being hand-written, they sometimes introduced stylistic inconsistencies (e.g. Figure 25, 26(a)). Nevertheless, in this tricky tradeoff between manual layout and manual rendering, the creators evidently chose the latter.
Our approach is an appealing third option in such a tradeoff space. Not only would it recover the benefits of automatic rendering for stylistic consistency, but it would also guarantee layout consistency, going beyond both manual layout and manual rendering. For instance, our notion of alignment would avoid the inconsistencies in Figure 25, 26(b), and 26(c) in current SQLite documentation. (We have reported the issues and submitted a patch fixing them.) Moreover, the translations presented in Subsection 4.1 open up the possibility of generating documentation diagrams for a language from the same standard syntax notation its parser uses, avoiding issues like in 26(d). These benefits would come at only a small cost: out of SQLite’s 71 syntax diagrams,
-
46 can be expressed in our layout language, of which 41 perfectly and 5 differing only in permitted collapsing;
-
20 are ill-nested layouts that can still be expressed in our diagram language and compiled to comparable layouts; and
-
5 are ill-nested diagrams that would have to be rewritten to equivalent well-nested ones.
One of the 20 from the second category above is shown in Table 1, along with its specification in the pre-2020 SQLite DSL, our diagram language, and Pikchr. (Its pre-2020 layout was perfectly expressible in our layout language but its modern one is not, due to a vertical semantic .) On one hand, the rendering from our prototype compiler is not significantly less readable or compact, and it corresponds to just one of many possible configurations for wrapping, alignment, and justification. On the other, our specification is the same size as the pre-2020 manual layout, and simpler, as it does not use layout-specific constructors like stack (for wrapping) or optx (for alignment), instead leaving those decisions to the compiler. To be clear, we do not aim to cast our prototype as a surefire replacement for SQLite’s current diagrams, but rather as a reasonable alternative in contexts with similar demands for consistency, flexibility, and maintainability.
| Diagram | # of constructors | Mean layout time (ms) | Std. dev. (ms) |
|---|---|---|---|
| JSON list (24(b)) | 13 | 46.9 | 2.2 |
| SQLite table-constraint (24(c)) | 34 | 54.4 | 1.8 |
| SQLite create-table-stmt (Table 1) | 38 | 54.1 | 1.0 |
| SQLite insert-stmt (Figure 28) | 74 | 67.6 | 2.8 |
| Oracle SQL CREATE TABLE | 94 | 133.5 | 8.7 |
| SQLite select | 96 | 75.0 | 1.8 |
| Oracle SQL ALTER INDEX | 101 | 72.2 | 1.9 |
| SQLite expr | 180 | 85.2 | 10.5 |
4.3 Automatic layout in the wild
Existing railroad diagram tools fall into two broad categories: rendering tools that render layout descriptions, and grammar translation tools that turn grammar notations into renderings. We describe the capabilities and limitations of a few representatives of each. In comparison, we argue that our system fills a niche in between, and can expand the capabilities of both.
Rendering tools define DSLs for specifying railroad layouts and compile these specifications to various backends. [88] cites the pre-2020 SQLite DSL as inspiration, and offers similar primitives for manual wrapping, manual alignment, etc. The design of the following tools is largely similar: [62, 5, 36, 24, 85, 41]. One that stands out is [4], for two reasons: (i) its layout DSL is considerably larger, with rare and complex constructs such as 5(d); and (ii) it enables a greater range of custom styling by letting users tag layout components to style their output SVG counterparts with CSS. These features, along with the quality of its renderings and its parallel implementations in two popular languages (Python and JavaScript), may explain why several other tools build upon it (e.g. [61, 58, 60, 29, 19]). [1], an in-progress work, tries to use CSS not just for styling but also for rendering, with an XML-like layout language directly embedded in a webpage. Lastly, [55, 70, 8, 98] have a more limited range of output but work within the constraints of the LaTeX and TikZ/PGF environments.
Grammar translation tools take descriptions of grammars instead of layouts as input. [6] renders from JavaScript-style regular expressions, [77] from EBNF, and [3] (e.g. 1(d)) from a syntax representation fragment of the XML-based DITA markup language [31]. In all grammar translators, the conflict between canonicity and idiomaticity that we described in Subsection 4.1 is evident. For example, [77] implements additional translation rules to better handle recursion, as well as some inlining of nonterminals and factoring of common subexpressions, but these are coarse-grained settings that affect all rules in a grammar (see Figure 27). [6] supports a variety of regex constructs, like ranged quantifiers, but does not produce nonempty loops at all. Many other tools run into the same conflict – [26, 52, 44, 28, 89, 76, 90, 34, 47, 16, 81] – and some choose to introduce layout-specific annotations (e.g., to explicitly notate loops) into their otherwise grammar-focused notations, while others have a fixed translation outside the user’s control. [90] is unique in letting users click to expand and collapse nonterminals inline, making it the only tool we have seen that uses a dynamic rendering format.
We found only four existing tools that perform automatic wrapping of any kind. [3] and [77] use a greedy algorithm, and [98] coöpts TeX’s line-breaking; none perform internal or nested wrapping or have any user-facing parameters besides the target width, as illustrated in Figure 27. [16] takes a different approach, with an algorithm for “compressing” diagrams translated from BNF by inlining or abstracting grammar rules in a diagram according to the available line width.
Three previous attempts at formalizing railroad layout have had varying results. The first, [39], proposed to address perceived flaws in conventional diagrams with an alternative “structured” diagrammatic notation, which seems to not have caught on. The second, [81], framed the layout problem as compilation from EBNF to a custom rendering language, all declaratively specified in Prolog. Despite the limitations of graphical environments of its time, the formal treatment quickly surfaces many finer properties of railroad layout such as nested wrapping and alignment, which we study in the present work. More recently, [7] introduced a graph-based formalism for railroad diagrams and a corresponding layout algorithm that combines layered layout with railroad-specific heuristics. However, the resulting layouts do not always look conventional, due to edge crossings, unnatural edge routing, etc.
Our approach starts from a specification of neither a layout nor a grammar, but a diagram, and compiles it to a layout independent of rendering. Grammar notations are intended for describing formal languages, not their visual representations, while previous layout DSLs are tightly coupled with rendering and have no definite notions of diagrammatic equivalence; our diagram language is the missing intermediate representation. The way we characterize the compilation problem lets us implement at least four features that no other tool has:
-
parametric wrapping, either globally or locally;
-
independent alignment of the two sides of a sublayout, e.g. to collapse one or both sides of a stack automatically in valid contexts, such as happens several times in 24(c);
-
direction-aware justification; and
-
wrapping and justification that account for the possible internal wrapping of sublayouts.
We posit that our layouts can easily be rendered with additional backends or features from the rendering tools above, and that our diagram language can be an idiomatic target for grammar translation tools that would let them address canonicity independently of layout.
4.4 Performance
We measured how long our prototype compiler took to lay out a few sample diagrams with the same parameters that produced the layout of each shown in this paper. We also measured a few of the largest diagrams we found in the SQLite and Oracle SQL documentation [59, 82]. For each diagram, we computed the mean and standard deviation over 10 runs, in milliseconds. We measured layout time on a laptop with an i7-1265U processor at 2.7 GHz and 32 GB of memory, running the Scala.js 1.19.0 compiler and the Node.js 20.10.0 runtime under Ubuntu 22.04.5. Table 2 shows the results.
As a point of comparison, we cite Penrose [99], an optimization-based mathematical diagramming tool intended for iterative, exploratory use. Our tool, despite being written with no explicit attention to performance, is well under the 500 ms limit Penrose considers the target for “data visualization, live programming, and other exploratory creative tools”.
5 Related work
In Section 1, we described how railroad layout is a 1.5-dimensional problem falling outside the scope of conventional 1- and 2-dimensional approaches to layout. In this section, we briefly survey those approaches to expand on that idea.
A classic 1-dimensional layout problem is pretty-printing. Starting from [65], a steady stream of research – including [10, 42, 53, 75, 84, 94, 12], and most recently [74] – has explored the space of document specification languages, optimality criteria, algorithmic efficiency, correctness, and programming techniques. Like 1-dimensional pretty-printed code, components of a railroad diagram follow the reading order, wrap, and reflect the nested structure of the source term, but pretty-printers crucially cannot express the branching and remerging of rows that independently follow the reading order, nor the reversed layout in loops.
Some 1-dimensional layouts work with flexible boxes instead of rigid characters and spaces. [56], designed for TeX, uses boxes to line-wrap, justify, and hyphenate a paragraph of text, with a practical heuristic for a global optimization problem; however, it gives no special consideration to nested structure beyond lines, words, and characters. CSS flexbox [92] solves the same problem for arbitrary boxes, possibly with nested layouts, but (unlike our algorithm) does not account for the differing stretchability of boxes during wrapping or justification, and uses a simple greedy wrapping algorithm. Neither TeX nor flexbox supports independent left and right baselines for boxes as is needed for railroad layout.
Graph layout is perhaps the best-studied 2-dimensional layout problem. [86] surveys the research behind powerful widely-used tools like Graphviz [35] and the algorithms in D3 [13]. Railroad diagrams could be seen as labeled directed graphs with stylized 2-dimensional layouts, but are much more rigid and restricted than the conventional presentations. Arbitrary mathematical graphs do not have an inherent reading order like code or text; many layout algorithms, like force-directed layout, are accordingly rotationally symmetric. Some algorithms designed for graphs with additional structure, like trees and DAGs, favor one direction over the other. Graphs that come closest to railroad diagrams are two-terminal series-parallel graphs or SP graphs – graphs that are either just two vertices with an edge, or a series or parallel composition of other series-parallel graphs [14] – and the yWorks graph drawing tool [100] offers a series-parallel layout visually similar to railroad layout, but performs no wrapping. A more fundamental difference, however, is that series-parallel graphs are defined to be either undirected or directed but acyclic [2], whereas railroad layouts specifically have loops, and hence more constraints on collapsing.
Many other 2-dimensional layout problems and tools are further afield from railroad diagrams. A large category is statistical graphs and data-driven visualizations, starting with [96]’s seminal work on statistical graphs, inspiring libraries like ggplot2 [95], Vega and Vega-Lite [38, 79], D3 [13], and Matplotlib [43]. Another category is graphics programming, i.e. languages and tools to specify individual pictures with low-level constructs, like PIC [51], SVG [91], TikZ [87], and Bluefish [73]. Some domain-specific visualization tools provide a higher level of abstraction for narrower domains, like Penrose [99], Mermaid [63], TikZ libraries and frontends like TikZiT [54], and program state visualizations like PythonTutor [37] and DDD [101]. Lastly, frameworks like Lean Widgets [64] and Alectryon [72] enable the use of existing visualization tools in the context of computerized proofs.
Our definition of “1.5-dimensional” layout problems not only reflects their intermediate nature between the 1- and 2-dimensional ones described above, but also aligns with previous uses of the term. [17] lays out sibling nodes in a tree following a left-to-right reading order, while a child node is drawn under its parent. For [80], there is only one top-to-bottom sublayout, while the rest of the graph is laid out freely in 2 dimensions. Neither considers the possibility of wrapping, unlike [78], which treats layered layouts as having a reading order, albeit without nesting. Lastly, the term “1.5-dimensional” is also used in cutting and packing (C&P) problems, but they are fundamentally different from the other layout problems outlined above because items have no structure or relationships that their layout must respect [30]. C&P use of the term is thus most properly seen as coincidental.
6 Conclusion
Railroad diagrams are a common visualization of grammars, but limited tooling and a lack of formal attention to their layout has mostly confined them to hand-drawn documentation. In this paper, we presented the first formal treatment of railroad layout, along with a principled implementation that performs line wrapping to meet a target width, as well as vertical alignment and horizontal justification per user-specified policies. We presented a practical heuristic for the optimization problem of nested line wrapping.
We then showed how our approach to automatic railroad layout has practical value for the programming languages, formal methods, and software engineering community. It can replace existing uses of (manually laid-out) railroad diagrams and enable new ones, including in interactive settings like proof assistants. Both our layout language and our approach to compilation can be extended to accommodate further variation in hand-drawn layouts.
The unique nature of railroad layout as a 1.5-dimensional layout problem suggests a number of directions for future work. On one hand, future work could explore whether railroad layout can subsume pretty-printing, and whether the elegant successes of techniques like program calculation for pretty-printers replicate. On the other, a generalization of series-parallel graphs with reversed parallel composition could model railroad diagrams, and serve as a semantic foundation similar to automata for other grammar notations.
References
- [1] Daniel Abrecht. Railroad CSS, February 2023. URL: https://daniel-abrecht.github.io/railroad-css/.
- [2] Rajeev Alur, Caleb Stanford, and Christopher Watson. A Robust Theory of Series Parallel Graphs. Proceedings of the ACM on Programming Languages, 7(POPL):1058–1088, January 2023. doi:10.1145/3571230.
- [3] Robert D. Anderson and Deborah Pickett. svg-syntaxdiagrams. IBM, October 2019. URL: https://github.com/robander/svg-syntaxdiagrams.
- [4] Tab Atkins, Jr. Railroad-diagram generator, January 2024. URL: https://github.com/tabatkins/railroad-diagrams/.
- [5] atp-mipt. JSyntrax, May 2024. URL: https://github.com/atp-mipt/jsyntrax.
- [6] Jeff Avallone. Regexper, September 2020. URL: https://regexper.com.
- [7] Michael J. Bannister, David A. Brown, and David Eppstein. Confluent Orthogonal Drawings of Syntax Diagrams. In Emilio Di Giacomo and Anna Lubiw, editors, Graph Drawing and Network Visualization, volume 9411 of Lecture Notes in Computer Science, pages 260–271, Cham, 2015. Springer International Publishing. doi:10.1007/978-3-319-27261-0_22.
- [8] Klaus Georg Barthelmann and Luc Rooijakkers. rail, May 1998. URL: https://www.ctan.org/pkg/rail.
- [9] Stoughton Bell and Edgar J. Gilbert. Learning recursion with syntax diagrams. SIGCSE Bulletin, 6(3):44–45, September 1974. doi:10.1145/988881.988890.
- [10] Jean-Philippe Bernardy. A pretty but not greedy printer (functional pearl). Proceedings of the ACM on Programming Languages, 1(ICFP):6:1–6:21, August 2017. doi:10.1145/3110250.
- [11] Richard S. Bird. Transformational programming and the paragraph problem. Science of Computer Programming, 6:159–189, January 1986. doi:10.1016/0167-6423(86)90023-7.
- [12] Richard Bonichon and Pierre Weis. Format unraveled. In Journées Francophones Des Langages Applicatifs: JFLA 2017, Gourette, France, January 2017. URL: https://hal.science/hal-01503081.
- [13] Michael Bostock, Vadim Ogievetsky, and Jeffrey Heer. D3: Data-driven documents. IEEE Transactions on Visualization & Computer Graphics, 17(12):2301–2309, November 2011. doi:10.1109/TVCG.2011.185.
- [14] Andreas Brandstädt, Van Bang Le, and Jeremy P. Spinrad. Algebraic compositions and recursive definitions. In Graph Classes: A Survey, Discrete Mathematics and Applications, pages 167–185. Society for Industrial and Applied Mathematics, Philadelphia, PA, USA, 1999. doi:10.1137/1.9780898719796.ch11.
- [15] Lisa M. Braz. Visual syntax diagrams for programming language statements. SIGDOC Asterisk Journal of Computer Documentation, 14(4):23–27, September 1990. doi:10.1145/97435.97987.
- [16] James Paul Brisson. Methods and system for converting a text-based grammar to a compressed syntax diagram. U.S. Patent 5,678,052 A, assigned to IBM Corporation, October 1997.
- [17] Michael Burch, Michael Raschke, and Daniel Weiskopf. Indented pixel tree plots. In George Bebis, Richard Boyle, Bahram Parvin, Darko Koracin, Ronald Chung, Riad Hammoud, Muhammad Hussain, Tan Kar-Han, Roger Crawfis, Daniel Thalmann, David Kao, and Lisa Avila, editors, Advances in Visual Computing, volume 6453 of Lecture Notes in Computer Science, pages 338–349, Berlin, Heidelberg, 2010. Springer. doi:10.1007/978-3-642-17289-2_33.
- [18] Luyu Cheng and Lionel Parreaux. A simple recipe for writing decent recursive descent parsers (pearl). In 40th European Conference on Object-Oriented Programming (ECOOP 2026), volume 372 of Leibniz International Proceedings in Informatics (LIPIcs), Dagstuhl, Germany, 2026. Schloss Dagstuhl – Leibniz-Zentrum für Informatik. doi:10.4230/LIPIcs.ECOOP.2026.31.
- [19] chevrotain contributors. chevrotain, March 2026. URL: https://github.com/Chevrotain/chevrotain.
- [20] Shardul Chiplunkar and Clément Pit-Claudel. LibRRD. Software, version ecoop2026-artifact. (visited on 2026-05-05). URL: https://github.com/epfl-systemf/librrd/releases/tag/ecoop2026-artifact, doi:10.4230/artifacts.25789.
- [21] Shardul Chiplunkar and Clément Pit-Claudel. Diagrammatic notations for interactive theorem proving. In 4th International Workshop on Human Aspects of Types and Reasoning Assistants (HATRA 2023), October 2023. doi:10.5075/epfl-SYSTEMF-305144.
- [22] Paolo Ciancarini, Angelo Di Iorio, Luca Furini, and Fabio Vitali. High-quality pagination for publishing. Software: Practice and Experience, 42(6):733–751, July 2011. doi:10.1002/spe.1096.
- [23] Douglas Crockford. JSON object syntax, 2001. URL: https://www.json.org/json-en.html.
- [24] Quint Daenen. Railroad, April 2024. URL: https://github.com/0x51-dev/railroad.
- [25] Oege de Moor and Jeremy Gibbons. Bridging the algorithm gap: A linear-time functional program for paragraph formatting. Science of Computer Programming, 35(1):3–27, September 1999. doi:10.1016/S0167-6423(99)00005-2.
- [26] Christopher Deckers. RRDiagram, January 2024. URL: https://github.com/Chrriis/RRDiagram.
- [27] Sabin Devkota. Visualizing Control Flow Graphs. PhD thesis, The University of Arizona, Tucson, Arizona, USA, 2021. URL: https://repository.arizona.edu/handle/10150/661593.
- [28] Markus Dopler and Stefan Schörgenhumer. EBNF visualizer, 2005. URL: http://dotnet.jku.at/applications/Visualizer/.
- [29] Jakub Dundalek. GrammKit, April 2023. URL: https://dundalek.com/GrammKit/.
- [30] Harald Dyckhoff. A typology of cutting and packing problems. European Journal of Operational Research, 44(2):145–159, January 1990. doi:10.1016/0377-2217(90)90350-K.
- [31] Kristen James Eberlein and Robert D. Anderson. Darwin Information Typing Architecture (DITA), June 2018. URL: http://docs.oasis-open.org/dita/dita/v1.3/dita-v1.3-part3-all-inclusive.html.
- [32] Ecma. The JSON Data Interchange Syntax, 2017. URL: https://ecma-international.org/publications-and-standards/standards/ecma-404/.
- [33] Chengsu Feng and Xizhi Wang. Lantingji Xu scroll (Shenlong version). Courtesy user Aoser on Wikimedia Commons, 650. URL: https://commons.wikimedia.org/wiki/File:%E7%A5%9E%E9%BE%8D%E8%98%AD%E4%BA%AD%E5%BA%8F%E5%85%A8.JPG.
- [34] Katherine Flavel. KGT: Kate’s Grammar Tool, April 2025. URL: https://github.com/katef/kgt.
- [35] Emden R. Gansner and Stephen C. North. An open graph visualization system and its applications to software engineering. Software: Practice and Experience, 30(11):1203–1233, August 2000. doi:10.1002/1097-024X(200009)30:11<1203::AID-SPE338>3.0.CO;2-N.
- [36] Matthijs Groen. Utf-railroad, October 2020. URL: https://github.com/matthijsgroen/utf-railroad.
- [37] Philip J. Guo. Online Python Tutor: Embeddable web-based program visualization for CS education. In Proceedings of the 44th ACM Technical Symposium on Computer Science Education, SIGCSE 2013, pages 579–584, New York, NY, USA, March 2013. Association for Computing Machinery. doi:10.1145/2445196.2445368.
- [38] Jeffrey Heer and Michael Bostock. Declarative language design for interactive visualization. IEEE Transactions on Visualization and Computer Graphics, 16(6):1149–1156, November 2010. doi:10.1109/TVCG.2010.144.
- [39] Robert G. Herriot. Structured syntax diagrams. Computer Languages, 2(1):9–19, January 1976. doi:10.1016/0096-0551(76)90009-6.
- [40] Ralf Hinze. Self-certifying railroad diagrams. In Graham Hutton, editor, Mathematics of Program Construction, volume 11825 of Lecture Notes in Computer Science, pages 103–137, Cham, 2019. Springer International Publishing. doi:10.1007/978-3-030-33636-3_5.
- [41] Matthijs Hollemans. Railroad-Diagrams-Swift, May 2019. URL: https://github.com/hollance/Railroad-Diagrams-Swift.
- [42] John Hughes. The design of a pretty-printing library. In Johan Jeuring and Erik Meijer, editors, Advanced Functional Programming, volume 925 of Lecture Notes in Computer Science, pages 53–96, Båstad, Sweden, May 1995. Springer-Verlag. doi:10.1007/3-540-59451-5_3.
- [43] John D. Hunter. Matplotlib: A 2D graphics environment. Computing in Science & Engineering, 9(3):90–95, 2007. doi:10.1109/MCSE.2007.55.
- [44] Julian Hyde. Clapham, May 2009. URL: http://clapham.hydromatic.net/.
- [45] IBM Corporation. IBM MQ 9.4 Reference. Technical report, IBM Corporation, January 2025. URL: https://www.ibm.com/docs/en/ibm-mq/9.4?topic=mq-reference.
- [46] Charles Jacobs, Wilmot Li, Evan Schrier, David Bargeron, and David Salesin. Adaptive grid-based document layout. ACM Transactions on Graphics, 22(3):838–847, July 2003. doi:10.1145/882262.882353.
- [47] Vincent Jacques. DrawGrammar, November 2018. URL: https://jacquev6.github.io/DrawGrammar/.
- [48] Ramesh Johari, Joe Marks, Ali Partovi, and Stuart Shieber. Automatic Yellow-Pages pagination and layout. Journal of Heuristics, 2(4):321–342, March 1997. doi:10.1007/BF00132503.
- [49] Tom Kamifuji and Jef Raskin. Apple Pascal syntax chart. Courtesy Dana Sibera “NanoRaptor”, 1979. URL: http://www.danamania.com/print/Apple%20Pascal%20Poster/PascalPosterV3%20A1.pdf.
- [50] Eric A. Kenninga. Optimal line break determination. U.S. Patent 6,510,441 B1, assigned to Adobe Systems, Inc., January 2003.
- [51] Brian W Kernighan. PIC – A graphics language for typesetting user manual. Technical Report 116, AT&T Bell Laboratories, Murray Hill, NJ 07974, May 1991. URL: https://pikchr.org/home/uv/pic.pdf.
- [52] Stanislav Kirpichenko. VirtDiagramsDSL, 2022. URL: https://github.com/Stasychbr/VirtDiagramsDSL.
- [53] Oleg Kiselyov, Simon Peyton-Jones, and Amr Sabry. Lazy v. Yield: Incremental, linear pretty-printing. In Ranjit Jhala and Atsushi Igarashi, editors, Programming Languages and Systems, Lecture Notes in Computer Science, pages 190–206, Berlin, Heidelberg, 2012. Springer. doi:10.1007/978-3-642-35182-2_14.
- [54] Aleks Kissinger. TikZiT, August 2020. URL: https://tikzit.github.io/.
- [55] Jens Klöcker. syngen, November 1996. URL: https://www.ctan.org/pkg/syngen.
- [56] Donald E. Knuth and Michael F. Plass. Breaking paragraphs into lines. Software: Practice and Experience, 11(11):1119–1184, November 1981. doi:10.1002/spe.4380111102.
- [57] Dexter Kozen. Kleene algebra with tests. ACM Transactions on Programming Languages and Systems, 19(3):427–443, May 1997. doi:10.1145/256167.256195.
- [58] Philip Krauss. RRD-ANTLR4, June 2021. URL: https://github.com/flashpixx/RRD-ANTLR4.
- [59] Usha Krishnamurthy. SQL Language Reference 23ai. Technical Report F47038-21, Oracle Corporation, February 2025. URL: https://docs.oracle.com/en/database/oracle/oracle-database/23/sqlrf/index.html.
- [60] Mike Lischke. VSCode-ANTLR4, August 2024. URL: https://github.com/mike-lischke/vscode-antlr4.
- [61] Rafael Lopez. PyRailroad, October 2024. URL: https://github.com/Epithumia/pyrailroad.
- [62] Lukas Lueg. Railroad, July 2024. URL: https://github.com/lukaslueg/railroad.
- [63] Mermaid contributors. Mermaid | Diagramming and charting tool. URL: https://mermaid.js.org/.
- [64] Wojciech Nawrocki, Edward W Ayers, and Gabriel Ebner. An extensible user interface for Lean 4. In 14th International Conference on Interactive Theorem Proving (ITP 2023), Leibniz International Proceedings in Informatics (LIPIcs), pages 24:1–24:20, Dagstuhl, Germany, 2023. Schloss Dagstuhl – Leibniz-Zentrum für Informatik. doi:10.4230/LIPIcs.ITP.2023.24.
- [65] Derek C. Oppen. Prettyprinting. ACM Transactions on Programming Languages and Systems, 2(4):465–483, October 1980. doi:10.1145/357114.357115.
- [66] Pavel Panchekha, Michael D. Ernst, Zachary Tatlock, and Shoaib Kamil. Modular verification of web page layout. Proceedings of the ACM on Programming Languages, 3(OOPSLA):151:1–151:26, October 2019. doi:10.1145/3360577.
- [67] Pavel Panchekha and Emina Torlak. Automated reasoning for web page layout. In Proceedings of the 2016 ACM SIGPLAN International Conference on Object-Oriented Programming, Systems, Languages, and Applications, OOPSLA 2016, pages 181–194, Amsterdam, Netherlands, October 2016. ACM. doi:10.1145/2983990.2984010.
- [68] Arno J. H. Peels, Norbert J. M. Janssen, and Wop Nawijn. Document architecture and text formatting. ACM Transactions on Information Systems, 3(4):347–369, October 1985. doi:10.1145/4656.4657.
- [69] Robin Piedeleu and Fabio Zanasi. A finite axiomatisation of finite-state automata using string diagrams. Logical Methods in Computer Science, 19(1):13:1–13:38, February 2023. doi:10.46298/lmcs-19(1:13)2023.
- [70] Johannes Pieper, André Hilbig, Johannes Kuhaupt, Daniel Spittank, Ludger Humbert, and Adrian Salamon. syntaxdi, October 2020. URL: https://www.ctan.org/pkg/syntaxdi.
- [71] Pikchr contributors. How Pikchr generates the SQLite syntax diagrams, February 2024. URL: https://pikchr.org/home/doc/trunk/doc/sqlitesyntax.md.
- [72] Clément Pit-Claudel. Untangling mechanized proofs. In Proceedings of the 13th ACM SIGPLAN International Conference on Software Language Engineering, SLE 2020, pages 155–174, Virtual, November 2020. ACM. doi:10.1145/3426425.3426940.
- [73] Josh Pollock, Catherine Mei, Grace Huang, Elliot Evans, Daniel Jackson, and Arvind Satyanarayan. Bluefish: Composing Diagrams with Declarative Relations. In Proceedings of the 37th Annual ACM Symposium on User Interface Software and Technology, pages 1–21, Pittsburgh, PA, USA, October 2024. ACM. doi:10.1145/3654777.3676465.
- [74] Sorawee Porncharoenwase, Justin Pombrio, and Emina Torlak. A pretty expressive printer. Proceedings of the ACM on Programming Languages, 7(OOPSLA2):261:1122–261:1149, October 2023. doi:10.1145/3622837.
- [75] William W. Pugh and Steven J. Sinofsky. A new language-independent prettyprinting algorithm. Technical Report TR 87-808, Cornell University, January 1987. URL: https://www.cs.tufts.edu/˜nr/cs257/archive/steven-sinofsky/prettyprinting-87-808.pdf.
- [76] Larry D. Pyeatt. Ebnf2tikz, December 2023. URL: https://github.com/pyeatt/ebnf2tikz/.
- [77] Gunther Rademacher. rr, February 2025. URL: https://github.com/GuntherRademacher/rr/.
- [78] Ulf Rüegg and Reinhard von Hanxleden. Wrapping layered graphs. In Peter Chapman, Gem Stapleton, Amirouche Moktefi, Sarah Perez-Kriz, and Francesco Bellucci, editors, Diagrammatic Representation and Inference, volume 10871 of Lecture Notes in Computer Science, pages 743–747, Cham, June 2018. Springer International Publishing. doi:10.1007/978-3-319-91376-6_72.
- [79] Arvind Satyanarayan, Dominik Moritz, Kanit Wongsuphasawat, and Jeffrey Heer. Vega-Lite: A grammar of interactive graphics. IEEE Transactions on Visualization and Computer Graphics, 23(1):341–350, January 2017. doi:10.1109/TVCG.2016.2599030.
- [80] Lei Shi, Chen Wang, Zhen Wen, Huamin Qu, Chuang Lin, and Qi Liao. 1.5D egocentric dynamic network visualization. IEEE Transactions on Visualization and Computer Graphics, 21(5):624–637, May 2015. doi:10.1109/TVCG.2014.2383380.
- [81] Robin M. Snyder. Specifying textual to graphical conversion. Journal of Systems and Software, 16(1):17–28, September 1991. doi:10.1016/0164-1212(91)90028-5.
- [82] SQLite contributors. Syntax diagrams for SQLite, 2024. URL: https://www.sqlite.org/syntaxdiagrams.html.
- [83] Guy Lewis Steele, Jr. It’s time for a new old language, April 2017. URL: https://groups.csail.mit.edu/mac/users/gjs/6.945/readings/Steele-MIT-April-2017.pdf.
- [84] S. Doaitse Swierstra and Olaf Chitil. Linear, bounded, functional pretty-printing. Journal of Functional Programming, 19(1):1–16, January 2009. doi:10.1017/S0956796808006990.
- [85] Yudai Takada. Railroad diagrams, February 2025. URL: https://github.com/ydah/railroad_diagrams.
- [86] Roberto Tamassia, editor. Handbook of Graph Drawing and Visualization. Chapman & Hall/CRC, New York, NY, USA, 1st edition, 2013. URL: https://cs.brown.edu/people/rtamassi/gdhandbook/.
- [87] Till Tantau. The TikZ and PGF Packages, May 2023. URL: www.ctan.org/pkg/pgf.
- [88] Kevin Thibedeau. Syntrax, February 2019. URL: https://github.com/kevinpt/syntrax.
- [89] Peter Thiemann. Ebnf2ps: Peter’s syntax diagram drawing tool, June 2010. URL: http://www2.informatik.uni-freiburg.de/˜thiemann/haskell/ebnf2ps/.
- [90] Alexander Voglsperger. EBNF railroad visualizer, December 2024. URL: https://github.com/MrMinemeet/ebnf_railroad_visualizer.
- [91] W3C. Scalable Vector Graphics (SVG) 1.1 (Second Edition), August 2011. URL: https://www.w3.org/TR/SVG11/.
- [92] W3C. CSS Flexible Box Layout Module Level 1. Candidate Recommendation, W3C, November 2018. URL: https://www.w3.org/TR/css-flexbox-1/.
- [93] W3C. CSS Box Alignment Module Level 3. Working Draft, W3C, March 2025. URL: https://www.w3.org/TR/css-align-3/.
- [94] Philip Wadler. A prettier printer. In Jeremy Gibbons and Oege de Moor, editors, The Fun of Programming, pages 223–243. Macmillan Education UK, London, 2003. doi:10.1007/978-1-349-91518-7_11.
- [95] Hadley Wickham. ggplot2: Elegant Graphics for Data Analysis. Springer-Verlag, New York, NY, USA, 2016. URL: https://ggplot2.tidyverse.org.
- [96] Leland Wilkinson. The Grammar of Graphics. Statistics and Computing. Springer-Verlag, New York, NY, USA, 2nd edition, 2005. doi:10.1007/0-387-28695-0.
- [97] Niklaus Wirth. The programming language Pascal. Report, ETH Zürich, Zürich, Switzerland, 1970. doi:10.3929/ethz-a-004150844.
- [98] Mark Wooding. syntax-mdw, May 1996. URL: https://ctan.org/pkg/syntax-mdw.
- [99] Katherine Ye, Wode Ni, Max Krieger, Dor Ma’ayan, Jenna Wise, Jonathan Aldrich, Joshua Sunshine, and Keenan Crane. Penrose: From mathematical notation to beautiful diagrams. ACM Transactions on Graphics, 39(4), August 2020. doi:10.1145/3386569.3392375.
- [100] yWorks. yFiles for HTML. yWorks, February 2025. URL: https://www.yworks.com/yfiles-overview.
- [101] Andreas Zeller and Dorothea Lütkehaus. DDD—a free graphical front-end for UNIX debuggers. ACM SIGPLAN Notices, 31(1):22–27, January 1996. doi:10.1145/249094.249108.
