Remote Concolic Multiverse Debugging

Abstract
Debugging nondeterministic programs is inherently difficult, particularly in microcontroller environments where execution paths can diverge unpredictably due to external sensor inputs. Traditional debugging techniques often fail to capture or reproduce this nondeterministic behavior effectively. Multiverse debugging has emerged as a compelling technique to debug nondeterministic programs, allowing developers to systematically explore all possible execution paths. Unfortunately, current multiverse debuggers are snapshot-based and most operate over a model of the program, which limits their use for debugging resource-constrained microcontrollers. Additionally, current multiverse debuggers, even ones specifically designed for microcontrollers suffer from state explosion making the state space overwhelming during debugging.
To address these challenges, we introduce a trace-based multiverse debugger with a novel state-space reduction technique based on concolic execution. Our approach interleaves concolic analysis with live debugging to identify input values that define unique program paths. This hybrid technique efficiently prunes redundant paths from the state space while ensuring full code coverage. Unlike MIO, a recently published multiverse debugger for microcontrollers that focuses on IO consistency, our approach directly targets state explosion by leveraging concolic execution and uses a trace-based approach, significantly reducing the memory and communication overhead.
We implemented a prototype using the WARDuino WebAssembly virtual machine on an STM32 microcontroller, demonstrating the feasibility and efficiency of our approach in real-world scenarios. Our results highlight substantial reductions in the state space compared to traditional multiverse debugging. This makes multiverse debugging more accessible and efficient for developers working with complex, nondeterministic programs running on microcontrollers.
Keywords and phrases:
Multiverse Debugging, Embedded devices, WebAssemblyFunding:
Maarten Steevens: Funded by the Research Foundation Flanders, grant number 1SA6C26N.Copyright and License:
![[Uncaptioned image]](x1.png) © Maarten Steevens, Tom Lauwaerts, and Christophe Scholliers; licensed under Creative Commons License CC-BY 4.0
© Maarten Steevens, Tom Lauwaerts, and Christophe Scholliers; licensed under Creative Commons License CC-BY 4.0
2012 ACM Subject Classification:
Computer systems organization Embedded software ; Software and its engineering Semantics ; Software and its engineering Software testing and debugging ; Software and its engineering Integrated and visual development environmentsSupplementary Material:
Software (ECOOP 2026 Artifact Evaluation approved artifact): https://doi.org/10.4230/DARTS.12.1.11Editors:
Robbert Krebbers and Alexandra SilvaSeries and Publisher:
 Leibniz International Proceedings in Informatics, Schloss Dagstuhl – Leibniz-Zentrum für Informatik
1 Introduction
Developers naturally debug programs by iteratively verifying or falsifying a hypothesis by examining the program’s execution [33, 46]. Nondeterministic programs complicate this method significantly [10, 29], particularly in microcontroller applications where bugs can manifest unpredictably due to external interactions. Traditional debuggers struggle to reliably and efficiently reproduce the circumstances in which bugs manifest. Most existing debuggers do not provide developers with tools to manage and explore the different execution paths of the program being debugged. One notable exception is a technique called multiverse debugging [44] which has emerged as a promising technique to enable programmers to browse through all possible execution paths. Most existing multiverse debuggers unfortunately operate over a model of the program instead of the concrete execution [44, 32, 31, 30], and are fundamentally offline techniques except for the recent MIO [24] debugger. Additionally, browsing through all execution paths results in a state-explosion making current debuggers impractical. To create an efficient debugger capable of dealing with state-explosion in a constrained microcontroller setting, we were confronted with the three main challenges.
First, for programs driven by nondeterministic sensor inputs, the number of potential execution paths increases exponentially. Each possible sensor value introduces a new branch in the execution tree that the programmer must then meticulously track and evaluate to determine what input combinations are interesting. This results in an overwhelming state space, making it computationally and mentally intractable to exhaustively explore all possibilities [25]. Even systems with limited nondeterministic input values, for example an application with a simple temperature and light sensor111With a moderate precision 12 bit ADC each sensor has 4096 possible values, meaning that there are more than 16 million value pairs to consider., are already susceptible to this issue.
Second, current multiverse debuggers are very resource-intensive due to their snapshot-based approach. Each of these snapshots represents a complete state of the program, including all memory contents. The sheer volume of data required to represent these snapshots quickly becomes prohibitive, particularly when considering the limited resources available on microcontrollers.
Third, current offline techniques do not align with developers preferences for debugging on the concrete hardware [26] to avoid inaccuracies from simulators or approximations [19, 36].
In this work, we present a solution to these challenges: a remote concolic multiverse debugger that focusses on pruning the state-space in multiverse debuggers instead of dealing with IO consistency like previous approaches such as MIO [24].
First, the central innovation of this work is the integration of a static analysis technique, concolic execution, into the multiverse debugging process to mitigate state explosion. Traditional multiverse debugging [44, 24] relies on exhaustive exploration of all sensor inputs. In contrast, our approach performs online concolic execution on a more computationally powerful remote host to analyze the control flow. The symbolic analysis identifies critical input values necessary to cover all program paths. These inputs can then be used by the debugger to explore the concrete execution. The key advantage stems from this hybrid methodology: the static analysis intelligently prunes the possible inputs, and provides example values for each possible path to the debugger to explore. This combination significantly reduces the developer’s cognitive load as the debugger can visually present only the essential execution paths, thereby simplifying the analysis of complex nondeterministic behavior.
Second, we address the high resource consumption of conventional multiverse debuggers. Existing multiverse debuggers capture the entire program state for each explored state, which requires excessive memory and communication. Our approach replaces this with a highly efficient, trace-based approach. Instead of storing complete memory snapshots, our debugger records only the sequence of nondeterministic events (e.g., sensor inputs) along the execution paths. This minimal trace provides all the information necessary to deterministically replay any path from an initial state, significantly reducing communication and memory overhead.
Finally, just like MIO [24] we have chosen to build an online debugger that operates directly on the embedded device, catering for the embedded software developer preferences.
Contributions.
We introduce a trace-based remote concolic multiverse debugger that employs concolic execution to intelligently guide the exploration of a program’s nondeterministic behaviors, directly addressing the critical problem of state explosion. The realization of this approach led to the following main contributions:
-
The first practical implementation222Our prototype is provided as an open-source project built upon the user interface of MIO, and can be found here: https://github.com/TOPLLab/MIO/tree/rcmd of a novel hybrid debugging architecture combining concolic execution with multiverse debugging targeting microcontrollers.
-
A novel state-space reduction technique that reduces the state-space of nondeterministic programs in multiverse debuggers.
-
An alternative implementation strategy for multiverse debuggers that uses a trace-based approach instead of a snapshot-based approach, significantly reducing debugger overhead.
-
A formal model that defines the interaction between online concolic analysis and trace-based multiverse debugging, grounding our hybrid architecture in a theoretical foundation.
-
A proof showing the correctness of our approach.
-
A quantitative and qualitative evaluation over a set of Arduino programs, demonstrating a substantial reduction of the state space compared to existing multiverse techniques.
2 Hands on Remote Concolic Multiverse Debugging
In this section we provide an overview of how our hybrid approach to debugging works in practice, by showing how a small program can be debugged using our prototype.
2.1 A Temperature Dashboard Application
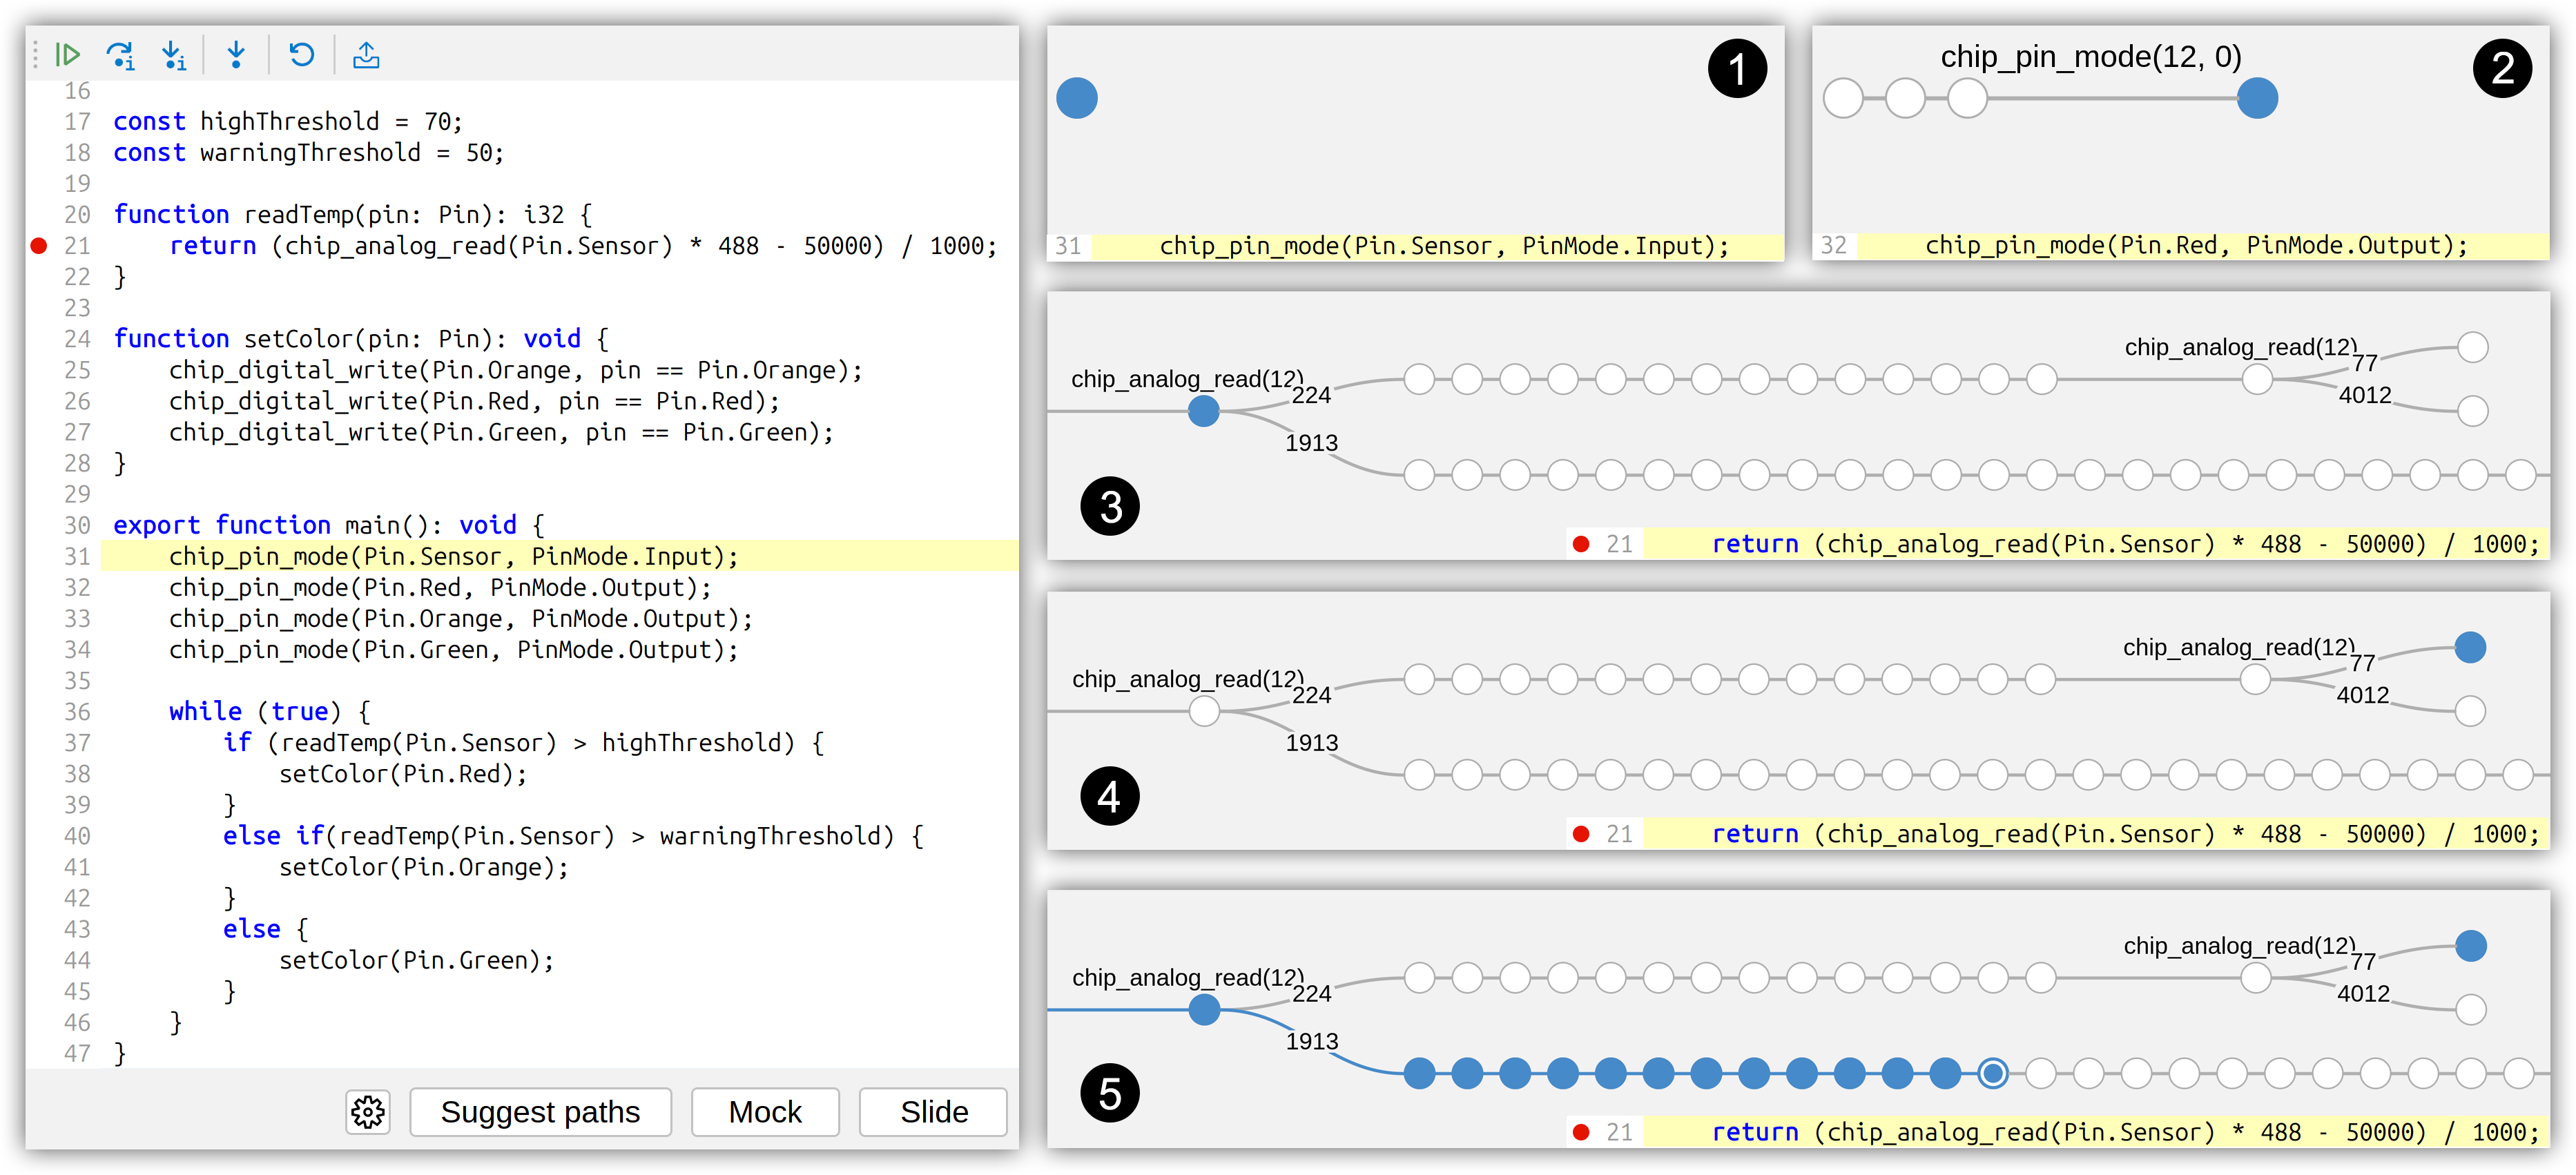
In Figure 1 we show our prototype being used to debug a temperature dashboard application, shown in the left pane of the debugger. See Appendix C in the extended version [41] for a full screenshot of our debugger.
This program reads a temperature sensor to control 3 LEDs, leading to three logical paths in the execution. If the temperature is higher than 70 degrees, a red LED will turn on. If the temperature is between 50 and 70 degrees an orange warning LED turns on. Below 50 the LED is set to green. In this relatively simple example, the temperature is measured using an analog sensor that varies its resistance based on temperature. The resulting analog input signal is then converted into degrees Celsius.
This simple program contains a subtle bug that is hard to discover with traditional debuggers. Instead of reading the temperature sensor once and then using this value, the program reads the temperature multiple times (line 37 and 40). This can lead to situations where the lights are incorrectly switched on or off given the last sensor value. In addition to these glitches, reading out the sensor multiple times per iteration slows down the program and consumes more battery power. Using our debugger, these issues can be identified.
2.2 Remote Concolic Multiverse Debugging Session
Figure 1 illustrates the different stages of a remote concolic multiverse debugging session over our example program. After loading the debugger and the program, the first line of the source code is highlighted as shown on the left. The multiverse tree at this point is only a single root node, the entry point of the program (pane 1, Figure 1). Stepping forward extends the current path as shown in pane 2 (Figure 1). Every edge in this path is a single WebAssembly instruction, and edges for primitive calls are labeled with the name and provided arguments.
Imagine the programmer places a breakpoint just before reading the temperature sensor (line 21) and lets the program run until this point. After the breakpoint is hit, when using a traditional remote debugger, the programmer would proceed through the program code with an arbitrary temperature value (i.e. the current temperature). Alternatively the developer might manually heat or cool down333Such as in this GitHub issue where a bug is reproduced using ice packs https://github.com/tobyweston/temperature-machine/issues/13. the sensor to guide the program execution.
In contrast, our concolic multiverse debugger helps guide a programmer’s exploration using its concolic execution. The developer can simply ask the debugger for interesting future execution paths by pressing the “Suggest paths” button (source view, Figure 1). The debugger then uses concolic execution to identify all future execution paths within a user configurable bound (number of instructions and/or number of nondeterministic operations). The possible paths found by the analysis are added to the multiverse tree view (pane 3, Figure 1), showing each of the possible executions as a new branch. Compared with remote debugging, this feature frees developers from having to manually find the necessary sensor values for specific control flow paths, either through trial and error or by manually analysing the program which quickly becomes too complicated as the program’s complexity increases.
Each choice point in our visualisation corresponds with a call to a nondeterministic input primitive, we label the edges starting from a choice point with the corresponding input values. This gives developers a clear overview of how the input values influence the program’s behavior. For instance, in pane 3 (Figure 1), the concolic analysis found two possible branches after executing the chip_analog_read(12) primitive, with input values 224 and 1913.
Subsequently, the developer can manually explore the effects of the nondeterministic input, by choosing one of the branches added by the concolic analysis. Developers do not have to change the temperature manually to change the input value to correspond to their desired branch. Instead, the debugger provides a mocking functionality through the “mock” button, which launches a new pop-up window. In the pop-up, developers can specify the return value for a specific input primitive and its specific arguments. In our example, the developer changes the return value for reading pin 12, to 224, steps forward to the next analog read instruction, mocks it to read value 77, reaching the state shown in pane 4 (Figure 1). During execution the debugger uses the mocked values instead of the actual sensor value.
While mocking is an essential feature for exploration, it takes quite some manual effort to provide all the right sensor values when exploring the multiverse graph. To make it easier to navigate the graph, the developer can simply click on a node and press the “Slide” button, to slide to that particular execution state, thereby entering the desired branch. When sliding to an entirely new branch with different parents, the debugger restarts the program and mocks the right values at each choice point automatically. Pane 5 (Figure 1) shows how the debugger highlights the path that will be taken from the root node to the selected node (highlighted with a white circle), before the Slide button is pressed. Note, this operation does not modify the tree, even when restarting the program. All previous branches remain visible.
As the outlined debug session shows, the concolic multiverse debugger improves on the common remote debugging experience by making it easier to explore multiple execution paths and gives the developer a clear visual overview of choice points in the program. Exploring different execution paths is made easier by the sliding feature, allowing developers to go from one branch to another, and by the mocking feature, which allows the debugger to easily mock any input action. However, the advantages go beyond this.
The concolic analysis coupled with the tree visualisation can already point out the cause of a bug at a glance. For instance, when the branches provided by the analysis differ from what is expected, this usually points to a mistake in the program’s logic. This is certainly the case in our example, where one expects a single choice point with three options for the current temperature. However, the trace shows two choice points with two branches each. This is a consequence of reading the analog sensor value twice in the if statement (lines 37 and 40) instead of reading it once, and storing it in a variable. As a result the temperature value can differ between the two if statements, which can potentially cause strange behavior.
3 Contrast with Traditional Debugging
The outlined debugging scenario with the remote concolic multiverse debugger, contrasts sharply with both the way developers traditionally debug nondeterministic programs on microcontrollers, and with debugging sessions in current multiverse debuggers.
Traditional Debugging.
Our example application illustrates several difficulties in debugging nondeterministic programs with traditional linear debuggers, where only one path of the program can be explored at a time. These debuggers have three major drawbacks.
First, when searching for a bug developers often restart and execute the program multiple times. Unfortunately, with a traditional remote debugger the programmer will possibly explore vastly different execution paths each time. With remote debuggers it is the developers responsibility to keep track of all the differences and similarities between these executions. The multiverse tree visualisation in our debugger reduces the cognitive load for developers.
Second, it is often not clear whether all interesting execution paths have been considered during debugging. In the example, it is hard to predict which sensor values will turn on specific LEDs (due to the non-trivial conversion function, line 20–22). In more complex programs this can only get more challenging, as more complex operations are performed. In contrast, our on-demand concolic analysis provides the minimal set of branches the developer needs to consider, along with concrete example values.
Third, even when we know what inputs are needed to explore our desired execution path, it is difficult to manipulate the environment during debugging, to achieve those exact inputs. Manipulating other sensors, or manipulating programs with more than one sensor, poses additional challenges. Luckily in our debugger, the programmer can slide to the desired location automatically, while the debugger mocks the needed values along the way.
Multiverse Debuggers.
Most multiverse debuggers are not designed for debugging live programs. Instead, they operate on the semantics of the underlying programming language [44, 32, 31, 30]. Recently, MIO [24], a debugger focussing on IO consistency, became the first multiverse debugger for concrete executions. MIO finally makes it possible to debug live programs, but like previous approaches it suffers from state explosion. Even for simple programs, the number of possible execution paths can become unmanageable.
For instance, in a program with two sensor readings, a multiverse debugger might present the user 4096 options at each choice point. This results in a total of , possible execution paths. The programmer is then tasked with manually identifying specific paths from this vast search space to debug the program. In contrast to MIO this work focusses on the state-explosion problem and leverages the power of concolic execution to identify sensor values needed to explore each of the execution paths. In our example program, this significantly reduces the cognitive burden for the programmer since they no longer need to reason about which raw sensor values, that are later converted to Celsius result in a specific branch.
Additionally, existing multiverse debuggers such as MIO use a snapshot based approach where a snapshot is taken after each IO operation. This enables reversible IO in multiverse debugging. Since this work focusses on state-space reduction and not IO, we took a different approach that trades this reversibility for performance by using a trace-based approach.
4 Remote Concolic Multiverse Debugging
In this section, we describe the operation of our trace-based multiverse debugger through a small-step semantics defined over a stack-based language, specifically WebAssembly [12], as this formalisation is representative for a wide variety of virtual machines. The formalization abstracts away from the details of the underlying WebAssembly semantics as much as possible. Our novel system is at heart a remote debugger, where a client and server component exchange messages as described by the small-step semantics. The client component keeps track of the multiverse tree and performs the concolic analysis, while the server instruments and maintains the concrete runtime to perform the live debugging operations. The semantics are defined over several configurations, which we will discuss first.
4.1 Debugger Configuration
debugger.
Although the debugger can be viewed as a single monolithic unit, it is more practical to conceptualize it as comprising three distinct components: the WebAssembly virtual machine (VM), which defines the foundational language semantics; the server, which operates as the remote debugger on the microcontroller; and the client running on a desktop computer, which interacts with the server to facilitate debugging. We begin by outlining the WebAssembly configuration, followed by a detailed discussion of the server configuration. Next, we examine the client configuration, and give an overview of the complete remote concolic debugger setup. In later sections, we delve into the semantics of both the server and the client components.
4.1.1 WebAssembly Configuration
A core component of the WebAssembly configuration, shown in Figure 2 is the program state where are the local variables, are the global variables, is the data stack, is the store and is the instruction stack. The semantics of WebAssembly are defined as a small-step operational semantics, where the program state is updated through a transition relation . While the semantics of WebAssembly are quite intricate, it is sufficient to know that the transition relation as defined in [12] is fully deterministic. On top of these deterministic base semantics we add nondeterministic primitive operations.
The WebAssembly VM used in this work supports a foreign function interface to define primitive operations. These primitives are exposed as a special WebAssembly module in the VM. By importing this module, programs can interact with external I/O elements, enabling functionality that cannot be achieved using standard deterministic WebAssembly instructions. Since primitives interact with the external environment and perform operations beyond the scope of standard WebAssembly instructions, they are the only source of non-determinism.
In the semantics, there are two primitive tables and containing respectively the output and input primitives. These tables are consulted to determine whether an instruction is invoking a primitive. We use to reference both tables as one. The notation “non-prim K” indicates that and does not hold, meaning the instruction is not a primitive. Conversely, the notation “prim K” indicates that holds, meaning that the next instruction will be a primitive call. The function types show how input primitives return a single value , and output primitives return no values. Figure 3 shows how input and output primitives are evaluated. We use the notation to indicate that the primitive function is executed outside the WebAssembly semantics. For the input primitives the return value is nondeterministic as indicated by the notation .
4.1.2 Server Configuration
The server state shown in Figure 4 is a tuple where is the execution state, is the incoming message queue for receiving from the client, is the outgoing message queue for sending to the client, are the currently set breakpoints, is a counter tracking how many instructions were executed since the last synchronisation with the client, and is the current program state. The execution state indicates whether the program is currently Running or Paused. Incoming messages from the client are server messages . Breakpoints can control the execution of the program and are added or removed using the and messages respectively. In the following sections we explain how the counter allows for efficiently synchronizing the client and server.
4.1.3 Client Configuration
The client state shown in Figure 5 is represented as a tuple where is the incoming message queue for receiving messages from the server, is the outgoing message queue for sending messages to the server, is the root of the multiverse tree and is the current node in the multiverse tree.
The multiverse tree is used to represent the possible execution paths of the program and consists of deterministic and nondeterministic nodes. In Figure 6 we show an example of a multiverse tree with a root node and a current node . In the semantics this tree would be described as . This indicates there is a root with one child connected using a edge. This child has two children each connected using a edge. The edge labels in the multiverse tree indicate the debugging operations needed to traverse the tree. For example, to move from node to , the operation has to be performed. How each of these operations work exactly and how they affect the tree is discussed in Section 4.4.
4.2 Global Debugging Semantics
Figure 7 shows the semantics describing the communication between the server and the client in the debugger. These rules also specify when the server can take a single step. Each rule is defined as a transition (denoted by ) over the pair of client and server configurations .
Whenever the server puts a message for the client in its outbox the Server-To-Client rule applies which causes the client to process this message using the client transition relation . The server-to-client communication has priority over all rules in the system, therefore on the client outgoing messages are always sent after processing all incoming messages.
When the server has no outgoing messages and the client has one or more messages in its outbox compatible () with the current state of the server, the message is processed by the server (denoted by ) as shown in the Client-To-Server rule. This compatibility relation essentially means the client can only send messages when the server is in the Paused state. The only exception to this rule is the message, which can only be sent to the server when it is in the Running state444Note that in our semantics the user can easily bring the debugger in a stuck state by sending an incompatible message, we consider such scenarios to be part of a bug in the frontend of the debugger.. This lets the client pause the server at any time.
When all message queues of the server and client are empty, the Server-Step rule applies and the server can take a single step under the relation. In the following section we will focus on how this reduction relation is defined.
Note that in our semantics, we have chosen to make all operations synchronous, the server is blocked while the client processes messages. This decision is primarily motivated by clarity, as asynchronous semantics would be more difficult to understand and reason about.
4.3 Server Semantics
Having discussed the global communication rules, we can now focus on local client and server reduction rules. We start our overview with the reduction relation of the server .
The server has two states: Running or Paused, the rules for both cases are similar. In the Running state, the server will execute the program while keeping track of a counter tracking the number of executed instructions since the last synchronisation with the client. Whenever an input primitive is executed, a so-called message is sent to the client. This message contains the counter and the return value of the nondeterministic input primitive. After sending this message the server will reset the counter to . The full rules for this behaviour can be found in Appendix A.1 of the extended version [41].
The Paused rules are similar but instead always notify the client of every executed instruction so that the client knows exactly where in the program the server is. The rules shown in Figure 8 define the semantics in the Paused state. The server can go into the Paused state by hitting a breakpoint or because the developer sent a message to the microcontroller. When switching to the Paused mode the client will be notified how many instructions were executed since the last synchronisation with the client.
Once the debugger is paused, the client can instruct the server to step through the execution by sending or messages. When stepping, the server differentiates between normal instructions, calls to output primitives, and calls to input primitives as reflected in the Dbg-Step, Dbg-Step-Prim-Out and Dbg-Step-Prim-In rules. When taking a step over a regular instruction or a call to an output primitive, the server notifies the client that one deterministic step was taken using . When stepping over a call to a nondeterministic input primitive, the client is notified of the value returned using . For the primitives is used to indicate the operation is performed outside of the system. In this case the value is produced outside of the system and can be nondeterministic.
The Dbg-Mock rule allows the developer to pick which execution should be explored by controlling the execution of nondeterministic primitives. Instead of executing the primitive, the debugger replaces the arguments to the call with the supplied value and removes the from the execution stack. An important requirement here is that must be a value that the primitive can produce in the underlying language semantics. With this rule alone, a developer has to manually choose the value to be explored. However, it is often complicated to figure out which values are needed to explore specific execution paths such as in the basic example in the previous section. In Section 5, we explain how we automatically generate the necessary values removing the need to enumerate countless options.
The Dbg-Play, Dbg-Inspect and Dbg-Reset rules of the debugger, detailed in Appendix A.4 of the extended version [41], respectively transition the debugger to the running state, request a snapshot and restart execution from the start of the program.
4.4 Client Semantics
The client in this system does most of the heavy lifting since it does not run on the microcontroller. Instead the client has a message queue that processes messages received from the microcontroller (server). Using these messages the debugger constructs the navigable multiverse tree. The tree has the structure described in Figure 5 as previously explained in Section 4.1.3. Every node in the tree can have zero or more children. The edges of the tree are marked with debugging operations used to navigate the tree. For deterministic nodes the operation is used, for nondeterministic nodes will be used. This tree and the current node is stored alongside the incoming and outgoing messages in the debugger state.
4.4.1 Building and Navigating the Tree
During the execution of a program, the multiverse tree stored in the client is both built up and navigated by the debugger. Two types of messages notify the client about executed instructions on the server: and . The former indicates the server executed a specified number of deterministic instructions, denoted by . The latter notifies the client that the server has executed number of deterministic instructions followed by a nondeterministic primitive that returned . When these messages are sent by the server they are transferred into the inbox of the client. Upon arrival at the client, the debugger processes these messages with the Executed and Prim rules shown in Figure 12.
Both the Executed and Prim rules make use of the operation. This operation navigates the tree and creates new paths if necessary based on the provided sequence of input messages. In essence it just follows the messages which are also the labels of the edges in the tree one by one and creates new edges if the current message it is processing does not exist yet. The exact details for these rules can be found in Appendix A.5 of the extended version [41].
Executed.
When arrives the Executed rule will take steps forward in the tree starting from the current node . It does this by using operations as the sequence of operations. The message specifies that the executed path of was fully deterministic, as a result the nodes that are traversed will only have one or zero children. If the node has a child it becomes the next node, if it does not, a new node is created and that node becomes the next node. In Figure 9 we show the effect of receiving an message in a very basic tree. If did not have any children, two new nodes will be attached and the last node becomes the new . If did already have a child, the edge will simply be followed. For the second edge the same rule applies.
Prim.
Upon receiving the client learns that instructions were executed ending with a nondeterministic operation that returned value . The new path consists of operations and one operation. Existing nodes are traversed, and new nodes are created when needed. In the case of each of the start node’s existing children could have a different message on their edge. In this case the debugger will add a new child to this node and make that child the next node. This is illustrated in Figure 11. In this example there are pre-existing and edges but there is no edge.
Slide.
Using the previous rules, the tree is automatically extended during the execution of a program and new branches can be added with the operation. To easily navigate the multiverse tree users can move to any pre-existing state using the slide555Slide is named after the popular 1995 sciencefiction TV series “Sliders”, in which the main characters slide into a parallel universe each episode. operation.
The slide operation consists of two rules. Either the user slides to a target state downstream of the current execution path (indicated by ). Or they slide into a state that cannot be reached by going forward in the current execution. When this happens the debugger will instruct the VM to restart the program and execute the selected path as shown in Figure 11. This approach differs from MIO [24], as MIO is able to step back in time instead of restarting the execution. In both rules the debugger will have to determine the necessary debugging operations needed to go from the current state (or the start state in case of Slide-Restart) to the target state. Thanks to the structure of the multiverse tree, this is simply the list of edge labels on the path to the target state. To obtain this list the rule is used in the semantics. The exact definition of this rule can be found in Appendix A.6 of the extended version [41].
Interestingly, the slide rules do not directly change the current node in the tree to . Instead, they instruct the remote debugger to move to a particular location in the tree. When doing so, the server will notify the client of any executed instructions and primitives using the and messages, which will in turn change the current node in the tree. Because Slide-Restart resets the execution, it first changes the current node to the root node . The and messages then walk forward again in the tree.
Concolic-Receive.
Finally, the tree can also be automatically extended with paths that result in full code coverage using Concolic-Receive. This is the topic of the next section.
5 Suggesting Interesting Paths using Concolic Analysis
The and operations already allow the multiverse tree to be extended and navigated. That said, to find bugs the developer still needs to enumerate all possible sensor values. Yet many values result in the same execution path. Therefore, we propose using concolic execution to identify a subset of sensor values that provide full control flow coverage.
Concolic execution [9, 20] is a technique mostly used for automated testing and fuzzing [2] that generates inputs for programs so that each execution path of a program can be explored. Concolic execution is an iterative algorithm that explores a new execution path in every iteration. The algorithm derives a model, i.e. an assignment of symbolic variables which satisfies a path condition. In the first iteration, symbolic variables are given an arbitrary value. Using these values the program is executed concolically. While this happens the concolic executor will build up a path condition. At the end of this execution the algorithm will typically use an SMT solver to find a path different from the already explored paths. To do so the algorithm asks the SMT solver to solve the equation representing conjunction of the negations of all explored path conditions. Using this model a new iteration is started again until no new model can be found. An illustrative example of this algorithm can be found in Appendix B of the extended version [41].
Here we show how the ideas of this technique can be used to generate not just a set of inputs for a program but a multiverse tree containing all future execution paths that could be explored starting from the current execution state.
5.1 Concolic Execution in Debugging
In order to integrate concolic execution into a live debugging session, we cannot follow the usual strategies of current concolic execution engines. Firstly, our analysis begins not from the start of the program or an existing concolic state (as in online concolic execution) but instead starts from the concrete execution state of a program running on a microcontroller.
Secondly, we are working with embedded systems where concolic execution cannot run locally. As a result, the analysis must be performed remotely. To initiate the analysis from the current execution state of the microcontroller, the state needs to be transferred to the client performing the concolic execution. The custom virtual machine enables this state transfer by sending an message to the debugging server, as previously described. When receiving this message the server serializes its state and transfers it to the client. However, this is purely a concrete state without any symbolic components. To start the analysis from this concrete state, the debugger first needs to transform it into a so-called concolic state in which every concrete element has a symbolic counterpart. Using the newly created concolic state, the analysis can start from the current execution state in the debugger.
For our debugger, we developed our own concolic execution engine for WebAssembly based on the semantics described in [27]. To ensure that our theoretical model aligns with our practical implementation, which leverages an existing concrete execution engine during concolic execution, we adjusted the formalization. By doing so the concolic rules re-use the concrete rules just like in the implementation. This approach results in both server and client VMs using the same codebase for concrete execution. However, on the server side, we compile the code in a way that excludes the concolic execution functionality.
5.2 Configuration of the Concolic Executor
To start we describe the components of this execution engine shown in Figure 13. The core configuration for the concolic semantics is very similar to the core of the previously described debugger semantics. It consists of a collection of locals, globals, a stack and memory. These are part of the concrete state . Unlike the concrete execution, each of these components now has a symbolic counterpart that we denote using for a component . The symbolic locals (), globals (), stack () and memory () are all defined similarly to their concrete counterparts but now map an index to a symbolic expression instead of a concrete value. We previously defined concrete values as , we now define symbolic expressions as . A symbolic expression can be a concrete value, a symbolic variable or a unary, binary or tertiary operation on symbolic expressions. These are symbolic expressions and not values because it is not always possible to calculate the result of an expression when working symbolically.
Alongside the locals, globals, stack and memory the concolic execution engine also has some properties specifically needed for concolic execution. These are the symbolic environment () and the path condition () stored in a concolic program state defined by .
Outside of the concolic state our concolic execution engine also keeps track of a multiverse tree which will later be added to the tree in the debugger. This tree denoted with is very similar to the tree described in Section 4 but now has an additional component which we call the “”. This is a list of path conditions and their associated symbolic environment, denoted by . This additional information is used by the analysis to continually extend the current multiverse tree with new paths while merging paths that share a common prefix.
5.3 Concolic Execution Semantics
Using the previously defined components, we now define the concolic semantics in Figure 14 (defined by ). For brevity we do not list all rules here but give a representative subset.
The concolic semantics define a transition relation between two concolic states . All rules follow the following structure: .
We first describe the rule used for simple binary arithmetic instructions, these instructions e.g. simply take two elements from the stack, apply an operation to them, for example addition and place the result on the stack. In our concolic execution engine this is done by using the underlying concrete semantics to manipulate the concrete stack and applying the symbolic binary operation on two elements of the symbolic stack. In this case symbolic addition. This way we do not need to reimplement the concrete part of our interpreter for every instruction but can instead reuse the existing implementation.
Symbolic-Prim-Fresh is responsible for creating new symbolic variables. When an input primitive is called and the unique symbolic variable associated with this call is not in the symbolic environment , a new symbolic variable with that name is created and is given an arbitrary concrete value . Note that we assume here that the function returns a different identifier for different uses of the same call. This symbolic variable is placed in .
Symbolic-Prim applies when the symbolic variable already exists in the symbolic environment. In this scenario, the concrete value is read from . This concrete value is pushed on the concrete stack. The symbolic variable itself is pushed on the symbolic stack.
The If-True rule is essential for building up many of the path conditions. Given that the current instruction is and the condition on the stack is not , the next instructions will be . The concrete part of the state is updated in the same way as normal using the concrete semantics . The symbolic part of the state is updated by removing the expression representing the condition from the stack and updating the path condition to show that the condition is true.
The If-False rule works analogously except that the condition is false now and the branch will not be taken. Instead the instructions in the else case will be executed. The symbolic stack and path condition are updated accordingly to reflect that the condition is not true in this case.
5.4 Generating Multiverse Trees
A traditional concolic execution engine generates a series of models, each representing a unique execution path within the program. However, a multiverse debugger enables interactive exploration of these executions through a graph-based interface. For concolic multiverse debugging, the analysis must not produce a sequence of isolated models but instead construct a tree in which overlapping parts of different executions are merged.
This is what happens in the Concolic-Receive rule for the client shown in Figure 12. It will, upon receiving a snapshot by first sending an message, take a concrete state and convert it into a concolic state using (details in Appendix A.7 of the extended version [41]). Then it uses the function described below to generate a tree of future execution paths. Finally, the resulting tree is attached to the current multiverse tree by replacing the current node with the root of the newly generated tree.
The tree of future execution paths is built iteratively in the function described in Algorithm 1. To achieve this, the main loop of the analysis iteratively expands the multiverse tree after each concolic iteration using the function.
To expand the existing tree the different symbolic values stored in the model are used to walk through the existing multiverse tree. When walking through the tree, the algorithm adds or follows a path for every executed instruction. The pseudocode does this using the relation666We use here for simplicity, in the actual implementation the number of deterministic instructions between each choice point is simply stored in a counter, so there is no need to re-execute the program.. If the instruction is deterministic, a node connected using a edge is added or followed. These edges never branch and simply indicate that there is a deterministic instruction that can be stepped over. If the edge does not exist yet, it is created, if it does exist, the edge is followed. If an instruction is nondeterministic, the algorithm will check if the path for this value and path condition is unique or not. If it is not unique, the algorithm will keep following the existing path. If it is unique, a new branch in the tree will be created.
To check if a path is unique with respect to a particular value, it is important to realise that a new path found by a concolic execution engine will always differ from an existing path at some point. As such the tree building algorithm looks for the point where the new model’s path condition branches off from one of the models in the current path (denoted by ). This is the point at which the common prefix of two executions end.
To achieve this the algorithm will do a pairwise comparison between the models for each symbolic variable until a point where diverges. The algorithm does this by placing the first variables of the existing model in the new path condition and vice-versa. At some point one (or both) of these path conditions will no longer hold. At this point the two models diverge. From this point on the algorithm will attach new nodes to the tree, creating a new path, instead of following an existing path.
Tree construction example.
To illustrate this algorithm, we will show how a multiverse tree can be built for the example program shown in Figure 15 which uses a simple loop with an if statement. For this program, we will give a few example models that can be found by concolic execution and how they would be added into the multiverse tree.
The first concolic iteration could result in the model with path condition , shown at the top of Figure 17. After each concolic iteration, the algorithm will run the method. At the start of the algorithm the root node has no children and has no associated models. The function will check if there already exists a model that has a common prefix with the current model up to depth . In every loop iteration this is increased, until the divergence point. As there are no models associated with the current node, it will result in a new path. When creating this path the model and path condition are also added into the of the nodes.
The second concolic iteration then finds a different path with model and path condition . This model is shown below the first model in Figure 17. The function will now follow the existing path up to the divergence point, at which point it will start a new branch by attaching new nodes.
Initially is , to check if the branches diverge the algorithm will substitute from the current tree into the new path condition and vice-versa as shown in the function. If one of the path conditions does not hold using this different , the branch has diverged. In this case holds and also holds. This means the value of is valid for both path conditions which indicates these paths share a common prefix. Consequently, the algorithm can keep following the existing path. Then increases to . At this point the algorithm will substitute both and from the original model into the new path condition and vice-versa. This results in and which both do not hold. This indicates the paths have diverged and so the algorithm now attaches a new node instead of following the existing path. Then is increased to . Since there are no in this new branch, a new node is added. The end result is shown at the bottom of Figure 17.
To further illustrate how the are used, suppose the concolic execution engine finds a third model with path condition . This model is shown at the top of Figure 17. When this model is used to extend the tree, the algorithm will see that the edge connecting the first and second node is equivalent with respect to . When coming to the second node however, there are two branches, and two path models to choose from ( and from the end result in Figure 17). Only one of these path models is equivalent with respect to , namely . As a result, the algorithm will follow the edge and attach a new node for since there does not exist an equivalent path in the for this node (). The resulting tree is shown at the bottom of Figure 17.
The algorithm keeps repeating this process until all possible execution paths have been explored and the multiverse tree has been constructed. Afterwards, the associated models stored in each of the nodes are removed and the tree is returned.
5.4.1 Infinite Loops
Considering many microcontroller programs use an infinite loop, our algorithm only generates trees up to a limited depth. This depth can be configured by limiting the number of instructions in a concolic iteration or by limiting the number of symbolic variables in an iteration. In the pseudocode this can be achieved by limiting the number of transitions, for brevity we only show the former. Aside from limiting the depth, it is also possible to limit the number of concolic iterations, this is handled using the function in the pseudocode. All these options are configurable in the user interface, allowing the developer to analyse the program for a longer period of time if needed.
5.5 Debugger Guarantees
The formalisation of our technique follows previous works on multiverse debugging, specifically Voyager [44] and MIO [24], where the debugger semantics are defined in terms of the underlying language semantics. This allows debugger correctness with respect to the underlying language to be defined as the combination of soundness and completeness, as proposed by Lauwaerts et al. [24]. Soundness means that the debugger should only be able to explore states possible in the underlying language semantics. Completeness states that every state possible in the underlying language semantics should be explorable in the debugger.
Soundness follows because the debugger’s operation is defined in terms of the underlying language semantics, and the operation can only mock values within the domain of the primitives. Completeness also holds because each underlying language step () has a corresponding debugger step (). For deterministic instructions, the message can be used. For nondeterministic primitives, the message can be used to make the execution in the debugger follow the exact same path as the underlying language semantics. Additionally, even though concolic execution suggests only a subset of possible sensor inputs to reduce the state-space, the debugger remains complete because the user can still manually other possible inputs.
A full proof, together with the formal definitions of soundness and completeness, is included in Appendix D of the extended version [41]. This proof differs from MIO due to our trace-based approach and the lack of reversibility. Due to this lack of reversibility we instead rely on restarting the execution entirely to slide to a different universe.
6 Remote Concolic Multiverse Debugging in Practice
To validate how well our approach works in practice, we implemented a prototype on top of the WARDuino [23] WebAssembly virtual machine. We selected programs out of the standard example programs provided by Arduino777https://github.com/arduino/arduino-examples/tree/main/examples, that use at least one analog or digital input sensor and have at least one if condition. We excluded programs that only used output or used sensors that are currently not supported by the WARDuino virtual machine. All of the programs we selected are written with an infinite loop which is very common in microcontroller programs. We also investigated the state-space reduction on two more elaborate applications, a gesture detector for controlling a robot from the electronics forum electronicsforu.com and a breakout game that we wrote ourselves. We evaluated for all programs how well our analysis was able to reduce the number of options presented to the user in comparison to the state-space shown by traditional multiverse debuggers. Additionally we discuss the benefits of remote concolic multiverse debugging for each of these programs.
6.1 State-space Reduction
| Program | States | Paths | Max opts | Loop iterations | Time (s) |
| arduino-crystal-ball | 11 | 8 | 2 | 0.283 | |
| arduino-knock | 2 | 2 | 1 | 0.038 | |
| arduino-touch-sensor-lamp | 2 | 2 | 1 | 0.003 | |
| arduino-switch | 4 | 4 | 1 | 0.131 | |
| arduino-keyboard | 5 | 5 | 1 | 0.116 | |
| arduino-love-o-meter | 4 | 4 | 1 | 1.172 | |
| arduino-while-no-calibrate | 3 | 3 | 1 | 0.063 | |
| arduino-while* | 76 | 65 | 1 | 219.613 | |
| arduino-knock-lock | 13 | 3 | 2 | 0.074 | |
| arduino-zoetrope | 16 | 2 | 2 | 0.080 | |
| gesture-robot | 31 | 2 | 1 | 0.106 | |
| breakout | 3 | 3 | 259 | 5.032 |
The data presented in Table 1 shows an overview of the state-space reduction for all programs that we tested. We under estimate the state space of a program by taking the path in the program with the most choice points and multiplying the number of options along this path (States). This number estimates the number of states that would be presented to the user in a traditional multiverse debugger. We show the amount of unique paths (Paths) found by our analysis and the maximum number of options (Max opts) presented to the user at any given point in time. For programs that use state from previous iterations we executed the loop twice as this is the minimal iteration count needed to see an effect. For programs that do not use state from previous iterations we limited the analysis to just one loop iteration (Loop iterations). For each of these configurations we also give the time (Time (s)) it took to analyse the program. As the data shows, our technique significantly reduces the state-space for each of the programs we tested888The arduino-while program has two variants, we discuss the reason behind this in more detail later.. In the following sections, we give an overview of these programs and show how remote concolic multiverse debugging helps to debug them.
6.2 Low Complexity
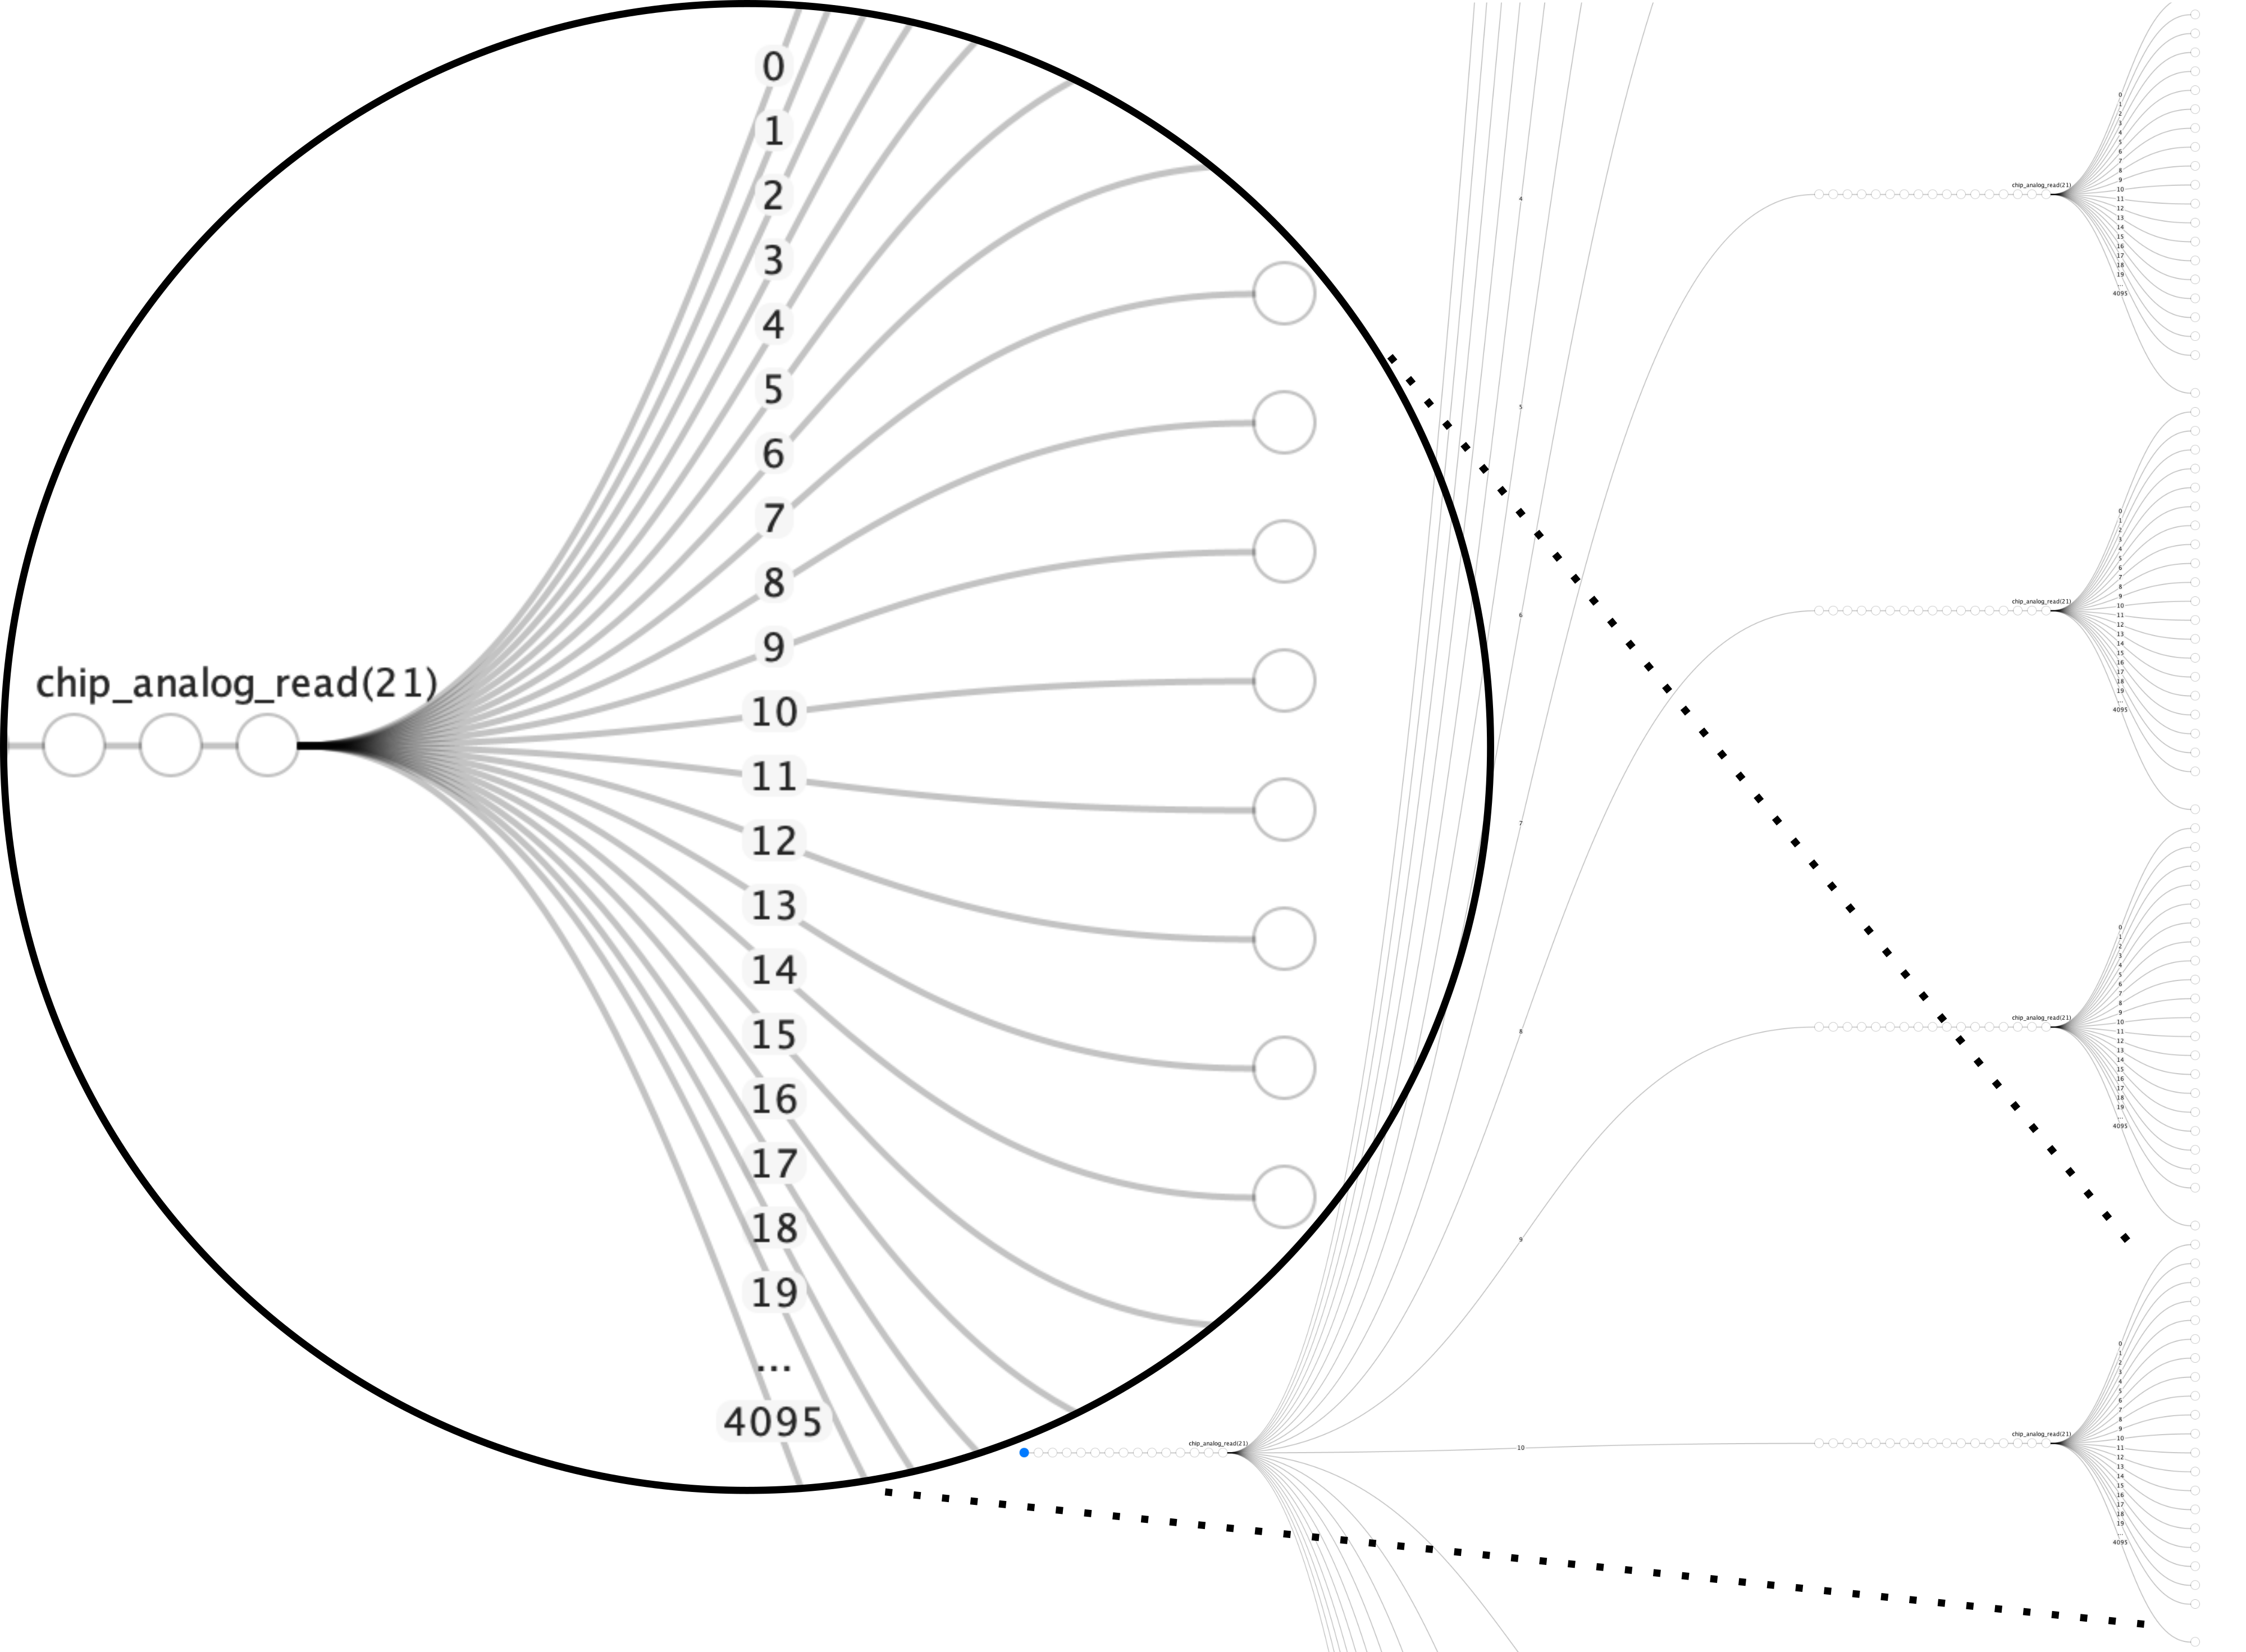

The arduino-knock, arduino-touch-sensor-lamp, arduino-switch, arduino-keyboard and arduino-love-o-meter programs only have 2 to 5 paths. While the state-space for these programs is still relatively big, a quick inspection suffices to find good nondeterministic values to choose from. The advantage of using our debugger over existing multiverse debuggers such as MIO [24] is that the user can much more easily explore interesting paths. Exploring a new execution path traditionally requires manually adding each edge through individual and operations. Additionally the user also has to decide which values they use when mocking from a large amount of options as visible in the left of Figure 18. Using our approach, all future execution paths can be created automatically with a single button press. This results in a tree where each execution path has corresponding inputs to explore it as shown on the right in Figure 18. In the arduino-knock program, this reduces the state-space from paths to just . The program uses a simple if and values are needed to explore both branches. In two loop iterations this results in paths. To explore an execution path, one simply clicks on a node in the path and slides to it, performing all the needed mocking and stepping operations along the way. This also allows users to easily explore sequences of values instead of just one singular value at a time as with mocking. For example, using the slide operation on the created paths in the arduino-keyboard program which implements a basic piano, sequences of notes can easily be explored. Furthermore, our analysis helps to point out strange behaviors in programs. For example, the arduino-switch program reads an analog value and maps it from 0 to 3 (inclusive) for use in a switch. Strangely this program has 5 execution paths instead of 4. This is due to the arduino map function which does not constrain the output when the input value is higher than the maximum. Our analysis points this out to the developer. Finally, our analysis also helps in cases where the value needed to mock is unclear, such as in the arduino-love-o-meter where floating points calculations convert an analog value into celsius before performing branching. In this case our analysis calculates the right input values needed to get into the right branch after the conversion. Calculating the needed values by hand would take a significant effort.
6.3 Medium Complexity
The second set of programs have a higher path complexity ranging between 11 to 16 paths. We found that for some of these programs the state-space reduction becomes significant, as it is no longer obvious which input values are needed for full coverage based on a quick inspection of the source code. The main reason is that these programs combine multiple sources of non-determism and keep track of state over multiple loop iterations. This combination makes it much harder to reason about the possible combinations that can occur during execution.
The arduino-crystal-ball has 11 paths because the program implements a magic 8 ball using a random integer from 0 to 8 (exclusive) with a switch case and a button that needs to be pressed and released. This program illustrates how programs using the random function can be more easily debugged because the behaviour of this nondeterministic function can be controlled using the debugger. The arduino-knock-lock program implements a vault door that can be opened by knocking a specific pattern. It has 13 paths in two iterations, this is because it allows users to either not press a button or knock in 3 different ways, this results in 4 paths in the first iteration and in the second iteration. This program opens the lock if the door is knocked on 3 times, as such a higher iteration count might be interesting in this program. This is configurable in the debugger. Using our analysis, the user can easily generate the needed values to trigger different kinds of knocks and explore the effect of knocking various different sequences without actually needing to manually knock each sequence. Finally, the arduino-zoetrope program implements a zoetrope which provides the illusion of moving images. It has 16 paths, this is because it has two buttons that can both be pressed or not pressed in each iteration resulting in 4 paths in the first iteration and 16 in the second. Given this program only branches on digital inputs, it is relatively easy to debug. However, this program also showcases an additional aspect of our debugger. To control the motor speed, the program directly uses an analog value read from a potentiometer. Since this is only a single execution path, only a single value is generated. However, using our manual mocking operation, other additional inputs can easily be explored allowing developers to reproduce bugs where a different speed is required. The same applies to many other programs where an input directly controls the output without branching.
6.4 High Complexity
We categorize three of the selected programs as high complexity, either due to the many paths generated or due to the larger code base making it more complex to understand quickly. These three programs are the arduino-while example, a gesture controlled robot and the breakout game.
The arduino-while program first calibrates a sensor at runtime when a button is pressed. Subsequently, it reads an analog value and runs it through a formula with hardcoded values. It then clamps the result between 0 and 255 using two if statements. Interestingly, this program generates an abnormally large number of paths. The amount of states for this program are so excessive that we had to limit the number of concolic iterations for the analysis to finish in a reasonable time. This abnormally large number of paths can be attributed to the calibration step used in this program which first reads an analog value which later serves as a threshold in the program. Because this sensor value is used to determine the branching conditions, the concolic analysis can keep finding new paths by simply choosing a different sensor value in the calibration, resulting in a nearly infinite number of paths.
Our work overcomes this issue by letting the user first run the program and calibrate the sensor value and then debug the rest of the application given the chosen calibration. This way, once the user chooses the path that will be taken depending on this unknown value, the value is already chosen and only few options remain. Our work enables this by employing a dynamic approach that starts the analysis from the current program state in the debugger instead of using a static analysis that does not take the current program state into account. To show the number of paths after choosing a calibration value, we also evaluated a version of this program without the calibration called arduino-while-no-calibrate which can be found in Appendix E.2 of the extended version [41]. This is equivalent to choosing a calibration value in the debugger and then running the analysis. As shown in Table 1, this drastically reduces the number of options, from a nearly infinite collection of options to just 3 paths once the calibration phase is over. These three paths are a result of the clamping operation, either the value is within the bounds, below the minimum or above the maximum value.
The gesture-robot program implements a gesture detector to remotely control a robot. The remote works using an accelerometer, analog values are read to get the acceleration on the x and y axis. Based on these values the remote can make the robot drive forwards, backwards, turn left, right or stay idle.
This program uses a chain of four conditional if else branches with an else at the end. Each if condition reads in a new x and y axis acceleration value, when both these values are within the required threshold the robot performs the associated action. Each if statement has 3 options, either both x and y are within bounds, only one is or none are. For two of these the program falls back to the next if statement which then again has 3 options, in the end this results in possible paths. Each of these paths is correctly discovered by our concolic analysis. The main complexity of the gesture-robot application stems from the way the program is written. The program reads in a new sensor value whenever a sensor value is needed instead of storing sensor values in local variables. As a result it is possible for sensor values to change in between reading values causing strange unpredictable behavior. Our debugger makes the excessive number of possibilities clear to the developer and allows them to take action. Additionally, besides helpful to point out these issues, the analysis allows the developer to easily test all the possible gestures without having to manually perform each action in the real world.
The breakout game listed in Appendix E.3 of the extended version [41] implements a simple breakout game where an analog joystick determines the position of the paddle. When analyzing this program for 259 loop iterations, the point where the ball will reach the bottom of the screen, the analysis determined that there are only three paths. One in which the paddle is on the left of the ball, one where it hits the paddle and one where it is on the right of the paddle. The analysis also found that in a large portion of the program, the position of the joystick does not matter, resulting in a single execution path. This is the case when the ball is not near the paddle and the paddle can thus not hit the ball. Using the provided paths, the developer can easily test certain game scenarios such as behavior at very high scores which might be very difficult to reach for a developer. Due to the complexity and size of this program we believe this program showcases that the analysis can be effective over a larger program with a large number of iterations. Additionally, while the snapshot based approach of MIO [24] works well for most programs, we noticed a large reduction in overhead when using our trace-based debugger for this particular program. In a test on the breakout program, it took around 1.9s to execute instructions without tracing. When using our trace-based approach the execution time went up to 2s. However, MIO’s checkpointing policy (which in this case takes checkpoints every instructions) increased the execution time to around 5 minutes for this particular program. This shows that the overhead of our trace-based approach is significantly less than MIO for programs that perform very frequent IO operations. However, while the overhead of forward execution is significantly reduced, the time to step back has increased as it requires re-executing the program. A more in depth analysis is provided in Appendix F of the extended version [41].
7 Related Work
While combining static analysis with debugging is a very novel space, there are many domains and specific works connected to our efforts.
Multiverse Debugging.
Current multiverse debuggers can be categorized along three dimensions. First, the execution model: offline models of the program or online concrete execution. Second, the way state explosion is handled: not at all, collapsing equivalent states, or reducing the number of paths. Finally, the way they manage the execution state: tracking all states, checkpointing with snapshots, or through traces.
The first multiverse debugger was introduced by Torres Lopez et al. [44] in the context of parallel actor-based systems. It was implemented in the prototype debugger Voyager [11] that operates directly on a language’s operational semantics specified in PLT Redex [5]. In terms of the three architectural dimensions, the multiverse debugger by Torres Lopez et al. [44] operates over a model of the program execution, keeps track of all states in a program, and does not deal with the state explosion problem. Subsequent research has extended multiverse debugging in all three of these areas. Pasquier et al. [32] were the first to address the state explosion problem, introducing user-defined reduction rules to quotient the state space in order to accelerate multiverse-wide breakpoint lookup. In subsequent work [31], they also introduce temporal breakpoints based on linear temporal logic. In contrast, our work does not group together similar nodes, it instead reduces the number of paths in the multiverse by leveraging concolic execution. Both of these approaches are complementary and combining them could be highly beneficial to further improve the practical usability of multiverse debuggers.
The works by Pasquier et al. [32, 31] still operate over a model of the program, and keep track of all states in the quotient state space. In contrast our work uses an online concrete execution model rather than a model of the program execution. The work by Lauwaerts et. al. [24] introduced the first multiverse debugger operating on concrete program executions, the MIO debugger. MIO does not track all program states but instead uses a checkpointing system. The work addresses the challenge of performing Input-Output (I/O) operations with external effects during concrete multiverse debugging. Their solution introduces deterministically reversible primitives with compensating actions, allowing the debugger to step back without creating inconsistent states. However, the work does not deal with the state explosion problem. In contrast to MIO which focusses on IO consistency, our work focusses on the orthogonal problem of state-space pruning. We propose a novel concolic multiverse debugger that intelligently reduces the state-space of nondeterministic programs while maintaining full code coverage. Unlike MIO our work uses a trace-based approach to multiverse debugging instead of using checkpointing which trades reversibility for performance. In particular, our trace-based approach significantly reduces the performance overhead of forward execution in comparison to MIO for programs that use a high frequency of IO operations. While the forward execution performance is improved, exploring alternative paths is slower since this approach requires restarting the execution instead of stepping back.
Exploring Execution Trees.
Exploration of program execution trees is not exclusive to multiverse debuggers. Many analysis tools likewise explore execution trees of programs, such as software model checkers [8, 15], symbolic execution [20, 4, 2], and concolic execution [9, 37, 27]. While these methods excel at identifying program defects automatically, they require an explicit problem specification or program description, typically expressed as a formal model. In contrast debuggers assist developers in finding errors that cannot be precisely formulated, or where the cause of the bug is unknown. We believe that static analysis methods can substantially improve debugging tools by supplying developers with additional information. This is the approach that we took in this paper, where we have focused on how concolic execution can help reduce the state explosion problem [45, 21, 16] by reducing the number of execution paths that the programmer needs to consider in the debugger.
Remote Debugging on Microcontrollers.
The prototype of our concolic multiverse debugger is implemented as a remote debugger on the WARDuino microcontroller virtual machine [23]. Remote debugging is the most widely used approach on embedded systems [34, 38, 39] since it can mitigate some limitations of microcontrollers. In remote debugging [35], a debugger frontend is connected to a remote debugger backend, or stub, running the program being debugged. Instead of a stub, embedded debuggers also commonly rely on dedicated hardware such as the JTAG [1] hardware debugger [13]. However, remote debugging can exacerbate the probe effect [7], and can be very slow since the debugger runs on the microcontroller, combined with constant communication overhead. To address these limitations, a technique called out-of-place debugging, has been proposed [28, 22]. Using this technique, part of the debugger can run on a more powerful machine, reducing debugging interference and improving performance. Our debugger, is currently not a full fledged out-of-place debugger, but inspired by these techniques we offload the static analysis to a more powerful machine. This approach is already sufficiently fast, but a speed-up can likely be achieved by adopting more ideas of out-of-place debugging to increase the amount of code that is offloaded.
Multiverse Analysis.
Analyzing the multiverse of possibilities is more widely known as multiverse analysis, for instance within statistical analysis [40]. Within software development, several frameworks for exploratory programming [18] allow developers to interact with the multiverse of source code versions [42]. Programmers actively explore the behavior of a program by experimenting with different code often through dedicated explore-first IDEs with advanced version control [42, 17]. While explore-first editors consider variations in the program code itself, multiverse debuggers focus on the various possible executions for a single instance of a program. The combination of these two techniques could result in a powerful development environment.
Formalizing Debuggers.
Only a limited collection of works consider formalizing the operation of debuggers, however in recent years the approach first used by [3] has become the most widely used [6, 43, 44, 23, 14]. It defines the operation of a debugger in terms of an operational semantics that encapsulates an underlying language semantics. We have followed the same recipe here since it allows the formalism to explicitly show how the concrete WebAssembly execution relates to the concolic analysis in the debugger.
Recently Holter et al. [14] introduced a novel abstract debugger that leverages static analysis to let developers explore abstract program states instead of concrete ones. The work defines operational semantics for both an abstract and a concrete debugger. The abstract debugger is proved sound with respect to the concrete one; in other words, every concrete debug session is guaranteed to correspond to an abstract session. The converse does not hold because of the over-approximations in the static analysis, so the abstract semantics may admit sessions that cannot occur in the concrete world. In contrast our work leverages concolic execution, which eliminates the need for over-approximation. While the overall debugger is complete because of the existence of a manual operation, we lose completeness of the concolically explored paths, as we must set bounds to analyse infinite programs.
8 Conclusion
In this article, we introduced remote concolic multiverse debugging, a novel hybrid debugging approach which allows pruning the state-space of nondeterministic programs in multiverse debuggers. We have demonstrated the power of this technique by applying it to a diverse set of resource-constrained microcontroller programs, highlighting its ability to improve the debugging process across a wide range of applications. To scale the approach to concrete executions on microcontrollers we developed a remote debugger (on top of the WARDuino VM) that uses a trace-based approach to multiverse debugging rather than the conventional snapshot-based approach taken by previous works. We have formalized this approach and provide a proof of the soundness and completeness. At the heart of our debugging visualisation lies a novel algorithm designed to construct a multiverse of program executions from the results of concolic execution. This algorithm effectively enables a systematic exploration of all execution paths with our debugger.
Our work demonstrates that combining online static analysis with live debugging is the key to managing the large state spaces of complex programs. We believe this structured integration points toward a promising new direction for more effective debugging tools. As the first working example of this approach for microcontrollers, we hope our foundational research will inspire the exploration of a wider design space for debuggers, encouraging the community to pair other static analysis methods with advanced debugging techniques and ultimately advance the way we debug complex software.
References
- [1] IEEE Standard for Test Access Port and Boundary-Scan Architecture. IEEE Std 1149.1-2013 (Revision of IEEE Std 1149.1-2001). doi:10.1109/IEEESTD.2013.6515989.
- [2] Roberto Baldoni, Emilio Coppa, Daniele Cono D’elia, Camil Demetrescu, and Irene Finocchi. A Survey of Symbolic Execution Techniques. ACM Comput. Surv., 51(3):1–39, 2018. doi:10.1145/3182657.
- [3] Karen L. Bernstein and Eugene W. Stark. Operational Semantics of a Focusing Debugger. Electronic Notes in Theoretical Computer Science, pages 13–31, 1995. doi:10.1016/S1571-0661(04)80002-1.
- [4] Cristian Cadar, Patrice Godefroid, Sarfraz Khurshid, Corina S. P ăsăreanu, Koushik Sen, Nikolai Tillmann, and Willem Visser. Symbolic execution for software testing in practice: Preliminary assessment. In Proceedings of the 33rd International Conference on Software Engineering, ICSE ’11, pages 1066–1071, New York, NY, USA, 2011. Association for Computing Machinery. doi:10.1145/1985793.1985995.
- [5] Matthias Felleisen, Robert Bruce Findler, and Matthew Flatt. Semantics Engineering with PLT Redex. Mit Press, 2009.
- [6] GianLuigi Ferrari and Emilio Tuosto. A debugging calculus for mobile ambients. In Proceedings of the 2001 ACM Symposium on Applied Computing, Las Vegas Nevada USA, 2001. ACM. doi:10.1145/372202.380701.
- [7] Jason Gait. A probe effect in concurrent programs. Software: Practice and Experience, pages 225–233, 1986. doi:10.1002/spe.4380160304.
- [8] Patrice Godefroid. Model checking for programming languages using VeriSoft. In Proceedings of the 24th ACM SIGPLAN-SIGACT Symposium on Principles of Programming Languages, POPL ’97, pages 174–186, New York, NY, USA, 1997. Association for Computing Machinery. doi:10.1145/263699.263717.
- [9] Patrice Godefroid, Nils Klarlund, and Koushik Sen. DART: Directed automated random testing. SIGPLAN Not., pages 213–223, 2005. doi:10.1145/1064978.1065036.
- [10] Robbert Gurdeep Singh. Taming Nondeterminism : Programming Language Abstractions and Tools for Dealing with Nondeterministic Programs. PhD thesis, Ghent University, 2022. URL: https://biblio.ugent.be/publication/8767579.
- [11] Robbert Gurdeep Singh, Carmen Torres Lopez, Stefan Marr, Elisa Gonzalez Boix, and Christophe Scholliers. Multiverse Debugging: Non-Deterministic Debugging for Non-Deterministic Programs (Artifact). Dagstuhl Artifacts Series, pages 4:1–4:3, 2019. doi:10.4230/DARTS.5.2.4.
- [12] Andreas Haas, Andreas Rossberg, Derek L. Schuff, Ben L. Titzer, Michael Holman, Dan Gohman, Luke Wagner, Alon Zakai, and JF Bastien. Bringing the web up to speed with WebAssembly. In Proceedings of the 38th ACM SIGPLAN Conference on Programming Language Design and Implementation, PLDI 2017, pages 185–200, New York, NY, USA, 2017. Association for Computing Machinery. doi:10.1145/3062341.3062363.
- [13] Hubert Högl and Dominic Rath. Open on-chip debugger–openocd–. Fakultat fur Informatik, Tech. Rep, 2006.
- [14] Karoliine Holter, Juhan Oskar Hennoste, Patrick Lam, Simmo Saan, and Vesal Vojdani. Abstract Debuggers: Exploring Program Behaviors using Static Analysis Results. In Proceedings of the 2024 ACM SIGPLAN International Symposium on New Ideas, New Paradigms, and Reflections on Programming and Software, Onward! ’24, pages 130–146, New York, NY, USA, 2024. Association for Computing Machinery. doi:10.1145/3689492.3690053.
- [15] Ranjit Jhala and Rupak Majumdar. Software model checking. ACM Comput. Surv., pages 21:1–21:54, 2009. doi:10.1145/1592434.1592438.
- [16] Vineet Kahlon, Chao Wang, and Aarti Gupta. Monotonic Partial Order Reduction: An Optimal Symbolic Partial Order Reduction Technique. In Ahmed Bouajjani and Oded Maler, editors, Computer Aided Verification, pages 398–413, Berlin, Heidelberg, 2009. Springer. doi:10.1007/978-3-642-02658-4_31.
- [17] Mary Beth Kery, Amber Horvath, and Brad Myers. Variolite: Supporting Exploratory Programming by Data Scientists. In Proceedings of the 2017 CHI Conference on Human Factors in Computing Systems, CHI ’17, pages 1265–1276, New York, NY, USA, 2017. Association for Computing Machinery. doi:10.1145/3025453.3025626.
- [18] Mary Beth Kery and Brad A. Myers. Exploring exploratory programming. In 2017 IEEE Symposium on Visual Languages and Human-Centric Computing (VL/HCC), pages 25–29, 2017. doi:10.1109/VLHCC.2017.8103446.
- [19] Muhammad Zahid Khan, Bob Askwith, Faycal Bouhafs, and Muhammad Asim. Limitations of simulation tools for large-scale wireless sensor networks. In 2011 IEEE Workshops of International Conference on Advanced Information Networking and Applications, pages 820–825, New York, NY, USA, 2011. IEEE. doi:10.1109/WAINA.2011.59.
- [20] James C. King. Symbolic execution and program testing. Communications of the ACM, pages 385–394, 1976. doi:10.1145/360248.360252.
- [21] R. Kurshan, V. Levin, M. Minea, D. Peled, and H. Yenigün. Static partial order reduction. In Bernhard Steffen, editor, Tools and Algorithms for the Construction and Analysis of Systems, pages 345–357, Berlin, Heidelberg, 1998. Springer. doi:10.1007/BFb0054182.
- [22] Tom Lauwaerts, Carlos Rojas Castillo, Robbert Gurdeep Singh, Matteo Marra, Christophe Scholliers, and Elisa Gonzalez Boix. Event-Based Out-of-Place Debugging. In Proceedings of the 19th International Conference on Managed Programming Languages and Runtimes, MPLR ’22, pages 85–97, New York, NY, USA, 2022. Association for Computing Machinery. doi:10.1145/3546918.3546920.
- [23] Tom Lauwaerts, Robbert Gurdeep Singh, and Christophe Scholliers. WARDuino: An embedded WebAssembly virtual machine. Journal of Computer Languages, 2024. doi:10.1016/j.cola.2024.101268.
- [24] Tom Lauwaerts, Maarten Steevens, and Christophe Scholliers. MIO: Multiverse Debugging in the Face of Input/Output. Proc. ACM Program. Lang., 9(OOPSLA2), 2025. doi:10.1145/3763136.
- [25] Chao Li, Rui Chen, Boxiang Wang, Zhixuan Wang, Tingting Yu, Yunsong Jiang, Bin Gu, and Mengfei Yang. An Empirical Study on Concurrency Bugs in Interrupt-Driven Embedded Software. In Proceedings of the 32nd ACM SIGSOFT International Symposium on Software Testing and Analysis, pages 1345–1356. ACM, 2023. doi:10.1145/3597926.3598140.
- [26] Amir Makhshari and Ali Mesbah. IoT Bugs and Development Challenges. In 2021 IEEE/ACM 43rd International Conference on Software Engineering (ICSE), pages 460–472, 2021. doi:10.1109/ICSE43902.2021.00051.
- [27] Filipe Marques, José Fragoso Santos, Nuno Santos, and Pedro Adão. Concolic Execution for WebAssembly. In Karim Ali and Jan Vitek, editors, 36th European Conference on Object-Oriented Programming (ECOOP 2022), volume 222 of Leibniz International Proceedings in Informatics (LIPIcs ), pages 11:1–11:29, Dagstuhl, Germany, 2022. Schloss Dagstuhl – Leibniz-Zentrum für Informatik. doi:10.4230/LIPIcs.ECOOP.2022.11.
- [28] Matteo Marra, Guillermo Polito, and Elisa Gonzalez Boix. Out-Of-Place debugging: A debugging architecture to reduce debugging interference. The Art, Science, and Engineering of Programming, pages 3:1–3:29, 2018. doi:10.22152/programming-journal.org/2019/3/3.
- [29] Charles E. McDowell and David P. Helmbold. Debugging concurrent programs. ACM Comput. Surv., pages 593–622, 1989. doi:10.1145/76894.76897.
- [30] Matthias Pasquier, Ciprian Teodorov, Frédéric Jouault, Matthias Brun, and Loïc Lagadec. Debugging Paxos in the UML Multiverse. In 2023 ACM/IEEE International Conference on Model Driven Engineering Languages and Systems Companion ( MODELS-C), pages 811–820, 2023. doi:10.1109/MODELS-C59198.2023.00130.
- [31] Matthias Pasquier, Ciprian Teodorov, Frédéric Jouault, Matthias Brun, Luka Le Roux, and Loïc Lagadec. Temporal Breakpoints for Multiverse Debugging. In Proceedings of the 16th ACM SIGPLAN International Conference on Software Language Engineering, SLE 2023, pages 125–137, New York, NY, USA, 2023. Association for Computing Machinery. doi:10.1145/3623476.3623526.
- [32] Matthias Pasquier, Ciprian Teodorov, Frédéric Jouault, Matthias Brun, Luka Le Roux, and Loïc Lagadec. Practical multiverse debugging through user-defined reductions: Application to UML models. In Proceedings of the 25th International Conference on Model Driven Engineering Languages and Systems, MODELS ’22, pages 87–97, New York, NY, USA, 2022. Association for Computing Machinery. doi:10.1145/3550355.3552447.
- [33] Michael Perscheid, Benjamin Siegmund, Marcel Taeumel, and Robert Hirschfeld. Studying the advancement in debugging practice of professional software developers. Software Quality Journal, 25(1):83–110, 2017. doi:10.1007/s11219-015-9294-2.
- [34] Albert Pötsch, Florian Haslhofer, and Andreas Springer. Advanced remote debugging of LoRa-enabled IoT sensor nodes. In Proceedings of the Seventh International Conference on the Internet of Things, IoT ’17, pages 1–2, New York, NY, USA, 2017. Association for Computing Machinery. doi:10.1145/3131542.3140259.
- [35] Jonathan B. Rosenberg. How Debuggers Work: Algorithms, Data Structures, and Architecture. John Wiley & Sons, Inc., USA, October 1996.
- [36] Tamás Roska. Limitations and complexity of digital hardware simulators used for large-scale analogue circuit and system dynamics. International Journal of Circuit Theory and Applications, 18(1):11–21, 1990. doi:10.1002/cta.4490180104.
- [37] Koushik Sen and Gul Agha. Automated Systematic Testing of Open Distributed Programs. In Luciano Baresi and Reiko Heckel, editors, Fundamental Approaches to Software Engineering, pages 339–356, Berlin, Heidelberg, 2006. Springer. doi:10.1007/11693017_25.
- [38] Gašper Skvarč Božič, Ibai Irigoyen Ceberio, and Albrecht Mayer. In-Field Debugging of Automotive Microcontrollers for Highest System Availability. In Proceedings of the 2nd ACM International Workshop on Future Debugging Techniques, DEBT 2024, pages 2–8, New York, NY, USA, 2024. Association for Computing Machinery. doi:10.1145/3678720.3685314.
- [39] Karl Söderby and Ubi De Feo. Debugging with the arduino IDE 2.0, November 2024. URL: https://docs.arduino.cc/software/ide-v2/tutorials/ide-v2-debugger.
- [40] Sara Steegen, Francis Tuerlinckx, Andrew Gelman, and Wolf Vanpaemel. Increasing Transparency Through a Multiverse Analysis. Perspectives on Psychological Science, pages 702–712, 2016. doi:10.1177/1745691616658637.
- [41] Maarten Steevens, Tom Lauwaerts, and Christophe Scholliers. Remote Concolic Multiverse Debugging - Extended Version with Additional Appendices, April 2026. doi:10.48550/arXiv.2604.23035.
- [42] Bastian Steinert, Damien Cassou, and Robert Hirschfeld. CoExist: Overcoming aversion to change. SIGPLAN Not., pages 107–118, 2012. doi:10.1145/2480360.2384591.
- [43] Carmen Torres Lopez, Elisa Gonzalez Boix, Christophe Scholliers, Stefan Marr, and Hanspeter Mössenböck. A principled approach towards debugging communicating event-loops. In Proceedings of the 7th ACM SIGPLAN International Workshop on Programming Based on Actors, Agents, and Decentralized Control, AGERE 2017, pages 41–49, New York, NY, USA, 2017. Association for Computing Machinery. doi:10.1145/3141834.3141839.
- [44] Carmen Torres Lopez, Robbert Gurdeep Singh, Stefan Marr, Elisa Gonzalez Boix, and Christophe Scholliers. Multiverse Debugging: Non-Deterministic Debugging for Non-Deterministic Programs (Brave New Idea Paper). In DROPS-IDN/v2/Document/10.4230/LIPIcs.ECOOP.2019.27. Schloss Dagstuhl – Leibniz-Zentrum für Informatik, 2019. doi:10.4230/LIPIcs.ECOOP.2019.27.
- [45] Antti Valmari. The state explosion problem. In Wolfgang Reisig and Grzegorz Rozenberg, editors, Lectures on Petri Nets I: Basic Models: Advances in Petri Nets, Lecture Notes in Computer Science, pages 429–528. Springer, Berlin, Heidelberg, 1998. doi:10.1007/3-540-65306-6_21.
- [46] Andreas Zeller. Why Programs Fail: A Guide to Systematic Debugging. Morgan Kaufmann Publishers Inc., San Francisco, CA, USA, September 2005.