NEREUS: An Assistive Decision Support System for Real-Time, Adaptive Route Guidance in Extravehicular Navigation Activities on the Lunar Surface

Abstract
Extravehicular Activity (EVA) is one of the most complex operational endeavors during human lunar exploration. A key aspect of successful operations involves adapting procedures to address unexpected hazards on the lunar surface. Current route mapping systems rely heavily on static navigation planning around craters, high elevations, and extreme weather conditions to accomplish pre-defined mission objectives. However, the high-resolution data necessary for reliable route mapping is often unavailable. To address this challenge, we have designed NEREUS, a Decision Support System (DSS) that helps EVA operators on the ground respond to anomalies faster by simulating multiple alternative routes in parallel and visualizing trade-offs in consumable resources, speed, and safety as well as impact on overall mission timeline. The system offloads computationally intensive tasks like calculating the impact of evolving hazard data, allowing operators to focus on higher-level decision-making.
Keywords and phrases:
Human Computer Interaction (HCI), Adaptive Navigation, Decision Support, Cognitive Load Analysis, Decision Support System, Extravehicular ActivityCopyright and License:
2012 ACM Subject Classification:
Human-centered computing Human computer interaction (HCI) ; Human-centered computing User interface design ; Applied computing AerospaceFunding:
This research was supported by the California Space Grant Consortium (CASGC) and the Donald Bren School of Information and Computer Sciences, University of California, Irvine.Acknowledgements:
We thank the NASA SUITS Program and the STEM Office of Education Engagement at the Johnson Space Center for supporting the research process. We are grateful to our NASA advisors, William Young, and David M. A. Hollaway, Adam Peterson for their guidance and sharing industry insights throughout the design process. We are deeply grateful to the NASA engineers, UX Researchers, and Product Designers at the Johnson Space Center and NASA Ames who contributed their time and insights during our interviews. These experts supported our early understanding of EVA operations and Aerospace industry standards to calibrate trust with autonomous systems.Editors:
Leonie Bensch, Tommy Nilsson, Martin Nisser, Pat Pataranutaporn, Albrecht Schmidt, and Valentina SuminiSeries and Publisher:
1 Introduction
Lunar Extravehicular Activity (EVA) involves risks that necessitate thorough contingency planning, comprehensive training procedures, and precise navigation mapping to ensure a successful mission. The NASA Artemis mission has made clear efforts toward sustainable human presence on the moon, and eventually Mars [24]. Adaptability is crucial in enabling autonomous and safe human operations during EVAs, as current navigation systems still rely heavily on manually mapped, static routes derived from simulated or low-resolution data of the lunar surface. During Apollo 11 in 1969, obstacles undetected during mission pre-mapping extended the descent time 90 seconds, demonstrating how small mapping inaccuracies could jeopardize mission success [13]. Similarly during EVAs, undetected hazards like craters, large rocks, or other surface anomalies may require in-the-moment re-evaluation of pre-planned routes. To address this, we have designed a prototype Decision Support System (DSS) for adapting routes in response to ambiguous risk scenarios, thus allowing operators to evaluate safety and time-critical trade-offs across multiple routes simultaneously. While the prototype is intended primarily for ground EVA operations, it is a first step toward on-surface adaptability by making data more interpretable and making trade-offs more intuitive. This paper describes the design of NEREUS (Navigation, Evaluation, and Route Environment Understanding System)111Nereus is the name of the Greek God of the Sea known for his wisdom and ability to change shapes, which inspired the name of our adaptive navigation system., an adaptive route planning system that supports real-time decision making and lays the groundwork for future human autonomy in space exploration.
1.1 Current Approaches to Navigation
Current maps of the lunar surface captured by the Lunar Reconnaissance Orbiter (LRO) only display elevation accuracy up to 10 meters leaving smaller obstacles undetected [15]. Mapping methods still require operators to design high-detail navigation routes months to years in advance, while NASA spends hundreds of hours to verify hazardous regions on maps, further extending mission timelines [2]. Despite this, topological imagery from the LRO still cannot capture small nuances in the terrain. In response, NASA has developed the Personalized EVA Informatics and Decision Support platform (PersEIDS) to bolster situational awareness and anomaly tracking as a decision support system during navigation [17]. However, because this platform still requires mission control operators to manually compare route data to pre-planned data, the potential remains for significant delays when anomalies are detected.
1.2 Operator Role and Mission Context
Human space missions involve close collaboration between astronauts and support staff on Earth. “Operators” in ground stations such as the Mission Control Center (MCC) at the Johnson Space Center manage logistic plans and communicate procedures to the astronauts. Each operator typically oversees a specific function such as monitoring consumables, mobility, or navigation. Operators and astronauts communicate with each other through shared digital displays and verbal communication. Operators currently use a combination of paper checklists, biometric displays, and verbal updates from other operators to make constant decisions during hours of operation [20]. On top of their existing responsibilities to advance the mission progress and coordinate routes, they are also constantly monitoring the Astronaut Crew’s (hereafter referred to as the “EV Crew”) safety and developing new procedures in the event of emergencies [21].
Operators must contend with a large amount and variety of incoming information, evolving mission contexts and environmental conditions, and the responsibility to make potentially life-and-death decisions. These challenges are compounded by communication delays with the EV crew, which could reach up to 10 seconds in future lunar missions [3]. This leads to confusion and communication gaps which could jeopardize their safety during emergency scenarios. Reducing operator workload and increasing EV crew autonomy are important strategies for reducing risk, building resiliency, and improving mission outcomes.
1.3 Challenges to Decision-Making
The ability to assess hazards and update procedures in real time is crucial during EVAs. The current operator workflow requires a complex timeline including risk assessment, communication across departments and EVA’s, and integrating new procedures into a checklist system [11]. Pre-mapped routes need to be manually evaluated against environmental data like dust storms, changing lighting conditions, and the mission timeline, which slows down risk assessment and delays the mission overall. This evaluation process requires shifting attention across dynamic conditions and evaluating alternative hypotheses, increasing pressure on working memory and preventing the operator from making effective decisions [4].
From a cognitive standpoint, the data evaluation process is often ambiguous and stressful for operators, impacting the quality of their decisions. Operators must evaluate trade-offs and risks based on incomplete and potentially inaccurate data. Accurate assessment requires complex calculations, currently with little computational support. Operators struggle to develop a precise representation of the current mission environment, limiting the effectiveness of their decisions [27]. In EVA operations where data may be delayed or incomplete, manual and optimization-based decisions become risky [5].
The current Mission Control System (MCS) setup includes a Baseline DSS and an Advanced DSS (Marvin), which includes three views on three different screens: Life Support Data Display (LSS) showing biometric data, Timeline Management System displaying the timeline and procedures, and a Communication Log for documenting procedures [20]. Our DSS system complements these existing workflows by integrating a lightweight decision layer focused exclusively on navigation-based trade-offs. While Marvin oversees the entire mission timeline and provides observability over mission progress, NEREUS introduces a spatial reasoning system that allows operators to actively compare contingency plans based on time, resource, and risk impact.
2 Adaptive Navigation System
2.1 Decision Making Workflow
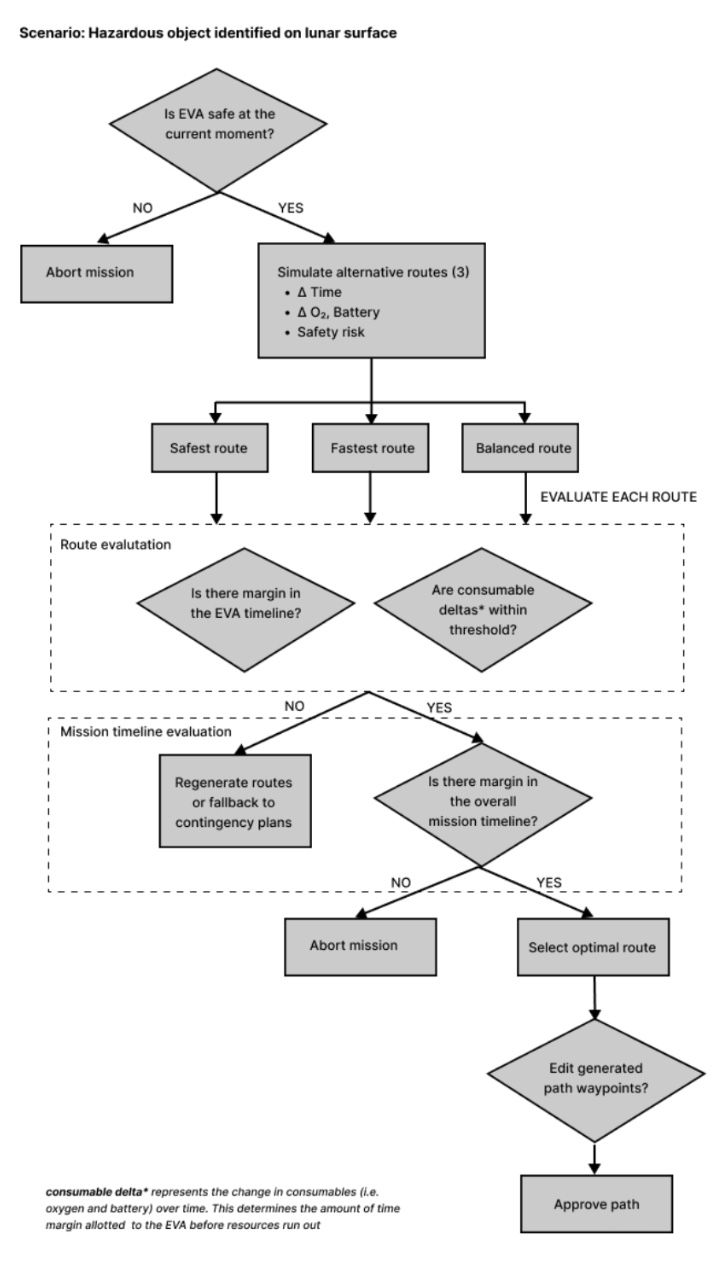
The NEREUS decision-making process will align with the three elements of Endsley’s Situational Awareness (SA) Model, which includes perception of the current situation, comprehension of trade-offs, and prediction of future situations [9]. The NEREUS platform decision tree is outlined in Figure 1, which visualizes the primary decision touchpoints operators encounter during an emergency scenario to select a final adapted route layout.
As an EVA progresses, new and higher-fidelity environmental data will become available from EVA crew reports, real-time video, and other in situ sensors (e.g. high-resolution LiDAR mapping). As new features are detected and added to the mission maps, potentially hazardous objects will be segmented on the Mission Control System (MCS) Map in a color scale based on NASA’s guidelines for Human-Computer Interaction and Interface Design, where red indicates the highest severity and orange indicates a warning (see section 3.4 for more details) [22]. Characteristics of the detected object like the detected rock composition, steepness, and elevation will be displayed on the operator interface. Instead of displaying raw numbers for biometric and battery data, labels will indicate the danger level of each element (i.e. “normal” for safe levels, and “dangerous” for low levels). NEREUS will automatically update assessments of potential navigation routes from available hazard data and current mission status. The system will choose candidate routes that optimize different mission parameters (e.g. safety, speed, and conservation of resources), and present them to the operator with the analysis results for each route. The NEREUS display will support the operator as they make the final decision with the given information and fill in the gaps where the prediction model may fall short.
To maintain mental continuity between the route changes and impact on the procedural timeline, we implemented a mini procedure checklist module on the interface. While it does not fully replicate the full timeline system, it allows operators to quickly reference the impact of route changes on operational execution without crowding the interface. The full interface-level implementation is discussed in section 3.3.
2.2 Route Evaluation System
To support operators in making more timely decisions, we propose a computational route evaluation system that integrates a real-time risk assessment model with a route-mapping system. This system provides dynamic route evaluation based on evolving environment information in order to support more accurate decisions. The core of this system is the Probability of Return Model (PoR), which evaluates the likelihood of an EVA returning to base. To calculate this PoR, the model synthesizes key environmental and astronaut status data to ultimately determine overall risk and mission timeline impact.
2.2.1 Route Generation and Search
The system generates candidate routes through a brute-force A* search algorithm. A* is in the class of path-finding algorithms that support finding an optimal path given various environmental constraints [12]. The A* algorithm has been shown to have a number of advantages, including being able to efficiently find optimal solutions in dynamic environments [30]. The suggested implementation of the A* cost function would penalize hazardous terrain:
| (1) |
where is the cost from the start to node , is the heuristic to the goal (e.g., Euclidean distance), is the risk score at node , and is a tunable weight penalizing high-risk regions.
By running multiple iterations of A* with a distribution of values for , the system is able to comprehensively generate a set of viable routes.
2.2.2 Evaluating Probability of Return
Once routes have been generated, the proposed Probably of Return (PoR) model would generate a risk score for each candidate route. The PoR model is a lightweight machine learning model that relies on a learned weighting system based on various path characteristics identified as key considerations for EVAs (like expected energy cost and oxygen use) [10, 1]. The PoR is estimated as:
| (2) |
where is the sigmoid activation function, is the learned weight vector, is a vector of parameters for the current route, and is a bias term. This model allows for real time risk evaluation of proposed paths.
2.2.3 Route Selection
Finally, the system selects three primary route candidates that optimize for different weightings of speed and safety. The primary candidate routes will include the shortest route (based on distance), the safest route (based on highest PoR), and a balanced route that considers both speed and safety. This trade-off is captured with a composite cost function:
| (3) |
where is the estimated time to traverse path , is the aggregated risk score from the PoR model, and allows operators to tune the priority between speed and safety.
The primary candidate routes will be presented to the operator, who will make the final route selection. Operators can also manually draw alternate routes on the interface, which are then evaluated and assigned a probability of return. This allows greater flexibility and can act as a fallback in the event of errors or un-modeled considerations.
3 Interface Design
3.1 Design Methodology
The interfce design process was curated around two primary goals: a) translating complex data into a more human-understandable representation and b) supporting collaborative decision making across the Operator, Astronaut, and AI. To accomplish these goals, we first experimented with ways to support operators in calibrating their trust in the AI agent. To support collaborative decision making, we designed the system using the human-autonomy teaming approach [16] by borrowing principles of adjustable autonomy systems which allow operators to dynamically override or change AI outputs. This is explained in more detail in section 3.2.
We began the design process by conducting semi-structured interviews with 9 domain experts, including Simulation Engineers, Astronaut trainees, and HCI Researchers from the Johnson Space Center and Ames Research Center. Post-analysis revealed two recurring insights:
-
There is a lack of human-understandable data representation
-
Protocols are fixed and unreliable during emergencies
To address the issue of data understandability and procedure adaptability, we designed the interface in adherence to NASA Design Principles around system transparency and adjustable autonomy outlined in the Human Integration Design Handbook (HIDH) [22]. This includes MIL-STD-1472F Section 5.14, a common military design standard used by the Department of Defense, which outlines computer interface design principles such as clear labels for system status and allowing operators to back out of decisions [6]. Additionally, we applied standard User Interface Design Principles such as visibility over system status and maintaining operator controller outlined in Jakob Nielsen’s Usability Heuristics [25]. These principles helped guide us to create an understandable and fast-to-learn interface.
3.2 Operator-AI Collaboration
To support collaborative Human-AI decision-making during the route selection process, we implemented the Adaptive Calibration Trust Model which continuously tracks and communicates anomalies in the simulated routes to the operator [26]. We designed a digital communication system that facilitates a common operating picture through trust calibration cues (TCC’s) which signal when to rely on the model’s output or intervene. For example, the risk trend lines and color palette for each route card indicate when the model predicts elevated risks and recommends operator input, at which point the operator can either update the path or override it entirely. An explicit text box also points out hazards that cue operators to intervene.
During an emergency rerouting scenario, the model assesses different paths and procedure options to display on the interface (described in section 2.2). Each path is annotated with parts of the path where the model is uncertain to support system transparency. Paths are accompanied by a risk profile where battery, oxygen, and other consumables are represented as change over time, with upwards and downward symbols showing trend over time.

Figure 2 represents the sequence of interactions between the operator and the model used to generate candidate routes. When a new hazard is identified through the EV Crew’s camera feed, an alert will appear on the interface (Interface A). When the operator approves the generation of paths, three candidate routes will appear (as described in section 2.2), each labeled with their corresponding changes to the timeline margin (Interface B). Finally, the operator can select the ideal path based on their personal judgment and draw and additionally draw a boundary around regions they want to be included in the output path (Interface C).
3.3 Information Design
We opted for a single, fully-equipped interface as opposed to progressively disclosing information since this is better aligned with the Flight Controller Problem Solving Model which involves assessing a situation holistically across multiple way-points, procedures, and variables [19]. The path simulation represents one activity, such as ingress, that would be represented on a broader mission timeline for encapsulation. Each route is organized as a card mapped to each stage of the timeline, building on the familiar file-like mental model employed by NASA’s OpenMCT framework [23]. While not widely used for live EVA operations, this model reflects how operators parse through paper timelines and procedures. In order to reflect familiar sequential and temporal mental models, we patterned our decision-making workflow on the procedure checklists common in mission control rooms (see Figure 3 for an example).

We designed the main simulation interface to provide a visualization of the candidate routes with associated route information in order to support appropriate causal reasoning and situational awareness [14, 9]. The interface is shown in Figure 4.

In Figure 5, we show how the procedures module displays modified tasks as interactive cards embedded in the original task list. Added or removed procedures are displayed as new cards on the existing procedure list, which the operator can approve or make revisions on, providing additional decision context and options. Each card also shows the impact on the mission timeline. These task cards support a holistic understanding of the mission timeline while enabling real-time adjustments as the mission progresses.

3.4 Data Layers and Anomaly Representation
The map located at the center of the interface visualizes the terrain, hazards, and chosen routes. Operators can import pre-planned routes and map features into the interface. Craters and terrain features are named based on the International Astronomical Union (IAU) Nomenclature standards which specify common naming conventions [28]. Additionally, we referenced the MIL-STD-2525 symbology standards, a military design standard used by NASA, to represent the map under a shared visual standard such as using Main Supply Route (MSR) symbol set to represent the original path and the Alternative Supply Route (ASR) set to represent all alternate paths [7].
To support rapid anomaly detection, hazardous regions are enclosed in a red polygon based on a combined representation of the terrain measured on steepness, traversability, elevation, weather conditions, and pre-identified risks from the terrain (MIL-STD-2525D Symbol 270200 – Obstacle Zone). In addition, the risk levels are visualized using a color scale derived from the NASA Risk Matrix [8], which is the standard framework for hazard assessment visualized in Figure 6. The operator may also “drill down” on specific elements on the map, such as the waypoints, to view more details about them without overcrowding the main user interface. By representing the terrain based on risk level, this adds an extra layer of context and ultimately supports the selection of paths that optimize for mission safety.

4 Usability Testing
To evaluate the decision-making process of the NEREUS platform, we conducted usability tests with HCI experts and NASA. We aimed to evaluate NEREUS’ performance in decision-making speed, accuracy, and confidence compared to the baseline checklist systems. We also tested the clarity of information displayed, following the “just-in-time” framework to ensure that data is only surfaced when the user needs it to make a decision [8].
We ran 4 synchronous usability tests, each lasting 45 minutes. We presented the participants with the prototype over zoom and observed their interaction patterns as they moved through the screens. We used the following scenario to prime the user before each testing session:
-
Imagine you are a Mission Control Operator at the Houston Mission Control Center, monitoring an ongoing extravehicular activity operation for a team of astronauts on the moon. Your team encounters various hazards in the terrain that require you to reroute the path on the NEREUS decision support interface as the EVA Crew navigates the terrain. Your goal is to help the EVA crew adapt to changing terrain hazards by selecting the most appropriate route using NEREUS.
At the end of the session, we asked each participant to rate their experience with the system on a simplified version of the NASA-TLX Index, which calculates the participant’s cognitive load on a scale of 1 to 7 [18]. We also added two additional parameters to measure the participant’s confidence and trust in the system. The results are shown in Table 1.
| Confidence | Trust | Mental Demand | Effort | Frustration | |
|---|---|---|---|---|---|
| Mean () | 5.25 | 6.0 | 4.5 | 4.0 | 1.5 |
| Std Dev () | 0.356 | 1.414 | 2.121 | 2.829 | 0.707 |
Overall, participants consistently reported high levels of confidence and trust in the system with low frustration levels . However, participants reported varying degrees of mental demand ( = 2.121) and effort ( = 2.829), suggesting that the system requires a higher level of expertise to comprehend. It may benefit from information simplification and adopting a shared language across all NASA employees.
5 Reliability of NEREUS Assessments
There are several challenges such as communication delays, incomplete data, and radiation interferences on data transfer, that impact the reliability of the route predictions. In these circumstances, it’s crucial for the operator to know when they should adjust or override the AI recommendations entirely.
We used a combination of visual, textual, and audio TCCs to communicate uncertainty quickly across multiple dimensions and receive constant signals no matter the focus of attention. For example, a risk trend line is displayed for each generated route card to indicate when operator input is recommended to mitigate high-risk outputs from the model. Following MIL-STD-2525D, uncertainties in the terrain are marked with crosshatch overlays and dashed route segments to indicate regions where the data is incomplete or obstructed. Each route also contains an explicit text summary pointing out risks in the procedure change. This summary is designed to match mental models of standard operating procedures (see Figure 3), supporting quick recognition and recall of procedural best practices. The goal of this system is not to make decisions for the operator but rather to display context-based cues to prompt pattern recognition and recall of operational heuristics, ultimately supporting operators to make better decisions. Displays of the TCCs are shown in Figure 7.

In our user studies, participants consistently noted that the risk indicator bars informed their final decision the most. Multiple participants expressed confusion about technical terminology like MET, time margin, and time remaining and had different interpretations of what each meant. Future designs should incorporate a more standardized terminology system. Visual overlap and mixed interpretations of route colors also made it difficult to quickly identify and compare routes on the map. Future designs should incorporate more customizability like incorporating colorblind-accessible visuals and a set of data layers that fit current mental models like Google Maps. Critical status indicators like oxygen and battery were also overlooked since they were nested under other panels. Future designs should have a persistent display of biometric and status data.
6 Future Work
In the future, we plan to test and validate the design concept in realistic mission environments, improve the current interface, and expand the DSS across more scenarios.
Validation of the DSS and PoR model will be conducted by running live simulation scenarios with expert operators. The goal of this stage is to test the DSS’ ability to adapt during a realistic mission environment and test whether mock operators could effectively simulate and select a new path given a navigation scenario.
Further testing will include validating and extending the Trust Calibration Cues (TCCs). We also plan to incorporate enhancements in symbology and color schemes to align with Web Content Accessibility Guidelines (WCAG) to improve clarity and interpretability of the interface [29].
While the focus of this iteration has been on operator decision making, we are also actively working on developing a companion system to support operator-astronaut communication and autonomous decision making by EV crew. This system will be based on a head-mounted display (HMD) designed to augment the astronaut’s headset by projecting alerts, segmenting hazards, and providing audio decision support. We plan to embed the decision logic outlined in this paper with the HMD.
Finally, we hope to adapt NEREUS to more complex, multi-variable emergencies. While the DSS is currently designed exclusively to support navigation, we plan to extend it to support a wider variety of mission planning tasks and anomaly scenarios (such as communication loss and dust interference). Since the ultimate goal of the Artemis Program is to support sustained human life on Mars, we plan to expand the system to a full autonomy support suite. This will enable expanded adaptation capabilities and semi-autonomous operation with more extensive communication delays.
7 Conclusion
The NEREUS Decision Support System proposes a decision-making framework and corresponding interface for real-time navigation adaptation during anomaly detection. The system presents a hybrid Human-AI Collaborative decision-making framework that employs novel ways to visualize hazards in the terrain and recommend multiple routes in parallel based on key mission-relevant trade-offs. Usability test participants consistently reported reduced frustration and high trust ratings for our system’s final output. However, effort expenditure and complex terminology increased mental effort, presenting an area for future research. Our paper presents an early prototype that can lay the groundwork for future EVA decision tools for ecosystems with higher communication delays under the Artemis Program and future Mars expeditions.
8 Contributions
Jasmine Q. Wu led the conceptualization and design of the NEREUS platform, decision-making framework, and conducted all early user research studies and usability tests. She also led manuscript preparation and supported the design of the PoR model. Andrew J. Hwang contributed to the route simulation model, including the programming logic and display of candidate routes. He also assisted in manuscript preparation. Matthew J. Bietz provided critical feedback and helped shape the research, analysis, and manuscript.
References
- [1] Blaze Belobrajdic, Kate Melone, and Ana Diaz-Artiles. Planetary extravehicular activity (EVA) risk mitigation strategies for long-duration space missions. npj Microgravity, 7(1):16, May 2021. doi:10.1038/s41526-021-00144-w.
- [2] Benjamin D. Boatwright and James W. Head. Shape-from-shading refinement of LOLA and LROC NAC digital elevation models: Applications to upcoming human and robotic exploration of the moon. The Planetary Science Journal, 5(5):124, May 2024. doi:10.3847/PSJ/ad41b4.
- [3] Braided Communications Limited. Enabling effective communication for human space exploration beyond Low Earth Orbit. Technical Report ESA 4000136202/21/NL/GLC/ov, ESA, United Kingdom, February 2023.
- [4] Berndt Brehmer. Dynamic decision making: Human control of complex systems. Acta Psychologica, 81(3):211–241, 1992. doi:10.1016/0001-6918(92)90019-A.
- [5] Yucheng Chen, Pingping Zhu, Anthony Alers, Tobias Egner, Marc A. Sommer, and Silvia Ferrari. Heuristic satisficing inferential decision making in human and robot active perception. Frontiers in Robotics and AI, Volume 11 - 2024, 2024. doi:10.3389/frobt.2024.1384609.
- [6] Department of Defense. Design criteria standard: Human engineering. Technical Report MIL-STD-1472F, Department of Defense, August 1999. URL: https://www.denix.osd.mil/soh/denix-files/sites/21/2016/03/02_MIL-STD-1472F-Human-Engineering.pdf.
- [7] Department of Defense. Interface standard: Joint military symbology. Technical Report MIL-STD-2525D, Department of Defense, June 2014. URL: https://www.jcs.mil/portals/36/documents/doctrine/other_pubs/ms_2525d.pdf.
- [8] Homayoon Dezfuli, Sergio Guarro, Chris Everett, Allan Benjamin, and Mary Coan Skow. NASA risk management handbook version 2.0, part 1. Technical Report NASA SP-2024-3422 Version 2, National Aeronautics and Space Administration, November 2024. URL: https://ntrs.nasa.gov/citations/20240014019.
- [9] Mica R. Endsley. Toward a theory of situation awareness in dynamic systems. Human Factors, 37(1):32–64, 1995. doi:10.1518/001872095779049543.
- [10] Richard K. Fullerton. Advanced EVA roadmaps and requirements. Technical Report Technical Paper 2001-01-2200, SAE, 2001. doi:10.4271/2001-01-2200.
- [11] Jonathan Hall and M. Lutomski. Risk management in EVA. https://ntrs.nasa.gov/citations/20080029983, 2006. Accessed: 2025-05-16.
- [12] Peter E. Hart, Nils J. Nilsson, and Bertram Raphael. A formal basis for the heuristic determination of minimum cost paths. IEEE Transactions on Systems Science and Cybernetics, 4(2):100–107, 1968. doi:10.1109/TSSC.1968.300136.
- [13] Eric M. Jones and Ken Glover. First steps. https://www.nasa.gov/history/alsj/a11/a11.summary.html, 2015. Accessed: 2025-05-16.
- [14] Sangeet S. Khemlani, Aron K. Barbey, and Philip N. Johnson-Laird. Causal reasoning with mental models. Frontiers in Human Neuroscience, Volume 8 - 2014, 2014. doi:10.3389/fnhum.2014.00849.
- [15] Pengying Liu, Xun Geng, Tao Li, Jiujiang Zhang, Yuying Wang, Zhen Peng, Yinhui Wang, Xin Ma, and Qiudong Wang. The generation of high-resolution mapping products for the lunar south pole using photogrammetry and photoclinometry. Remote Sensing, 16(12), 2024. doi:10.3390/rs16122097.
- [16] Joseph B. Lyons, Katia Sycara, Michael Lewis, and August Capiola. Human–autonomy teaming: Definitions, debates, and directions. Frontiers in Psychology, Volume 12 - 2021, 2021. doi:10.3389/fpsyg.2021.589585.
- [17] Timothy McGrath, Jason Norcross, Jon Morris, Federico Piatt, Fernando Figueroa, Brianna Sparks, and Jeffrey T Somers. A decision support system for extravehicular operations under significant communication latency. In 52nd International Conference on Environmental Systems (ICES), number ICES-2023-327 in ICES, 2023. URL: https://ntrs.nasa.gov/api/citations/20230007488/downloads/ICES%202023%20PersEIDS.pdf.
- [18] Kerry M. McGuire, Karen P. Scott, Immanuel Barshi, William H. Paloski, and Kimberly A. Binsted. Human-computer interface design for extended space missions. Technical Report NASA/TM-2000-209614, NASA Johnson Space Center, 2000. URL: https://ntrs.nasa.gov/api/citations/20000021488/downloads/20000021488.pdf.
- [19] Kaitlin McTigue, Tina Panontin, John Karasinski, Shu-Chieh Wu, Megan Parisi, and Alonso Vera. Information representations for crew-led operations beyond low-earth orbit. In 2024 IEEE 10th International Conference on Space Mission Challenges for Information Technology (SMC-IT), pages 50–55, 2024. doi:10.1109/SMC-IT61443.2024.00013.
- [20] Matthew J Miller, Cameron W Pittman, and Karen M Feigh. Next-generation human extravehicular spaceflight operations support systems development. In 68th International Astronautical Congress, Adelaide, Australia, 2017. URL: https://www.researchgate.net/publication/320290594_Next-Generation_Human_Extravehicular_Spaceflight_Operations_Support_Systems_Development.
- [21] Matthew James Miller, Kerry M. McGuire, and Karen M. Feigh. Decision support system requirements definition for human extravehicular activity based on cognitive work analysis. Journal of Cognitive Engineering and Decision Making, 11(2):136–165, 2017. PMID: 28491008. doi:10.1177/1555343416672112.
- [22] NASA. Human integration design handbook (HIDH), revision 1. Technical Report NASA/SP-2010-3407/REV1, National Aeronautics and Space Administration, June 2014. Accessed: 2025-05-16. URL: https://www.nasa.gov/wp-content/uploads/2015/03/human_integration_design_handbook_revision_1.pdf.
- [23] NASA. Open mission control technologies (open mct arc-15256-1d [software], 2014. URL: https://software.nasa.gov/software/ARC-15256-1D.
- [24] NASA. Nasa’s plan for sustained lunar exploration and development, 2020.
- [25] Jakob Nielsen. Enhancing the explanatory power of usability heuristics. In Beth Adelson, Susan T. Dumais, and Judith S. Olson, editors, Conference on Human Factors in Computing Systems, CHI 1994, Boston, Massachusetts, USA, April 24-28, 1994, Proceedings, pages 152–158. ACM, 1994. doi:10.1145/191666.191729.
- [26] Kazuo Okamura and Seiji Yamada. Adaptive trust calibration for human-AI collaboration. PLOS ONE, 15(2):1–20, February 2020. doi:10.1371/journal.pone.0229132.
- [27] Herbert Alexander Simon. Models of bounded rationality: Empirically grounded economic reason, volume 3. MIT press, 1997.
- [28] USGS. Gazetteer of planetary nomenclature [website]. URL: https://planetarynames.wr.usgs.gov/.
- [29] W3C Web Accessibility Initiative. Web content accessibility guidelines 2.2, December 2024. URL: https://www.w3.org/TR/WCAG22/.
- [30] Hong-Mei Zhang, Ming-Long Li, and Le Yang. Safe path planning of mobile robot based on improved A* algorithm in complex terrains. Algorithms, 11(4), 2018. doi:10.3390/a11040044.