PShapeTrace: Linking Drawing Instructions with Visual Outcomes in Processing

Abstract
Processing is a Java-based programming language designed to facilitate learning programming through visual arts and creative coding. However, beginners must simultaneously learn both the programming language itself and image-processing concepts such as coordinate systems, making it challenging to understand the correspondence between drawing instructions and their visual outcomes. To help beginners analyze the drawing process in their code, this study proposes a tool named PShapeTrace that observes the execution of Processing programs and visualizes the relationship between drawing instructions and their results. A user study was conducted to evaluate the tool. Participants reported that the tool was useful for completing programming tasks. The resulting System Usability Scale (SUS) score was 72.75, indicating acceptable usability.
Keywords and phrases:
Traceability, dynamic analysis, graphical user interfaceFunding:
Takashi Ishio: JSPS KAKENHI No.JP20H05706.Copyright and License:
2012 ACM Subject Classification:
Software and its engineering Integrated and visual development environments ; Software and its engineering Maintaining softwareSupplementary Material:
Software: https://github.com/fun-se/PShapeTracearchived at
Editors:
Jonathan Edwards, Roly Perera, and Tomas PetricekSeries and Publisher:
1 Introduction
Processing is a programming language and development environment designed to facilitate learning programming [10]. It is based on Java but provides a simplified integrated development environment (IDE), allowing users to write, save, and execute interactive visual programs in a straightforward manner while iteratively observing the results. Processing enables the introduction of software concepts within the context of the arts [11]. Studies have shown that even beginners can write programs that generate complex images using variables and conditional statements [7]. The authors’ department also incorporates Processing into its introductory programming courses. In these courses, students develop interactive programs such as brick-breaking games and graph visualization applications while learning fundamental programming concepts, including variables, operations, data types, conditional expressions, loops, and arrays [9].
Interactive visual applications are engaging but present unique challenges. First, students must grasp the screen coordinate system and other graphical mechanisms while simultaneously learning programming concepts [8]. For beginners unfamiliar with coordinate systems, predicting the placement of shapes based on numerical coordinates can be difficult. Second, logical errors may cause shapes to appear in unintended locations. Since an application’s state depends on the sequence of drawing instructions and user commands, understanding and debugging visual applications can be particularly challenging [2, 5].
To address these issues, it is important to present the relationship between changes in the user interface state and the corresponding code that caused them [5, 13]. Since interactive programs often require significant time and effort to reproduce a specific state, enabling users to quickly restore and verify program states is also highly beneficial [2].
In this study, we propose PShapeTrace, a tool that helps students understand the relationship between their programs and their visual output when using Processing. Specifically, the tool is implemented as a file integrated into a target program; it records the execution of drawing functions and displays a list of these function calls alongside the main canvas. When a user selects a coordinate on the canvas with the mouse, the tool highlights the corresponding function call responsible for rendering the shape at that location. Additionally, the tool maintains a history of rendered frames, allowing users to review and verify previous frames. These features enable users to confirm that each drawing function behaves as expected.
2 Background
2.1 Processing language
Processing is initially created to serve as a software sketchbook [10]. Although it is based on Java and shares its fundamental features and syntax, Processing allows for a more concise syntax by omitting class definitions and other structural elements. For example, the following program creates a 500×500 white canvas and draws a line from the center to the mouse cursor’s position:
  void setup() {
    size(500, 500);
  }
  void draw() {
    line(width/2, height/2, mouseX, mouseY);
  }
The setup function is invoked once at the beginning of the program, while the draw function runs continuously on each frame to update the canvas. Built-in variables such as mouseX and mouseY capture the current mouse position so that graphical interactions can be implemented easily. Compared to Java, Processing provides a more accessible way to produce graphical output with minimal code, making it suitable for beginners with no prior programming experience.
Processing programs are edited and executed using the Processing Development Environment (PDE). The PDE treats a directory as a program. Source files with the .pde extension in the directory are automatically recognized as part of a single program.
Processing programs are compiled into Java bytecode and executed. The generated code is a subclass of PApplet, which provides built-in functions like line and text as Java methods. User-defined methods, such as setup and draw, are automatically invoked by the generated code.
2.2 Related Work
Several tools have been proposed to support the development of graphical applications. Santos [12, 13] introduced GUITA, a tracing tool that links UI components to their corresponding source code. This system allows users to click on UI widgets created during program execution and navigate directly to the relevant lines of source code. Additionally, users can inspect all code segments that influence a given widget. However, this approach assumes that UI components are created as objects (specifically using the SWT library). As a result, it cannot be directly applied to Processing programs, where frames are rendered dynamically through drawing functions rather than object-based components.
Ko et al. [6] proposed Whyline, a tool that links the visual output of a program to its runtime behavior. To enable users to focus on programming without needing to learn syntax, the tool maintains a list of instructions and graphical entities that users can control, similar to those in Scratch and Snap. Therefore, the tool can utilize graphical properties such as the sizes and positions of these entities to generate questions. However, the approach is not applicable to Processing, as we aim to allow programmers to use arbitrary drawing instructions.
Chan et al. [3] proposed DRT, a tool that monitors the state of GUI programs and tracks the sequence of function calls executed when a GUI state changes. Dang et al. [4] extended this approach to dynamic applications such as games. They developed a tool that identifies the instruction sequences responsible for screen changes. Our tool shares similarities with these systems but offers a more granular mapping between individual graphical elements (e.g., rectangles and lines) and their corresponding drawing functions. This distinction arises because prior studies focus on Feature Location [14], which helps developers locate the implementation of complex GUI functionalities. Our study aims to analyze the execution of individual function calls.
Huang et al. [5] introduced a debugging environment leveraging Live Programming techniques to assist in diagnosing GUI-related bugs in web applications. Their system tracks changes in the Document Object Model (DOM) and CSS, enabling users to trace the execution sequence and analyze view transitions in real time. They reported that this approach significantly reduces debugging time. Although their target applications differ, our study shares the same goal of enabling real-time program analysis during execution.
3 PShapeTrace
This study proposes PShapeTrace, a tool for inspecting how shapes on a screen are rendered through drawing function calls. The following sections describe the installation process, the tool’s main features, and its limitations. To illustrate its functionality, we use a breakout game, which is part of a first-year programming course [9]. When executed without the tool, the program opens a window as shown in Figure 1. It then arranges square bricks at the top, displays a player-controlled paddle at the bottom, and represents the ball as a rectangle in the middle.
3.1 Tool Installation


The tool is implemented as a source file that integrates into a target program for analysis. It overrides built-in drawing functions of the Processing language, such as text and rect, which are defined in the PApplet class. These overriding methods record function calls and execute the original behavior of the built-in functions.
The installation process consists of the following steps:
-
1.
Place the tool file (tool.pde) in the same directory as the program’s source files. The Processing Development Environment (PDE) automatically recognizes the tool file as part of the target program.
-
2.
Add the method call extraSettings(); to the setup method. This initializes the tool by detecting the window size set by the size method and preparing a dedicated area for the tool interface.
-
3.
Rename the draw method in the target program to drawMain. This allows the tool to override the draw method.
The installation process is designed for first-year computer science students who may be unfamiliar with configuring operating systems and applications. Since the tool requires only basic file operations and minor code modifications, it avoids complex setup steps such as plugin installations. Additionally, the presence of the tool in the source code makes it clear whether it is active or not.
3.2 Tool Features
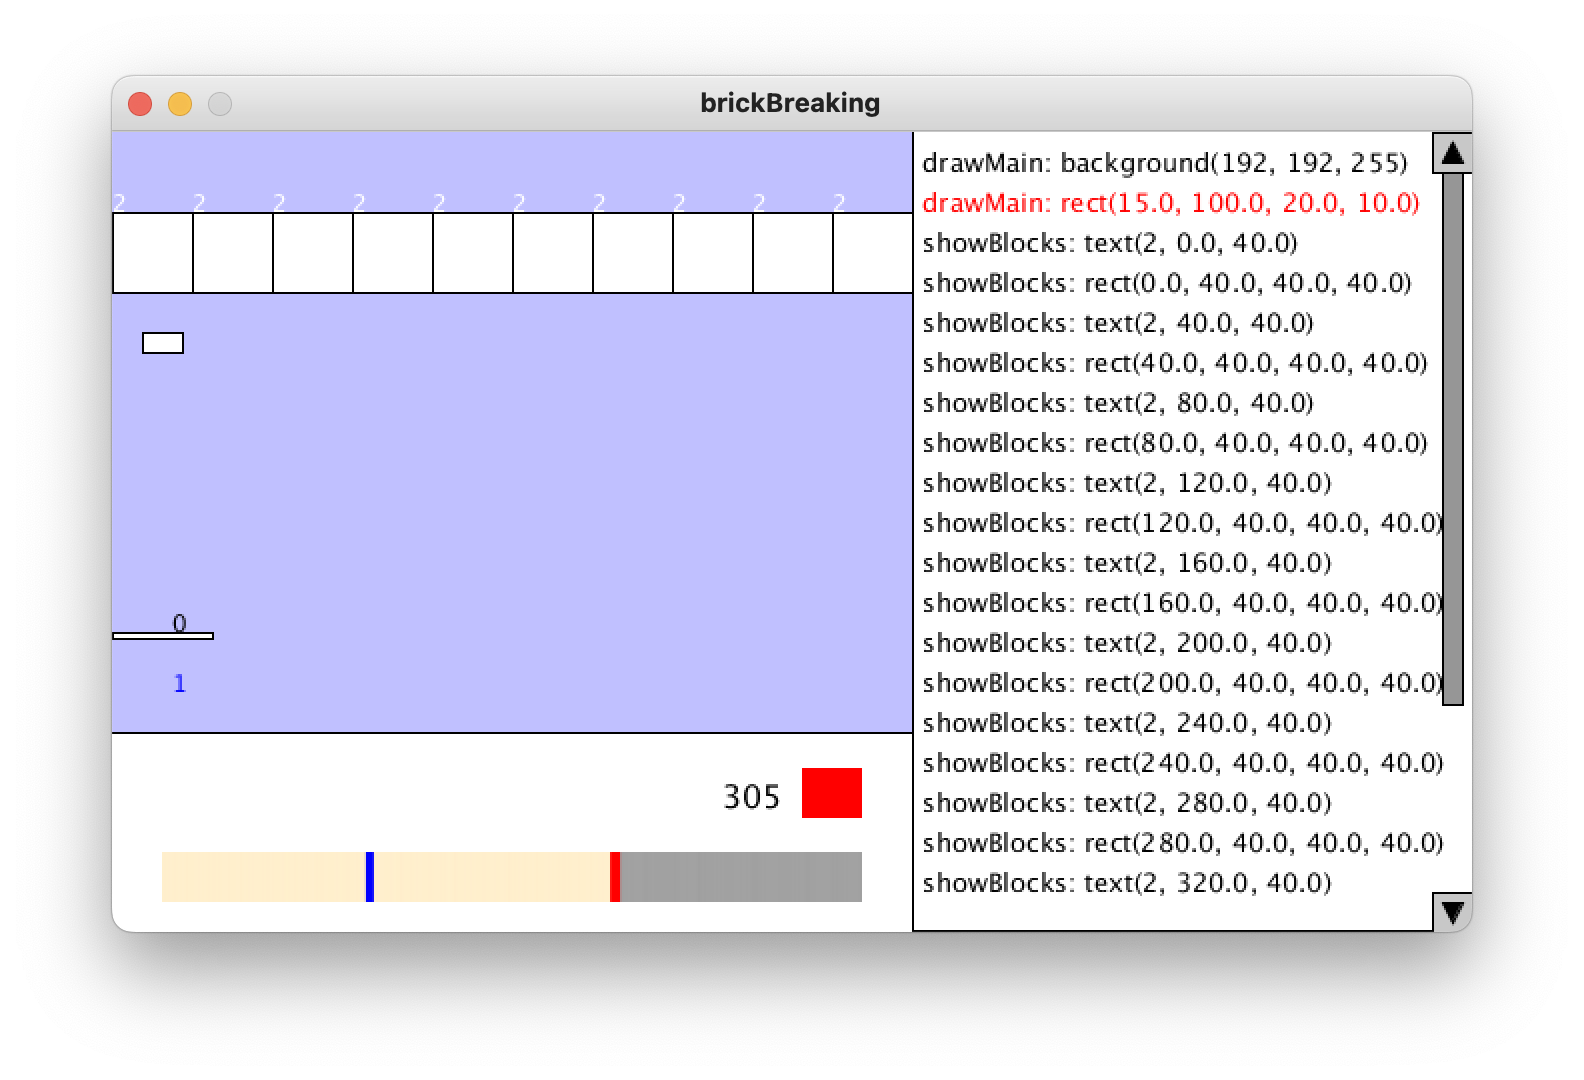
Figure 2 shows a screenshot of the breakout game running with the tool. The original program’s execution area appears in the upper left of the window. The tool records drawing function calls and their actual parameters, and then displays these recorded function calls on the right side. For example, the first line on the right indicates that the drawMain function calls the background function with three integer arguments. Displaying function calls as a simple list was based on the assumption that first-time users could comprehend it without prior training and map it directly to the code they had written. The tool recognizes a frame by detecting calls to the background method, which clears the window content. The function call list represents how the current frame is rendered.
The tool also provides an interface for handling execution history at the bottom of the window. This section includes the current frame number, a timeline, and a pause button. The timeline visualizes recorded frames, where a blue bar marks the current frame, and beige indicates past frames. To manage memory usage efficiently, the tool retains the function calls and rendered images of the most recent 1,024 frames, discarding older ones.
In addition to the function call list, the tool offers three interactive features:
-
Pause Button: Clicking the pause button suspends the program’s drawing process by skipping the drawMain function. Clicking it again resumes execution. This feature allows users to inspect the current frame in detail. Figure 3 shows a screenshot with execution paused. The red pause button indicates that drawing is suspended.
-
Replaying a Past Frame: Clicking on the timeline replays a past frame by displaying the recorded image and function calls, enabling users to inspect previous states. In Figure 3, the blue bar in the timeline represents the currently selected past frame, while the red bar highlights the latest frame. Users can also navigate frames using the left and right arrow keys.
-
Highlighting a Function Call: Clicking a shape in the program area highlights its corresponding function call in red. In Figure 3, clicking on the ball rectangle located on the left side highlighted a rect function that rendered the shape. The function call indicates that it was executed within the drawMain function with four actual parameters. If multiple shapes overlap, repeated clicks on the same location cycle through the shapes sequentially.
These features help users quickly analyze how their code generates graphical output, enhancing their understanding of programming concepts.
3.3 Limitations
The tool is integrated into a target program, which runs as a standalone application. This approach prevents interaction between the program and the Processing Development Environment (PDE). For example, the tool cannot trace a function call in the function call list back to its corresponding line in the PDE editor. Instead, it only has access to line numbers from a temporary Java source file generated during compilation. Exploring better interaction methods while maintaining ease of installation is part of our future work.
The tool also has several limitations due to its implementation:
-
Incompatibility with dynamic window resizing: The tool assumes a fixed window size and does not support programs that dynamically change window dimensions.
-
Potential timing disruptions: The pause button may interfere with timing calculations in programs that rely on timers.
-
Interference with mouse and keyboard inputs: Mouse and keyboard interactions with the tool may be captured by the program’s mousePressed and keyTyped methods, potentially leading to unexpected behavior.
-
Restriction on overriding built-in functions: Users cannot override Processing’s built-in functions because they are already overridden by the tool.
-
Error messages referencing the tool file: A syntax error in the target program may produce an error message pointing to a line in the tool file rather than the original source code.
We believe these limitations are not significant concerns for introductory courses.
4 Evaluation
To assess the proposed tool, we conducted two experiments:
- Experiment 1:
-
Evaluates the tool’s performance overhead, which may affect the learning experience of students.
- Experiment 2:
-
Investigates the tool’s usefulness through a user study.
The following subsections describe these experiments in detail.
4.1 Experiment 1: Performance Measurement
The proposed tool introduces overhead in terms of processing speed and memory consumption, as it observes the execution of a target program and adds functionality to visualize drawing functions. We measure the tool’s impact on frame rate (FPS) and maximum heap memory usage.
4.1.1 Methodology
We selected three target programs used in our department’s programming courses:
-
Breakout Game [9]: A game where the player controls a paddle to bounce a moving ball, aiming to hit and remove bricks by reducing their durability. The program includes multiple drawing functions and animations, covering many fundamental Processing concepts.
-
Graph Drawing: This program reads numerical data from a text file and generates a bar chart accordingly. Although the data processing and graph rendering could be completed in a single frame at startup, the program redraws the graph every frame for this experiment.
-
Analog Clock: Based on the official Processing sample program Clock111https://processing.org/examples/clock.html, this program displays an analog clock with hour, minute, and second hands.
All programs were configured to use a 400×300 pixel canvas and executed without user interactions (e.g., mouse input). The tool retains the most recent 1,024 frames in memory.
For each program, we measured the frame rate over the first 1,024 frames based on timestamps of background method calls, which indicate the beginning of each frame. To collect data, we added time-recording functionality to the target programs and executed each with and without the tool. Maximum heap memory usage was measured using the MemoryMXBean.getHeapMemoryUsage API, a part of the Java Management Extensions (JMX) in the JDK.
For program compilation, we used Processing version 3.5.4. The execution environment was Java HotSpot 64-Bit Server VM (version 25.202-b08) running on a MacBook Pro 13-inch (2019) with an Intel Core i5 Quad-Core 1.4 GHz processor and 8 GB of 2133 MHz LPDDR3 memory.
4.1.2 Results
| Program | Avg. function | Frame Rate (FPS) | Max Memory Usage (MB) | ||
|---|---|---|---|---|---|
| calls per frame | Without Tool | With Tool | Without Tool | With Tool | |
| Breakout Game | 25 | 59.86 | 57.34 | 26.1 | 1207.6 |
| Graph Drawing | 8 | 59.99 | 57.48 | 26.8 | 1150.1 |
| Analog Clock | 5 | 60.01 | 57.57 | 19.5 | 1217.0 |
Table 1 summarizes the results. The tool caused a maximum frame rate drop of 4.22%, which is a minor impact on overall execution. However, storing the history of 1,024 frames resulted in a significant increase in memory consumption, regardless of the number of drawing function calls. This memory usage is primarily due to storing rendered frame images. As modern low-cost computers typically have 8 GB of RAM, this level of memory consumption is manageable. However, optimizing data recording for larger display sizes remains an area for future work.
4.2 Experiment 2: Usability Evaluation
Since Experiment 1 confirmed that the tool’s performance impact is minimal, we proceeded to evaluate its usability in Processing programming tasks.
4.2.1 Methodology
We asked participants to complete a series of programming tasks to incrementally develop a simple game. The participants were 10 undergraduate students from Future University Hakodate, all of whom had completed a Processing programming course that included Breakout Game and Graph Drawing assignments. They had acquired basic skills in Processing and had prior experience programming without the support tool, which enabled them to reflect on and compare the experience with and without the tool.
The experiment was conducted using a series of web forms implemented in Google Forms. The first section included a consent form and a tool installation task. The subsequent sections contained four programming tasks. Upon completing and submitting each task, participants were automatically redirected to the next section. Finally, participants filled out a survey to provide feedback and evaluate the tool’s usability using the System Usability Scale (SUS) [1].
Programming Tasks


We designed the tasks based on a coursework assignment in our department. Participants started with a simple program and gradually built a complete game. The difficulty increased progressively, aligning with lecture topics such as conditional statements and loops.
The specific tasks are as follows.
-
1.
Drawing Static Shapes (20 min): Create a program that displays shapes in a 200×200 pixel window as shown in Figure 5.
-
2.
Implementing Moving Circles (30 min): Develop two features:
-
(a)
A circle that follows the mouse within the window (Figure 5).
-
(b)
A circle that moves at a constant speed, reflecting upon collision with the window’s edges.
-
(a)
-
3.
Constructing a Simple Game (40 min): Based on Task 2, create a simple game where the player (a mouse-controlled circle) must avoid opponent circles moving across the screen (Figure 7). This task consists of three subgoals:
-
(a)
Implement a collision detection function for circles.
-
(b)
Introduce a health (HP) system, where HP decreases upon collision with an opponent.
-
(c)
Display HP and elapsed time on the screen.
-
(a)
-
4.
Extending the Game (50 min): Enhance the game with three new features (Figure 7):
-
(a)
Randomize the initial x-coordinates of opponents.
-
(b)
Introduce a delay before opponents appear after the program starts.
-
(c)
Increase the number of opponents: Every 120 frames, an additional opponent appears, up to a maximum of 10 opponents on the screen.
-
(a)
Figure 7 shows the expected final program. We provided animated GIFs to help participants understand the expected behavior.
To prevent excessive fatigue, we limited the time for each task. If participants exceeded the time limit, they were instructed to proceed to the next task. Each task description included a solution program from the previous task, allowing participants to continue even if they could not complete a task.
4.2.2 Survey
For each task, participants rated the usefulness of individual tool features (Function Call List, Highlighting, Pause, and Replay) and the tool’s overall usefulness. Ratings were collected on a 6-point scale: Very useful, Moderately useful, Neutral, Slightly useful, Not useful at all, and Unused. Additionally, participants provided qualitative feedback on each feature.
After completing all tasks, participants evaluated the tool using the System Usability Scale (SUS) [1].
4.2.3 Results
Figure 8 shows the completion rates for each task. The results indicate that the tasks were not easy to complete within the time limit, suggesting that tool support may be beneficial.
Figure 9 presents the usefulness ratings for each feature. Across all tasks, over 50% of participants rated the Function Call List as “very useful” or “moderately useful.” Additionally, in all tasks except Task 1, more than 50% of participants found the overall tool usefulness to be “very useful” or “moderately useful.” The lower rating in Task 1 is likely due to the lack of animations, as the task only involved static shape placement, reducing the need for tool-assisted debugging.
Participants provided a range of feedback on the tool’s usefulness:
-
Function Call List and Highlighting:
-
–
Helped verify coordinates and debug unexpected behavior since it visualizes the current coordinates even when objects were moving.
-
–
Useful for confirming randomized values (e.g., Task 4’s randomized opponent positions).
-
–
Some participants suggested that highlighting shapes in the execution screen corresponding to a selected function call in the list would improve clarity.
-
–
-
Pause and Replay:
-
–
Essential for verifying object movement and iteration logic.
-
–
Helped debug collision detection (Task 3) by allowing frame-by-frame analysis.
-
–
Allowed verification of spawn timing (Task 4), which would have been impossible by eye alone.
-
–
-
Overall Usefulness:
-
–
Enhanced confidence in program correctness and made debugging more systematic.
-
–
Became increasingly useful as tasks grew more complex, particularly for programs involving multiple moving objects.
-
–
It should be noted that the feedback varied across participants. Some found the tool helpful, while others did not feel the need to use it, suggesting that individual differences in programming skills and tool familiarity influenced the results.
The average SUS score was 72.75, indicating acceptable usability. A SUS score of 70 or higher is generally considered an indicator of good usability, suggesting that the tool meets usability standards.
The highest SUS score among participants was 90, while the lowest was 47.5. The median score was 78.75, meaning that half of the participants rated the tool at or above the acceptable level. The standard deviation was 16.09, reflecting some variability in participants’ perceptions of the tool’s usability.
Participants’ responses to individual SUS statements provide further insight into their experience with the tool:
-
80% of participants “somewhat agreed” or “strongly agreed” with the statement: “I think I would like to use this system frequently.”
-
70% of participants positively responded to: “I thought the system was easy to use.”
-
50% of participants “somewhat agreed” or “strongly agreed” with the negative statement: “I needed to learn a lot of things before I could get going with this system.”
These results suggest that while most participants found the tool usable and beneficial, some required additional learning before they could use it effectively.
5 Conclusion
This study developed a visualization tool to help beginner programmers understand the relationship between drawing functions and their visual output in Processing. Experiment 1 confirmed that the tool does not significantly impact performance. The tool is suitable for classroom use. Experiment 2 demonstrated that its features were helpful for completing programming tasks and that its usability was acceptable. We have shared the tool with faculty members in our department and other universities who teach programming courses using Processing.
In future work, we plan to investigate the challenges involved in Processing programming and identify effective tool support strategies through additional case studies. Another future direction is addressing limitations arising from the tool’s implementation as a source file, exploring alternative approaches for improved flexibility.
References
- [1] Aaron Bangor, Philip Kortum, and James Miller. Determining what individual SUS scores mean: adding an adjective rating scale. Journal of Usability Studies, 4(3):114–123, May 2009. URL: https://uxpajournal.org/wp-content/uploads/sites/7/pdf/JUS_Bangor_May2009.pdf.
- [2] Brian Burg, Richard Bailey, Amy J. Ko, and Michael D. Ernst. Interactive record/replay for web application debugging. In Proceedings of the 26th annual ACM symposium on User interface software and technology, pages 473–484, 2013. doi:10.1145/2501988.2502050.
- [3] Keith Chan, Zhi Cong Leo Liang, and Amir Michail. Design recovery of interactive graphical applications. In Proceedings of 25th International Conference on Software Engineering, pages 114–124, May 2003. doi:10.1109/ICSE.2003.1201193.
- [4] Clarence Dang, Anh Vinh Le, Amir Michail, Kim Cuong Pham, Tran Quan Pham, Nicholas Seow, Anuraag Sridhar, and Jasper Timm. Design recovery of real-time graphical applications using video. In Proceedings of 20th IEEE International Conference on Software Maintenance, pages 338–347, 2004. doi:10.1109/ICSM.2004.1357819.
- [5] Ruanqianqian Lisa Huang, Philip J. Guo, and Sorin Lerner. UNFOLD: Enabling Live Programming for Debugging GUI Applications . In Proceedings of 2024 IEEE Symposium on Visual Languages and Human-Centric Computing, pages 306–316, September 2024. doi:10.1109/VL/HCC60511.2024.00041.
- [6] Amy J. Ko and Brad A. Myers. Designing the whyline: A debugging interface for asking questions about program behavior. In Proceedings of the SIGCHI Conference on Human Factors in Computing Systems, pages 151–158, April 2004. doi:10.1145/985692.985712.
- [7] Mihaela Malita and Ethel Schuster. From drawing to coding: Teaching programming with processing. Journal of Computing Sciences in Colleges, 35(8):245–246, April 2020. doi:10.5555/3417639.3417663.
- [8] Jeanine Meyer. Programming 101: Learn to Code with the Processing Language Using a Visual Approach. Apress, 2nd edition, 2022.
- [9] Yoshiaki Mima. Discussion on the way of computer programming education: 8. Programming education for the first-year undergraduates at Future University Hakodate. Information Processing, 57(4):370–373, 2016. [in Japanese]. URL: https://ipsj.ixsq.nii.ac.jp/records/158102.
- [10] Processing Foundation. Processing – overview. https://processing.org/overview, accessed on August 5, 2024.
- [11] Casey Reas and Ben Fry. Processing: A Programming Handbook for Visual Designers and Artists. The MIT Press, 2nd edition, 2014.
- [12] André L. Santos. GUI-driven code tracing. In Proceedings of 2012 IEEE Symposium on Visual Languages and Human-Centric Computing, pages 111–118, September 2012. doi:10.1109/VLHCC.2012.6344495.
- [13] André L. Santos. GUI code tracing through direct program interaction. Journal of Software: Evolution and Process, 26(6):552–568, June 2014. doi:10.1002/smr.1650.
- [14] Jinshui Wang, Xin Peng, Zhenchang Xing, and Wenyun Zhao. An exploratory study of feature location process: Distinct phases, recurring patterns, and elementary actions. In Proceedings of 2011 27th IEEE International Conference on Software Maintenance, pages 213–222, September 2011. doi:10.1109/ICSM.2011.6080788.