Exploration and Complexity Management in Graph-Based Programming Environments

Abstract
Programmers often rely on different environments depending on the nature of their tasks. For large-scale software projects, IDEs help manage complexity through structured abstractions like files, modules, and classes, and provide tools for code visualization and navigation. In contrast, exploratory programming tasks – such as data analysis, rapid prototyping, and design space exploration – are better served by interactive environments like REPLs and Notebooks, which support incremental development and immediate feedback. However, these tools tend to prioritize either complexity management or exploration, limiting their effectiveness across contexts.
This paper investigates a hybrid graph-based programming environment that bridges these two modes by building on Incremental Graph Code (IGC), a graph-based system for structuring, visualizing, and interacting with source code. We explore how IGC can support both complexity management and exploratory programming through three key features: projectional views for aggregating and navigating interrelated code and documentation, graph-type nodes for encapsulating subgraphs to manage structural complexity, and an exploratory programming view for managing branching executions and promoting experimentation. Together, these features suggest that graph-based environments like IGC can offer a unified platform for both systematic software engineering and dynamic, exploratory development.
Keywords and phrases:
Graph-based Programming Environments, Exploratory Programming, Complexity Management, Incremental Graph Code (IGC), Projectional ViewsCopyright and License:
2012 ACM Subject Classification:
Software and its engineering Integrated and visual development environments ; Software and its engineering Software development techniquesSupplementary Material:
Software (Source Code): https://github.com/incremental-graph-code/igc/ [5]archived at
Editors:
Jonathan Edwards, Roly Perera, and Tomas PetricekSeries and Publisher:
1 Introduction
As software systems expand in size and complexity, developers face challenges retaining an overview of code structure, keeping track of (internal) dependencies, and maintaining modularity [2, 24]. These challenges are particularly prevalent in large-scale projects where the number of modules, functions, and components can quickly become overwhelming, often stifling the dynamic, exploratory practices that drive creative problem-solving.
Software engineers are typically supported by Integrated Development Environments (IDEs) in their development/maintenance activities by widgets or features to visualize and navigate the structure and interconnections within the code. For smaller tasks, such as quick tests and library, data, or design space exploration, programmers benefit from interactive, incremental programming with small code fragments. In support of these more short-lived tasks, programmers receive immediate feedback from Read-Eval-Print-Loop (REPL) interpreters and Notebooks.
The aforementioned programming tools tend to prioritize one type of programming activity over the other with IDEs used for large software projects, REPLs and Notebooks for quick explorations beneficial for data science and programming education.
A hybrid environment that tries to capture the complexity management constructs from IDEs and the incremental, exploration features of REPLs and Notebooks would benefit all programmers as it would allow for functionality that is typically difficult to realize in their respective coding environments. Towards a unified programming environment and experience, this paper investigates the use of a graph-based environment – consisting of various types of nodes (e.g., code and documentation) and edges (e.g., dependency and execution order) – to structure, visualize, and interact with source code.
This paper builds upon the work done in the graph-based programming environment Incremental Graph Code (IGC). Previous work focused on the initial design/structure and incremental programming features. In this paper, we focus on extending IGC by supporting exploratory programming features typical of REPLs and Notebooks, and complexity management tools inspired from IDEs.
To that end, this paper describes and evaluates the following three features of IGC:
-
Projectional views over source code allow developers to aggregate and analyze various projections of the code base chasing, for example, documentation-, dependency-, and execution-relations.
-
Graph-nodes serve as an abstraction and encapsulation mechanism to embed (sub-)graphs as nodes in (super-) graphs, hiding implementation details and allowing for arbitrary nesting of code graphs as a means to manage complex code bases.
-
Exploratory programming view session-management enables fine-grained manipulation of executions, allowing users to explore, derive, and compare execution paths.
These enhancements build on the established benefits of both effective complexity management and exploratory programming. Studies on complexity management indicate that techniques such as encapsulation and intuitive software visualization can reduce cognitive load and improve navigation of intricate code bases [30, 31]. Research on exploratory programming shows that iteratively refining and comparing alternative code versions can provide deeper insights and more creative solutions [29, 16].
This paper makes the following contributions:
-
Further exploring the practicality of a graph-based approach to structuring, visualizing and interacting with code bases is introduced together with specific features to simultaneously:
-
–
manage and comprehend large, complex code bases
-
–
enable experimentation through incremental and exploratory programming
-
–
The features are evaluated through three case studies derived from usage scenarios inspired by prior work. The first case study compares PescaJ [25], a projectional editor for Java, with the projectional views of IGC. The second case study compares pseudo-UML/Architectural diagrams with how IGC’s graph nodes encapsulate and nest these diagrams as a means to manage complexity. The third case study compares an Exploratory Programming GUI [38] with IGC to compare the exploratory programming features each offers.
Our paper is structured as follows. We will first give an overview of some key concepts and an overview of IGC in Section 2. Next, Section 3 will describe the proposed extensions to IGC, focusing on complexity management and exploratory programming features. Section 4 will present the three case studies that evaluate the effectiveness of IGC. Finally, Section 5 will discuss the contributions, practicality, limitations, and future work of the proposed extensions to IGC.
2 Background
The following section provides an overview of the concepts discussed throughout this paper and an overview of IGC.
2.1 Graph-based Programming Environments (GBPEs)
We define graph-based programming environments (GBPEs) as a type of programming environment that uses a graph structure to represent code and relationships between code fragments. GBPEs can be seen as an extension to typical computational notebooks, which are linear documents that contain code, documentation, and visualizations; typical computational notebooks present code in one dimension, whereas GBPEs present code in two dimensions. An interesting middle ground between computational notebooks and GBPEs is discussed in “Exploring Organization of Computational Notebook Cells in 2D Space” [20], where Harden et al. explore the benefits of organizing computational notebook cells in a 2D space. The 2D layout affords non-linear code narratives and admits a form of branching not supported by conventional Notebooks. Their user studies reveal that users indeed take advantage of the 2D structure and that the layout promotes exploratory programming.
Another example of reorganizing code fragments in a 2D layout is Code Bubbles [10]. Code Bubbles is a programming environment that organizes code fragments in a 2D space, allowing developers to group and organize code bubbles in various ways. The evaluation shows that the approach has the potential to help users with a wide range of development tasks, including reading, editing, and navigating source code. In particular, users have been shown to spend significantly less time navigating when performing tasks related to understanding code [11]. While the ideals in organizing code in Code Bubbles are similar to a GBPE, it lacks the ability to define distinct relationships throughout the code base.
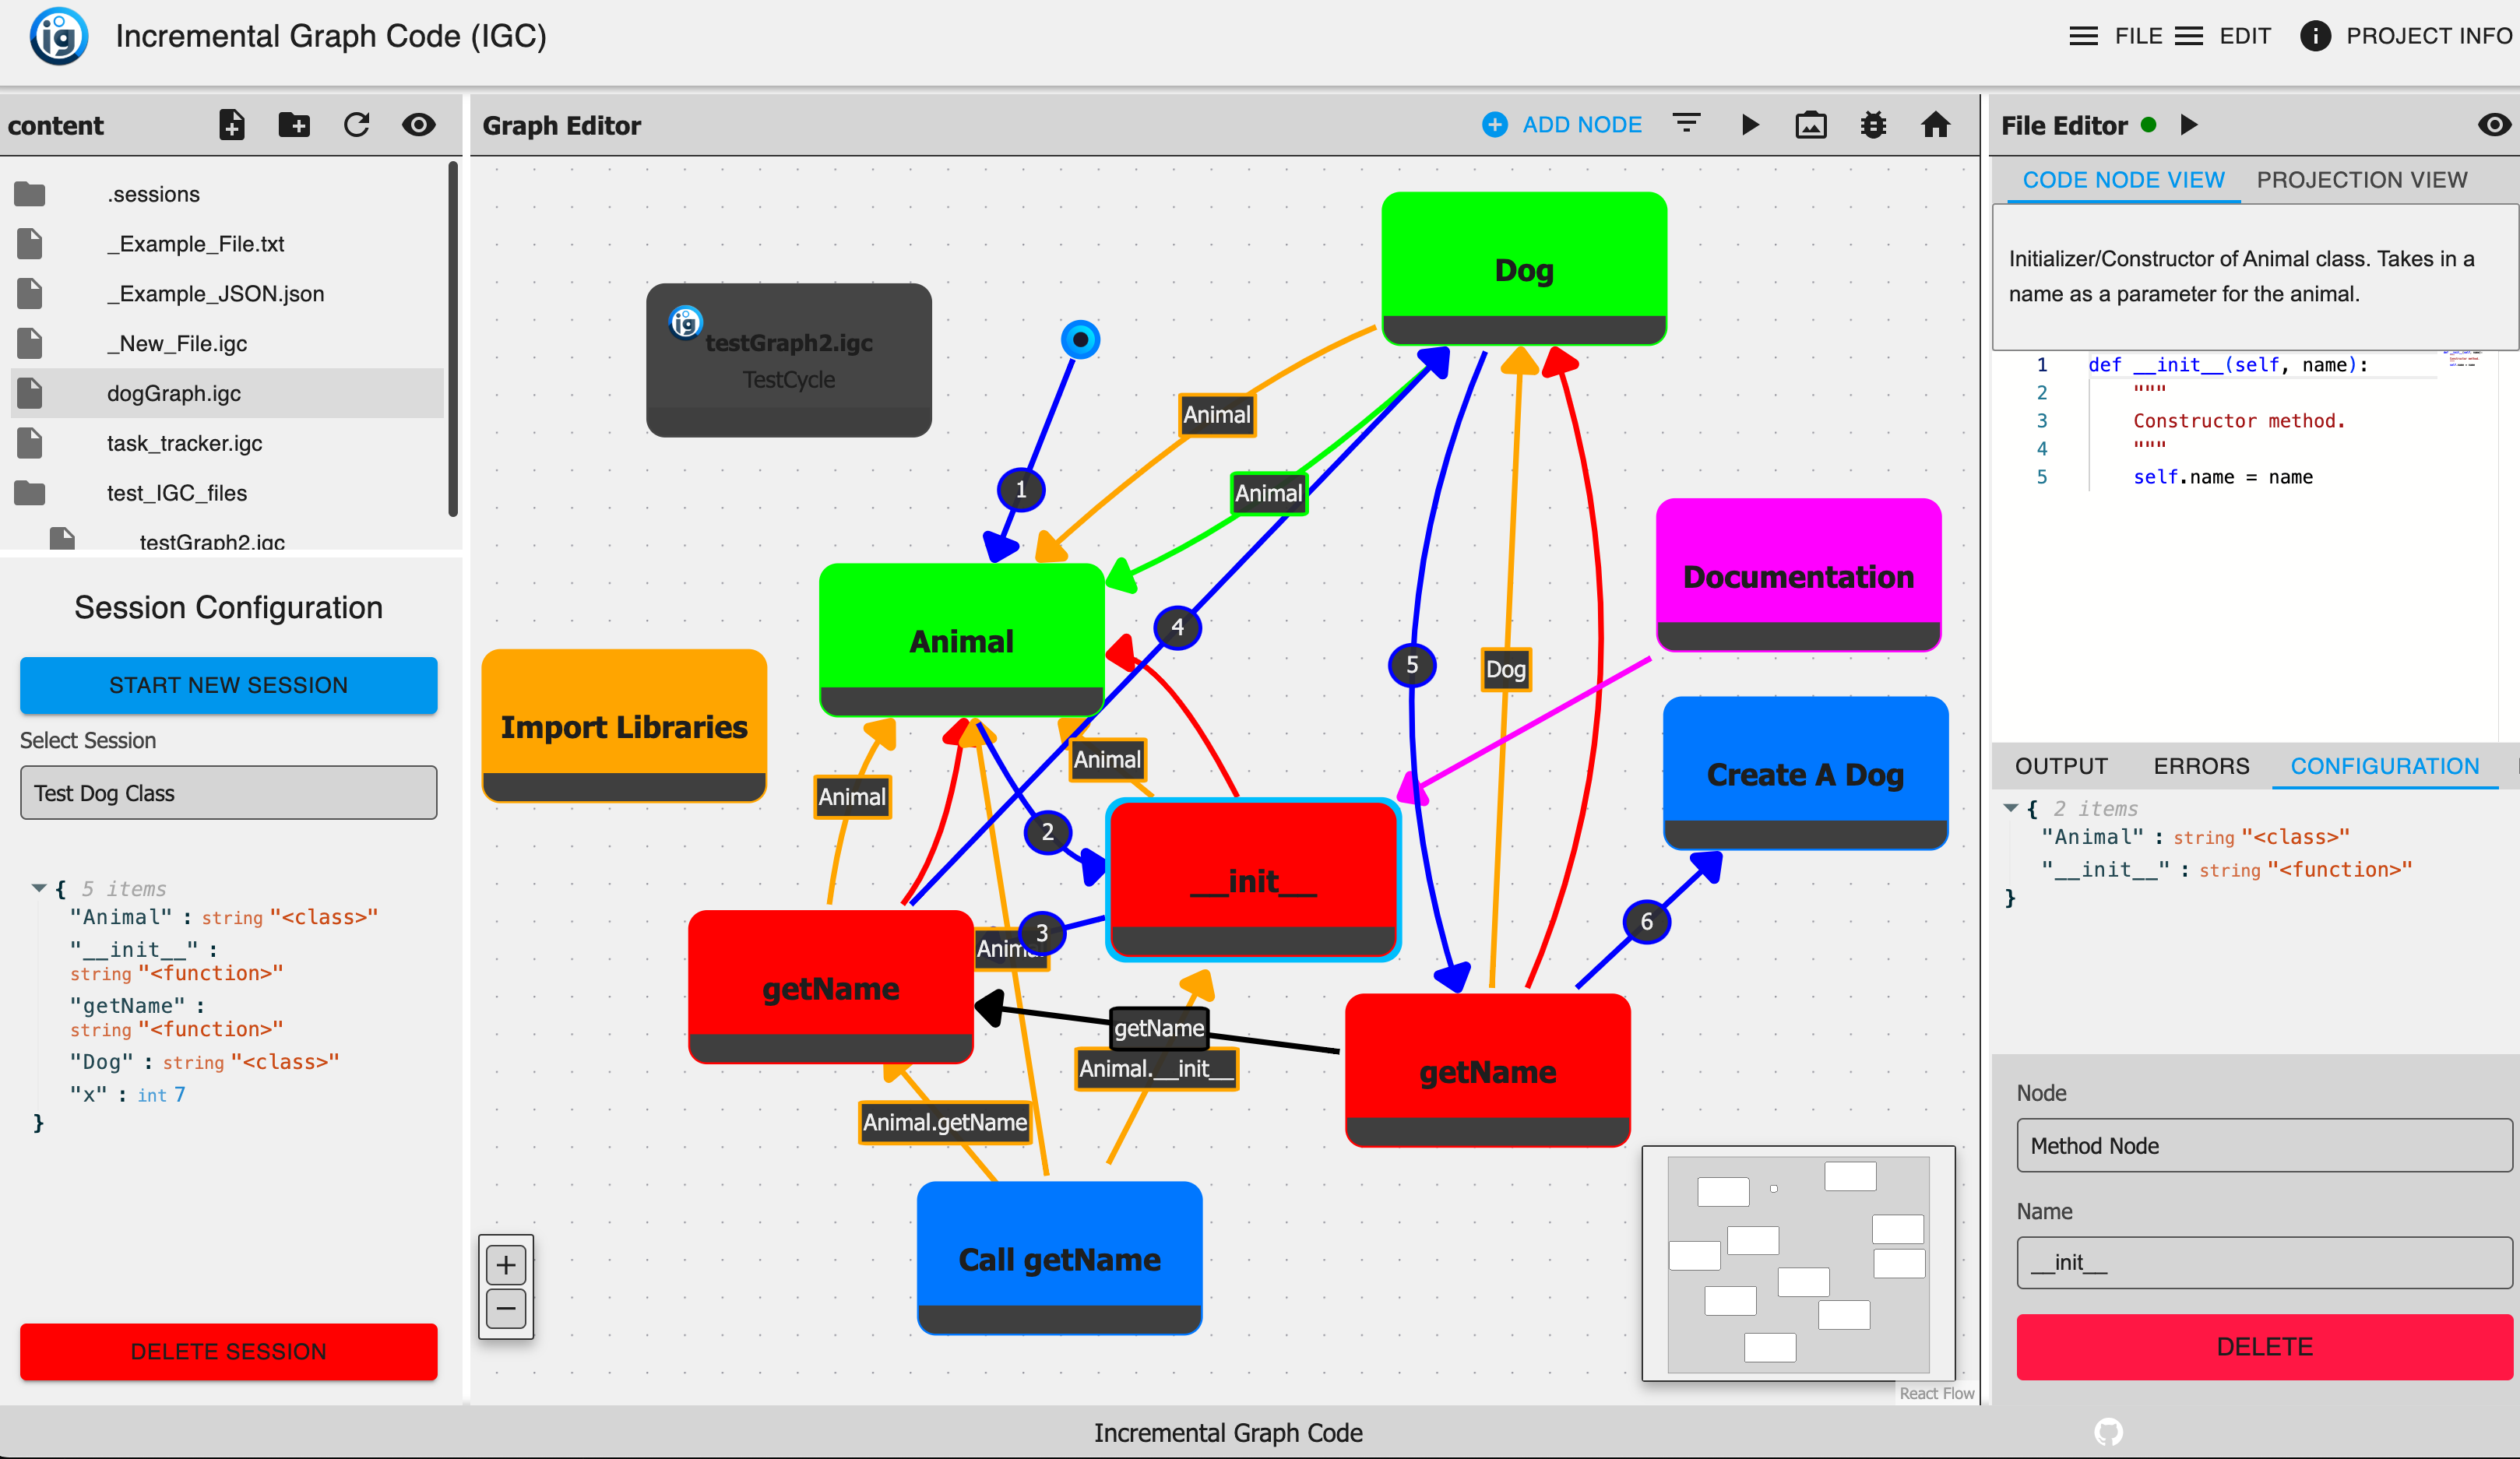
Incremental Graph Code (IGC) [6] (shown in Figure 1) is our example of a GBPE. This programming environment is built around representing different aspects of a code base in a graph. Nodes capture individual code fragments, documentation, and higher-level constructs (e.g., classes and methods), and edges denote relationships such as execution order, dependencies, and associations between code and documentation.
The initial work of IGC was focused on first creating a prototype that allowed users to create programs in graph-based environment. This work was focused on how to structure, visualize, and interact with code in a graph-based environment. The prototype was built as a full-stack web application with three main views: a file navigator, a graph editor, and a customizable view. Similarly to an IDE, the file navigator allows user to navigate through the code base and open files. The graph editor allows users to edit the graphical representation of the code base while defining various new nodes and relationships. The customizable view would allow users to have a representation of specific aspect of the graph. For example, if a “code fragment” node is selected, the customizable view would show an editor to manipulate and execute the corresponding code.
Although currently IGC only supports Python, the underlying graph structure is not language-specific. A future update will introduce a language manager that will allow users to define and interact with different programming languages. It is important to note that IGC is not a programming language itself, but rather an environment to create and execute code in a graph-based manner. In the same way computational notebooks are not a programming language, but rather an environment to create and execute code in a incremental manner. Similarly to Jupyter computational notebooks, IGC’s graph structure is defined by a JSON-formatted file containing a list of all the nodes and edges. This file is then used to create the graph structure in the environment.
A key focus throughout the development of IGC was ensuring it was extensible. A user can add new node types, relationships, and views without modifying the core codebase. This extensibility is achieved through an add-on manager that automatically detects and integrates new components that can be used in the environment’s user interface. Allowing users to create new node types and relationships enables them to tailor the environment to their specific needs for whatever use case they are working on.
The functionality explored in the initial work of IGC was focused on realizing incremental programming features in the graph-based environment and comparing this to a computational notebook. The work showed that the graph-based environment could be used to create and execute code in a similar manner to a computational notebook, but while also making the structure and interdependencies of large-scale projects explicit, as seen in traditional IDEs. To handle the execution throughout the graph, each execution path is tracked through what we define as a session, allowing programmers to branch off or revisit earlier states and compare different outcomes. All session start at at null state represented by the start node. A “session manager” is just below the file navigator to allow users to manipulate and get an overview of the current session. Although the previous work does not exhaustively define the concepts of exploratory programming or complexity management, IGC demonstrates that a unified, graph-based representation can potentially support both rapid experimentation and effective handling of complex software systems within a single, extensible environment.
2.2 Exploratory Programming
In 1983, Beau Shiel, a manager at Xerox’s AI Systems, popularized the term “Exploratory Programming” to describe the challenges of applying rigid software development lifecycles to experimental AI code [36]. In open-ended tasks, where a program’s behavior cannot be fully defined in advance, exploratory programming is a great practice to actively experiment with various code possibilities and discover workable solutions along the way [4]. The style of exploratory programming involves experimenting with different versions of the same code fragment and responding to the observed effects (e.g. modifying and executing a code cell in a notebook multiple times). Various approaches have been investigated to better support exploratory programming in Notebooks [23] or programming environments in general [38].
One approach to supporting exploratory programming is to allow developers to manipulate execution paths to explore and understand alternative branches of program evolution. This approach enables developers to test different scenarios by altering the sequence of code execution. Instead of modifying and executing one specific cell, a developer might also choose to execute an alternative cell to observe how the two compare based on their outputs. This flexibility facilitates deeper insights into how various parts of the code interact. Ideally, outputs from these different execution paths can be easily compared, providing clear and immediate feedback on how changes impact the code’s behavior [29].
In “A Generic Back-End for Exploratory Programming” [16], a generic approach for supporting exploratory programming in programming environments is suggested in which an execution graph keeps track of previously visited program states to which the programmer can return, similar to the record-keeping required for omniscient debugging [9].
2.3 Complexity Management
Complexity can be defined in many different ways in the scope of software engineering. Most software metrics define complexity specific to a project including number of statements, McCabe’s cyclomatic number [27], Halstead’s programming effort [19], and the knot measure [41, 40]. This project is focused on a programming environment instead of any specific project, so we will focus on how to manage complexity in a general sense. When we refer to complexity, we will be referring to the complexity of the code structure and how it is managed in the programming environment.
For structural complexity, we will be relating to the complexity model of object-oriented systems [37], specifically when it comes to encapsulation, and the reduction of cognitive load by simplifying the interface [30, 15]. Ejiogu refers to this type of structural complexity as “structuredness” [14].
The management of the system through analysis and visualization tools will be another aspect of complexity management. The goal of software visualization is to provide knowledge of a system, program artifacts, and understanding of their relationships [31]. By limiting the data needed to analyze software, we can therefore reduce the complexity of the data shown [33].
3 IGC extensions
This section gives an overview of the proposed extensions to IGC, categorized as enhancing “complexity management” and “exploratory programming”. Concrete usage scenarios and screenshots detailing the features are part of the case studies in Section 4.
Complexity Management
-
Projection View: IGC now supports a projection view that allows developers to aggregate and visually navigate interrelated code and documentation fragments. This view provides a high-level overview of the codebase, enabling developers to quickly identify and explore different parts of the project. The currently supported projections include: Dependency Graph, Execution Path, and Class Hierarchy.
-
Graph Node: Developers can now encapsulate code fragments into higher-level constructs to reduce clutter and improve code readability. They do this by creating an IGC file (a JSON file that describes the graph structure) that defines the encapsulated code along with an associated session. The feature encourages modularity by letting developers encapsulate different components (e.g., classes, libraries, or subsystems) in separate graphs and then compose them into a larger architecture. Graph Nodes offer an abstraction mechanism akin to classes/objects and modules, encapsulating both data and behavior. The user can double-click on the node to expand it and view the contents. This feature is particularly useful for organizing large codebases and managing complex interdependencies.
-
Graph Node View: A new view was added to IGC that allows developers to interact with graph nodes. This view provides a detailed overview of the node’s contents, including the path to the IGC file, the associated session, and a quick overview of the effects of the graph node.
Exploratory Programming
-
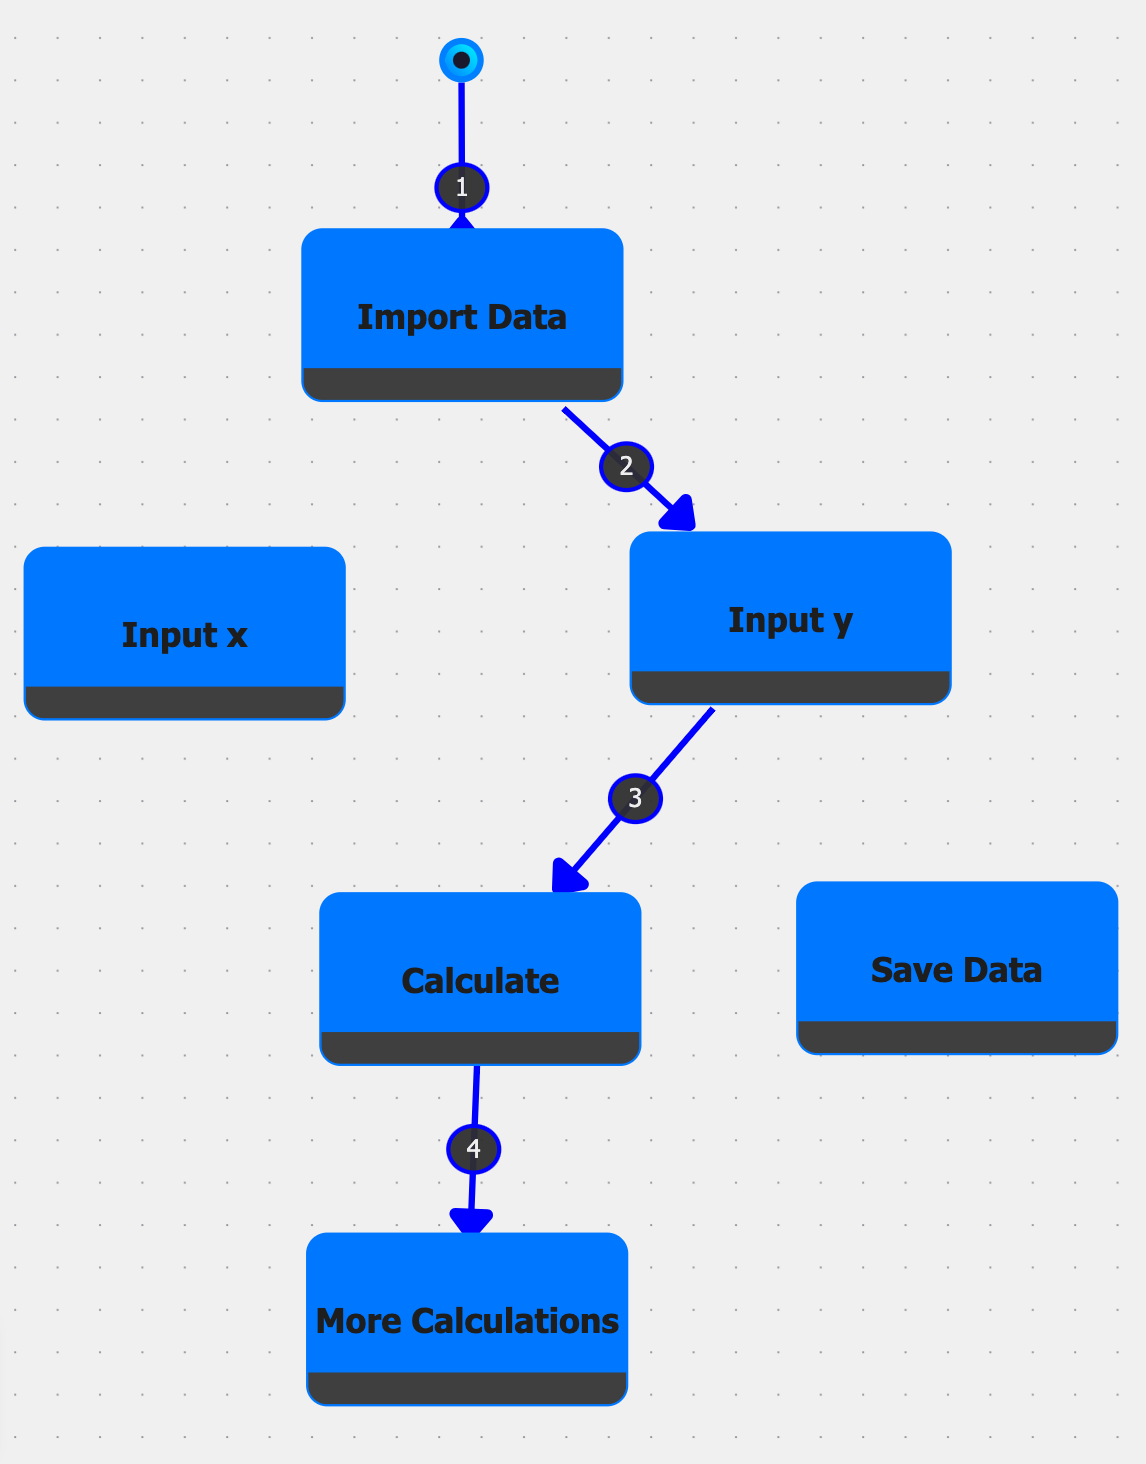
Exploratory Programming View: A new session management view was added to IGC. The exploratory programming view in IGC is a specialized interface for managing and visualizing different execution paths, or sessions, as a tree. When users switch to this view, they see a tree laying out the different sessions as branches starting from an initial start node. The branch determines the order in which code nodes are executed in this session. This layout helps identify where sessions overlap and diverge, offering insights into shared versus unique execution paths. Right-clicking on a node in the current (active) session opens a context menu with operations such as Start Session from Here, Insert Before Node, Insert After Node, and Replace Node, allowing users to rapidly branch off, modify, or swap existing code nodes. These actions generate new sessions while preserving the old ones, thereby making it easy to compare outputs or revert to earlier states. Through this view, developers can fine-tune their code incrementally, explore alternative implementations, and maintain a clear record of all executed paths without losing previous work.
4 Case Studies
Three small case studies, based on existing literature and technologies, were conducted to evaluate different aspects of managing complexity and supporting exploratory programming. Each case focused on a distinct dimension of these challenges, providing a basis for comparison with the features and interactions offered by IGC. For each case, we implemented similar programs in IGC, allowing us to contrast user views and interactions across scenarios. By analyzing the advantages and limitations observed in each case, we highlight how IGC – and GBPEs in general – can succeed or fail at supporting exploratory programming and complexity management.
4.1 PescaJ
This case study examines PescaJ [25], a projectional editor for Java that aggregates scattered code and documentation into unified views. By allowing developers to look at a program from multiple perspectives, PescaJ addresses the complexity of large software systems where navigating interdependencies and associated documentation can be challenging [21]. This approach helps developers mitigate cognitive load by consolidating related information, a benefit especially noticeable when debugging or familiarizing oneself with unfamiliar code [35].
PescaJ departs from linear text-based editors by storing code in a representation distinct from the displayed views. Users can create customizable workspaces to juxtapose both methods and their Javadoc across multiple classes, enabling a higher-level understanding of the system structure. Code views, for example, place dependent methods side by side, while documentation views aggregate scattered comments. The combination helps maintain synchronization between code and its documentation, boosting productivity and comprehension.
In a traditional IDE, a developer might jump between files to update interdependent methods and their documentation. By contrast, PescaJ consolidates these elements in a single workspace. When a method call is selected, the corresponding method’s code and documentation are displayed alongside, reducing the need for tedious navigation. This workspace approach makes it easier for teams to ensure that documentation stays in sync with the code it describes.
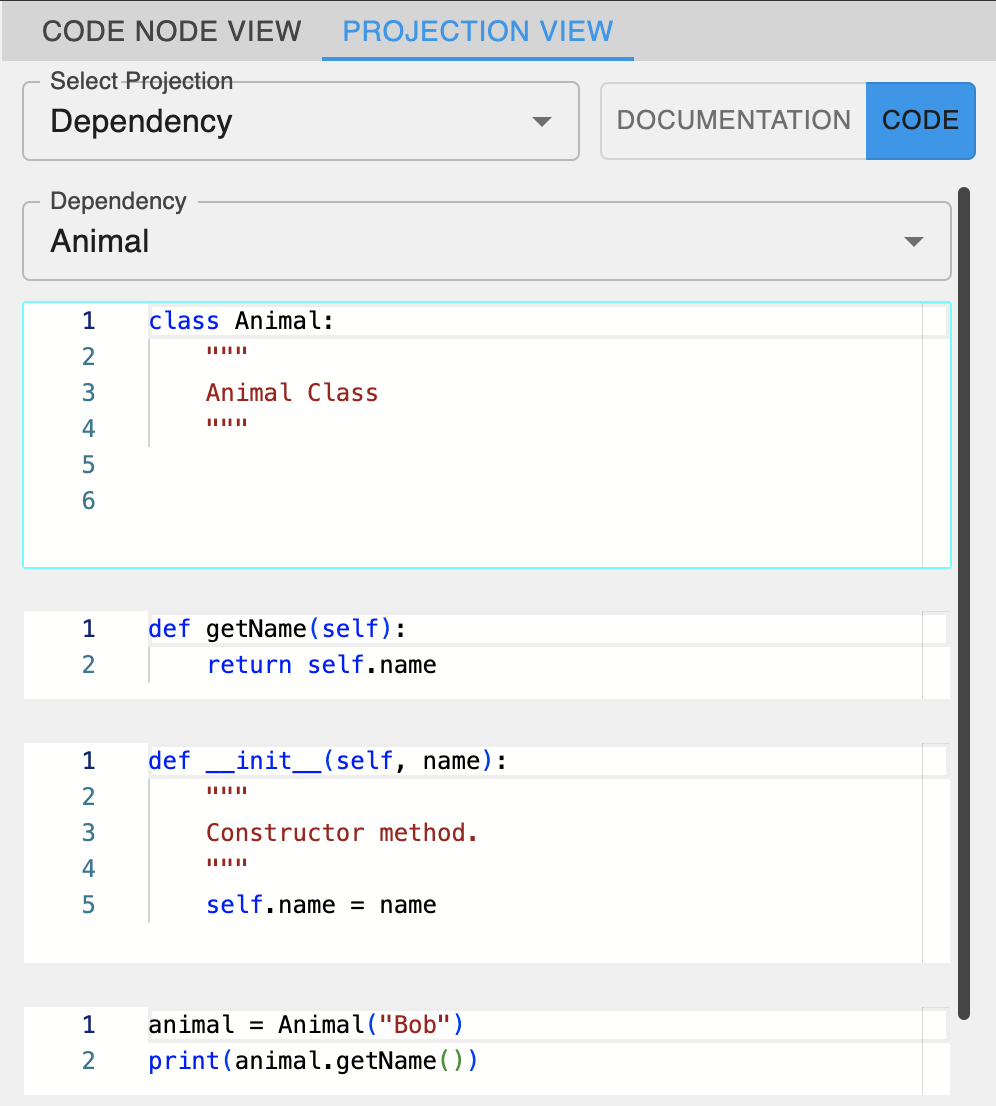
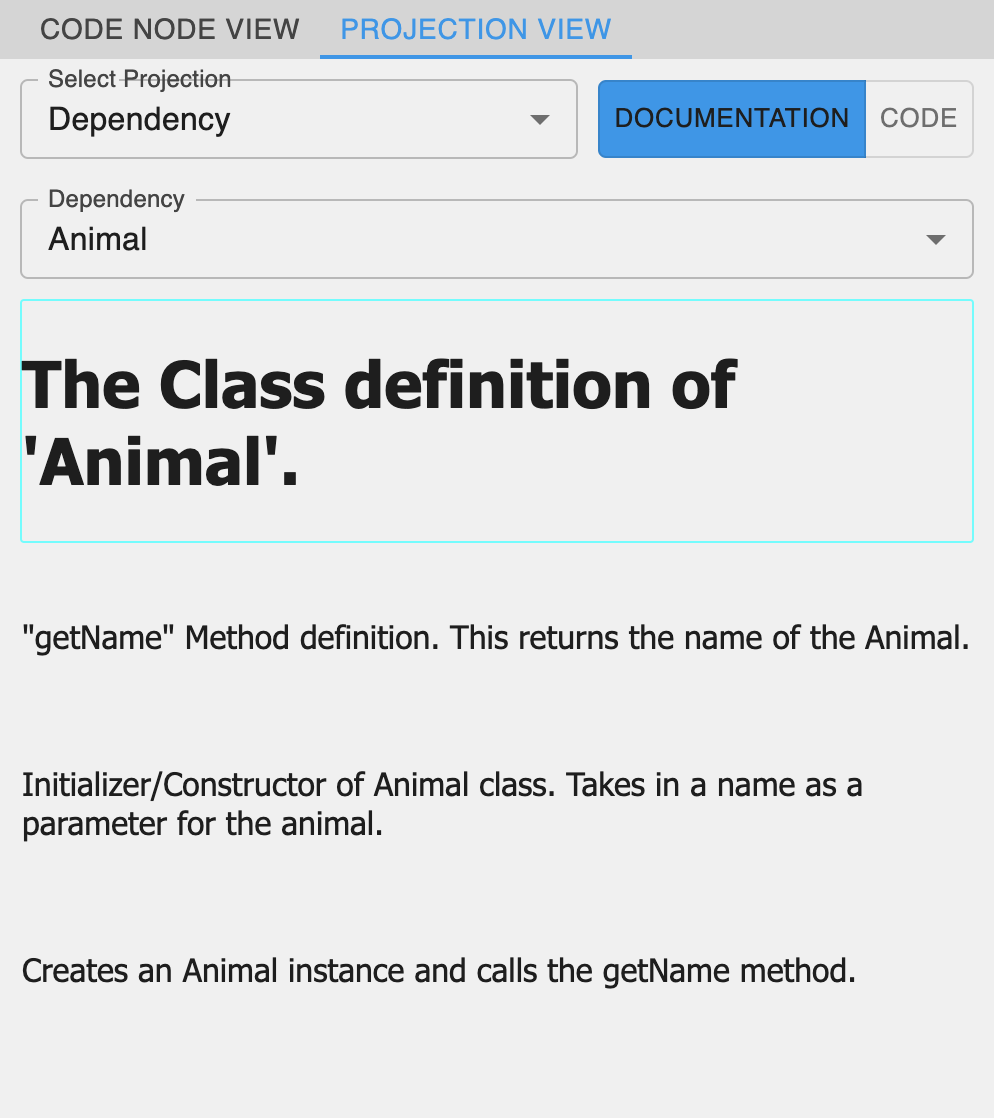
In IGC, code and documentation nodes appear within a graph-based interface rather than a projectional editor. When a documentation node is attached to a node containing code, it appears above the code, thus providing a direct correlation between fragments and their respective documentation. Beyond this, users can toggle different projection modes – such as showing only code, only documentation, or both – mirroring much of the functionality found in PescaJ (see Figure 2). IGC’s interface depends on explicit relationships to represent method calls and dependencies, potentially allowing for broader or more detailed relationship views. Currently, there are three different projection categories that a user can select in the projection view: Class, Dependency, and Execution. The class projection view aggregates all code and documentation belonging to a specific class structure (specific to object-oriented languages). The dependency projection view displays code and documentation for nodes along a dependency chain (paths leading from nodes containing variable definitions to nodes that depend on these variables) of a selected variable. The execution projection view displays code and documentation of the entire execution path (if the execution goes through the selected node). The execution projection is a great way to have a similar look and feel to a classic computational notebook.
Both environments aim to resolve the problem of dispersed code and documentation, but they differ in execution. PescaJ creates overlapping, projectional views within a workspace, letting users edit code and documentation side by side. By contrast, IGC employs a graph-based approach that explicitly depicts projections through various relationships. PescaJ’s automatic extraction of Javadoc comments enhances workflow, while IGC necessitates manual attachment of documentation nodes. On the flip side, IGC’s open-ended projections can showcase connections outside the scope of traditional call hierarchies, offering more flexible navigational paths.
4.2 UML/Architectural diagrams
As software systems grow in size, developers often rely on modular architectures to cope with increasing complexity [1]. Traditional tools, such as UML diagrams [7], offer high-level architecture designs; however, these designs can become disconnected from actual code, leading to inconsistencies [13]. Model-View-Controller (MVC) is a well-known architecture pattern [34]. The benefits of organizing software according to this pattern hinge on being able to visualize and manage the relationships among components effectively [28].
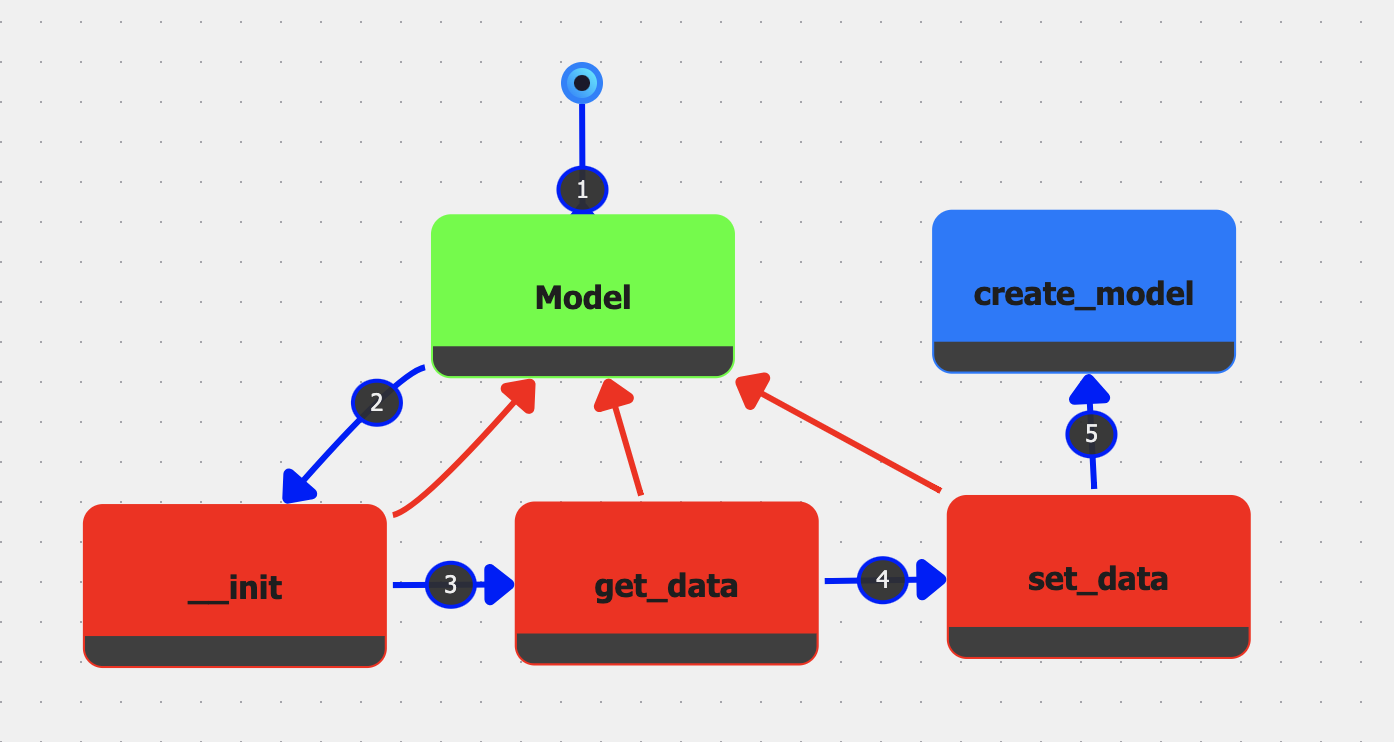
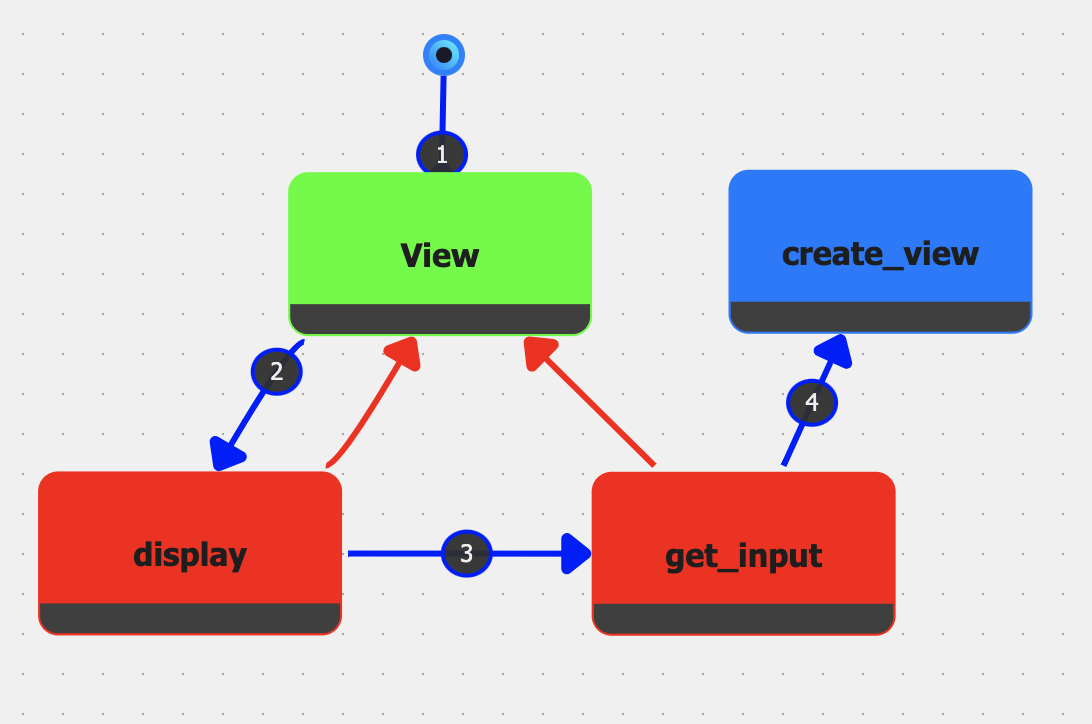
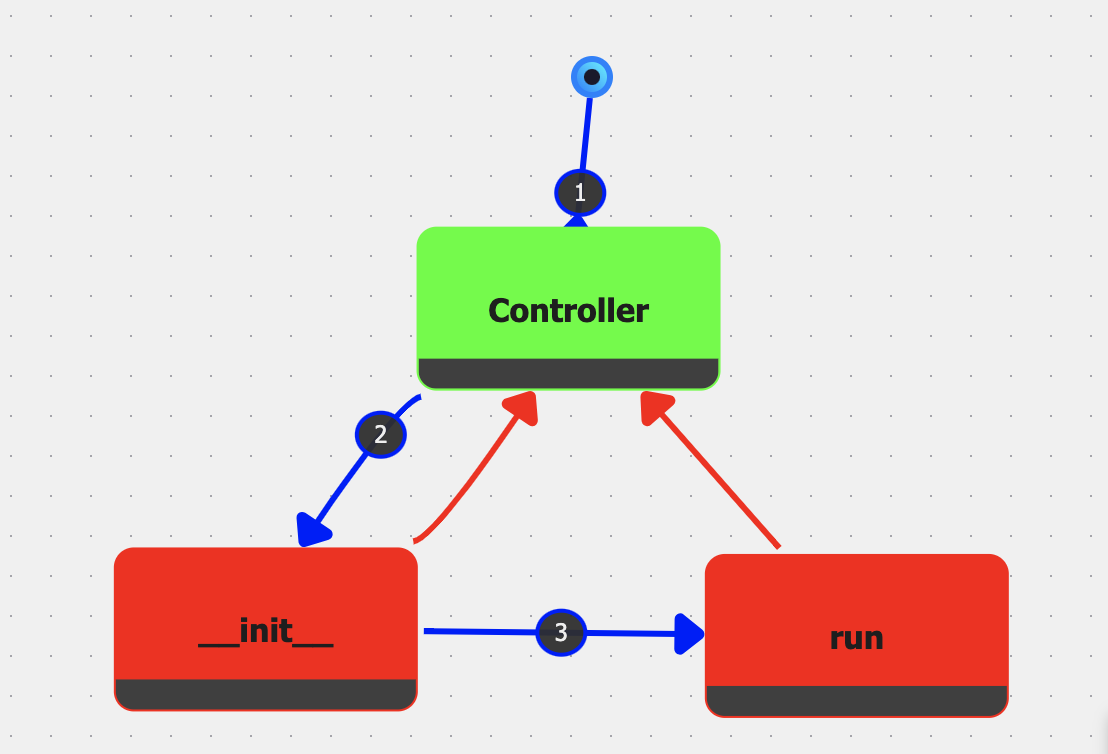
This case study shows how IGC’s Graph Nodes can be used to encapsulate the model, view, and controller subsystems of a larger MVC architecture. To illustrate, developers can create Model.igc, View.igc, and Controller.igc files, each containing their own nodes and sessions. Once each of the files has been populated with nodes and sessions, a main file (MVC.igc) can then reference these files through Graph Nodes, tying them together with edges that represent interactions among the three MVC layers. This is shown in Figure 3. Since each Graph Node is directly linked to a session, executing the main graph will use the execution order defined by these sessions and run the entire system in a coordinated fashion, enabling developers to observe the application’s behavior without juggling multiple disconnected projects.
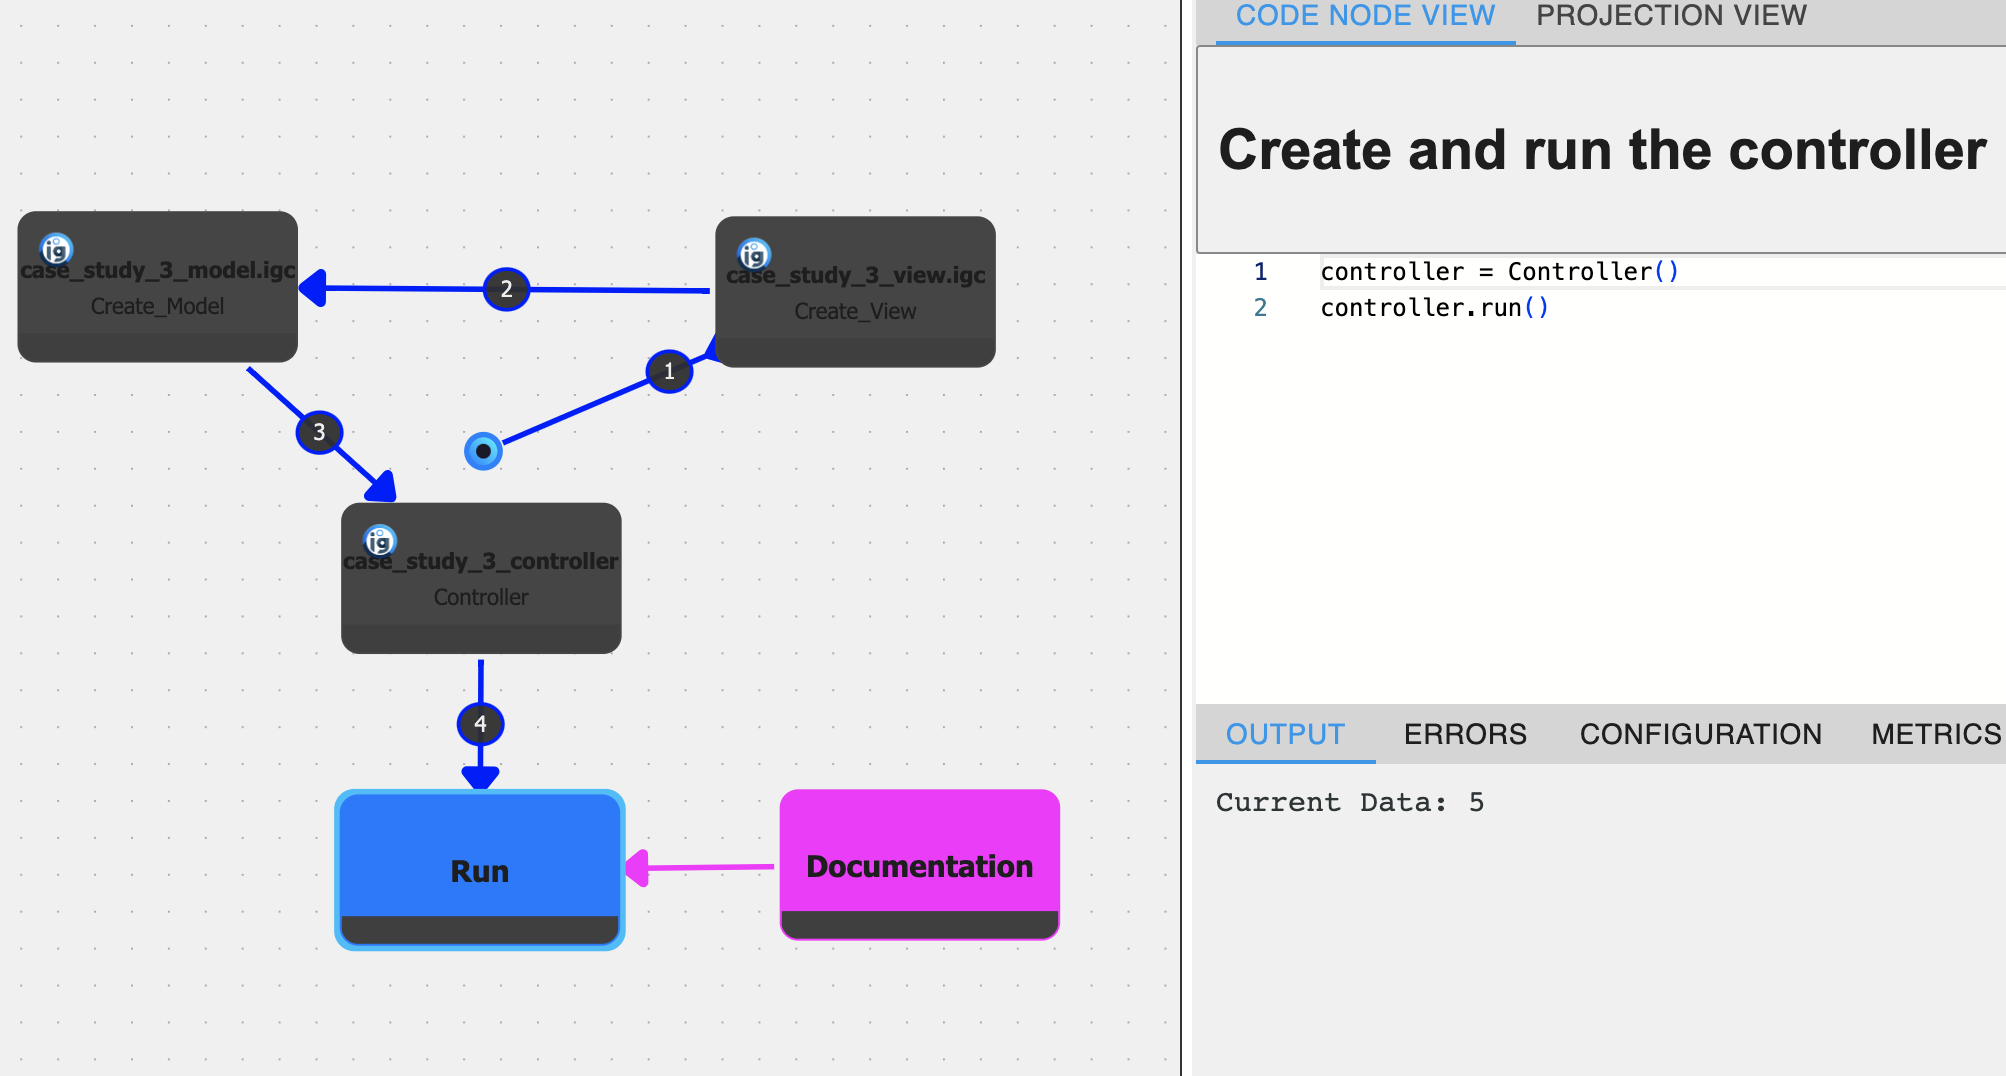
Because Graph Nodes encapsulate both the code and its runtime data, the resulting main graph can be viewed and interacted with as a living diagram. Developers may step into each Graph Node to inspect or modify the underlying subsystem. This dynamic representation has parallels to UML diagrams while retaining an executable link to the actual codebase, thus mitigating the risk of architectural drift [13].
Allowing developers to choose a given session for each Graph Node also supports the creation of multiple configurations, facilitating the comparison of different architectural choices. For example, in a typical MVC architecture, you have separate views that interact with separate models via specific controller functions. For this setup, you could have specific sessions for each view, model, and controller.
Where UML offers a static snapshot [7], IGC’s graph-based approach provides a constantly updated depiction of the architecture. From the opposite side of this synchronization issue, model-driven development (MDD) aims to generate code from models directly [12]. However, the production of automated MDD tools is difficult because the semantics carries the meaning that is essential to enable automation for programs [18]. IGC merges the notion of a “model” directly with the code itself. By storing and running code in graph form, IGC sidesteps the friction of maintaining parallel models and codebases, enabling a more seamless architectural view that is less prone to manual synchronization errors.
4.3 Exploratory Programming GUI
This final case study centers on an environment that supports exploratory programming by enabling seamless alteration of execution paths. The paper, “A Language-Parametric Approach to Exploratory Programming Environments” [38], discusses an experimental computational Notebook front-end in Section 6 (shown in Figure 5). For simplicity, we will refer to this as the Exploratory Programming GUI (XP-GUI). Traditional edit-compile-run cycles and limited feedback mechanisms often make such free-form exploration difficult, prompting research into specialized GUIs that visualize and compare multiple execution traces (as shown in Figure 5).
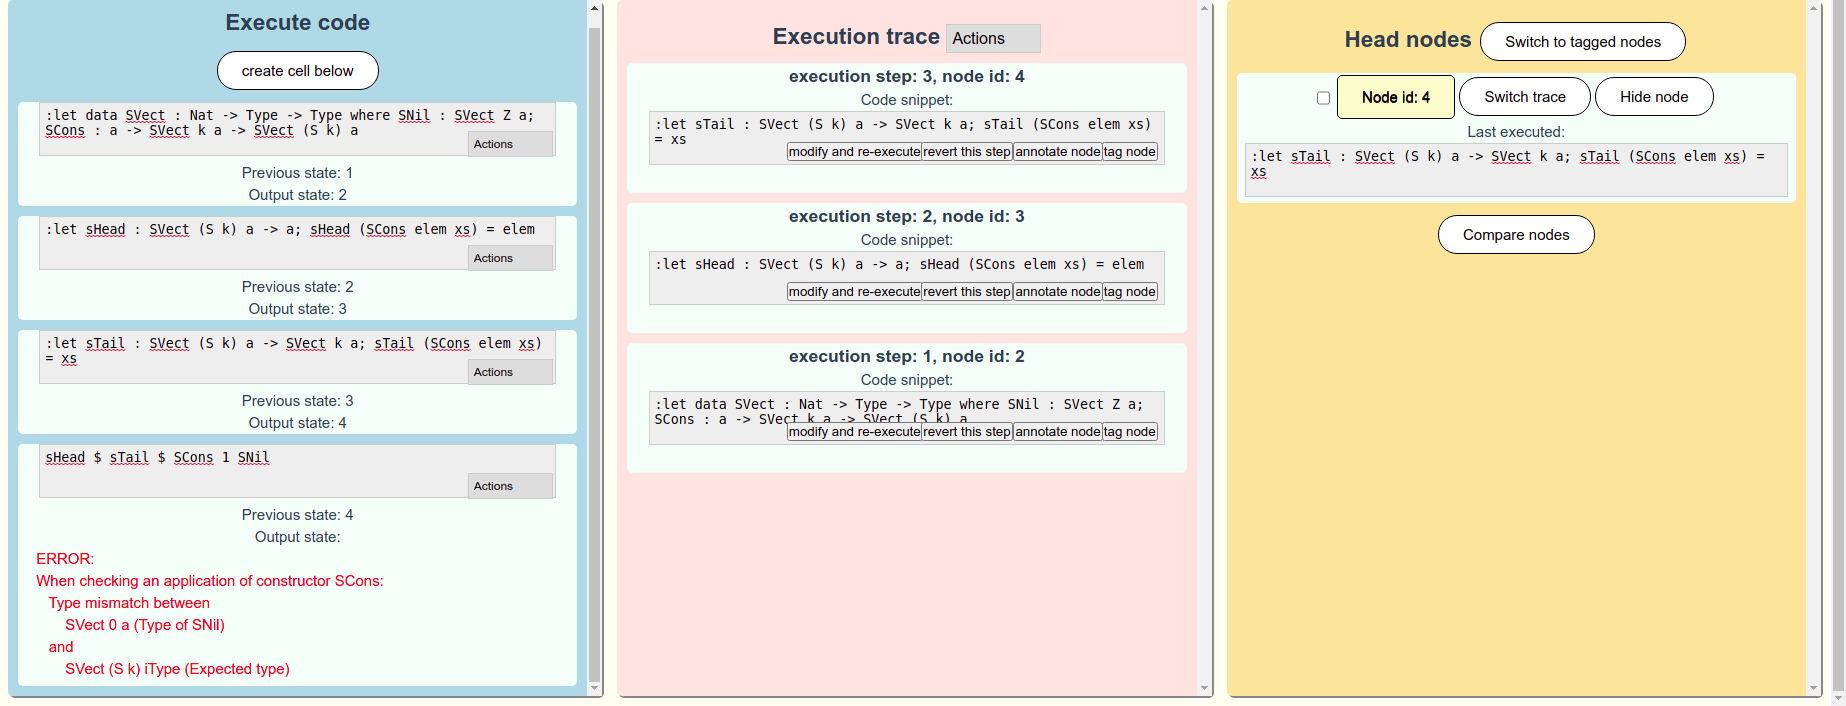
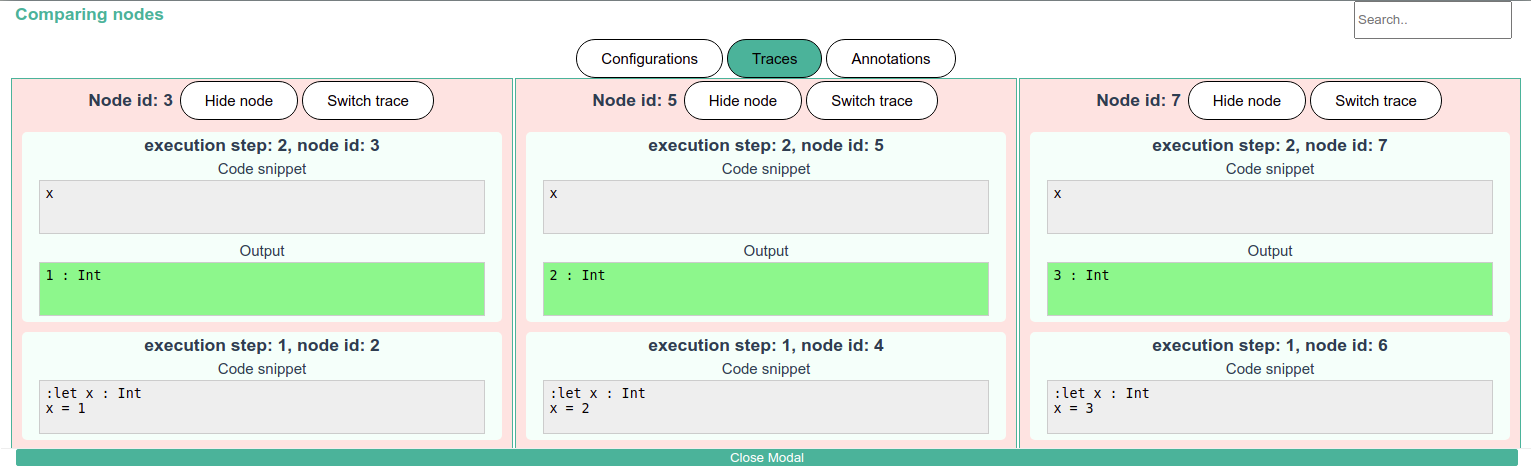
XP-GUI offers a tree-based record of execution states (traces), where each node corresponds to a distinct code configuration. However, one branch is visible at a time. Users can branch and merge these execution paths, allowing them to explore divergent scenarios without discarding previous work. Code fragments are run incrementally, with immediate feedback on runtime behavior. An interactive state management system highlights outputs and state changes, and the addition of undo/redo functionality provides flexibility for rapid iterative refinement. These combined features cater to rapid experimentation and serve data science, education, and rapid prototyping scenarios [23, 32].
A typical workflow in XP-GUI has the developer writing code in a notebook-like interface. Executing a cell updates the central execution trace. New branches can be started from any prior state, preserving the original path. Multiple trace endpoints, or “head” nodes, can be marked and compared side by side for deeper insight into the impact of code changes. The system also supports importing and exporting traces for collaboration and reproducibility.
IGC incorporates exploratory programming through the session manager and the Exploratory Programming View (shown in Figure 6(b)), which tracks discrete execution paths (sessions). The Session Manager allows the user to toggle between the sessions to compare execution data. Each session is represented as a node sequence branching from an initial start node, with overlaps indicating shared prefixes. Users can initiate new sessions at any node, insert new code before or after existing steps, or replace code entirely to explore alternative implementations. Although no explicit undo/redo, this functionality can be mimicked by creating sub-sessions derived from another session which provides a new execution workspace to experiment with. A user can always recompute a session if needed by clicking the play button above the graph editor. This session-based approach directly addresses the need for iterative experimentation, allowing multiple development strategies to coexist without losing prior progress.

Although both systems support exploratory practices, they diverge in interface design and code organization. Primarily, IGC visualizes the various execution paths as a tree structure whilst retaining the ability to show notebook-like views through projections. In contrast, XP-GUI requires the user to have an internal mental execution tree representation of the underlying execution paths whilst navigating the different traces and using the trace comparison view. IGC also has more control over the execution paths with actions directly embedded in the exploratory programming view, such as complex branching and re-execution.
Both these environments allow for experimentation within the code base, but IGC’s graph-based approach provides a more flexible and visual representation of the execution paths. IGC is still limited by the need to manually create and manage changes in nodes, often leading to nodes having different versions of very similar code. A proactive model that allows users to define versions of the same node could help mitigate this issue.
5 Discussion
This section presents an analysis of the results from our case studies, evaluating the feasibility of supporting exploratory programming and complexity management within GBPEs. We will then review the limitations and discuss future work that can be done to enhance IGC and the features we have added.
Feasibility of Complexity Management Features
Case Study 1 (PescaJ) and Case Study 2 (UML/Architectural diagrams) both highlight IGC’s ability to simplify and manage complexity. In the first study, we saw how a projectional view helps aggregate scattered documentation and code fragments. By attaching documentation nodes directly above related code nodes, developers can easily keep track of relevant information without having to sift through multiple files. This consolidation promotes clarity and reduces the cognitive burden of navigating large or unfamiliar codebases. In the second study, IGC’s Graph Node feature was shown to encapsulate entire subgraphs of functionality, mirroring the abstraction advantages of modular design. By composing graphs within a main file, developers effectively create “high-level” nodes that represent entire components or subsystems (e.g., Model, View, Controller). This encapsulation improves maintainability, as changes within a subgraph do not clutter the overarching project view.
Feasibility of Exploratory Programming Features
Case Study 3 (XP-GUI) demonstrates how IGC’s session-based execution model supports iterative experimentation. Similar to XP-GUI [38], IGC provides a tree of possible execution paths that allows branching, merging, and comparison of different outcomes. By allowing the insertion or replacement of nodes in mid-execution, developers can fork code evolution without losing previously successful states. This functionality serves use cases where the project’s final goal is not fully specified from the outset (e.g., data science prototyping), allowing rapid iteration and creative exploration of alternative approaches. Moreover, maintaining a historical record of sessions lowers the risk of regression: if an exploration path proves unproductive, the developer can revert to an earlier state and proceed differently. IGC’s multi-view approach demonstrates that GBPEs can support exploratory programming in a visually and structurally coherent way.
Transferability to Different Environments
Though designed for IGC, these features can be useful across different disciplines. For example, in data science, each graph node could represent a distinct pipeline stage, such as data cleaning, feature engineering, or model training. To support this, the environment must allow sub-workflows to be encapsulated and re-executed independently, with clear data interfaces between nodes so that modifying one stage does not disrupt the entire process. This modular, node-based abstraction makes it easier to refine and iterate on individual steps, thereby enhancing both productivity and maintainability in data science pipelines.
Although each feature – projectional views, graph nodes, and exploratory programming features – addresses distinct challenges, they form a cohesive environment that amplifies each other’s benefits. Projectional views reduce cognitive load by consolidating code and documentation, which can then be encapsulated into subgraphs via graph nodes for cleaner organization. Meanwhile, the exploratory programming features enable branching and comparison of alternative implementations, seamlessly bridging structured code organization with iterative experimentation.
Limitations
Although IGC demonstrates promise in both complexity management and exploratory programming features in GBPEs, there are potential drawbacks. The graph interface may introduce a steeper learning curve, as developers must adapt to node-based metaphors for code organization and maintain awareness of multiple session states. Relating to exploratory programming, IGC currently requires manual duplication and management of nodes to represent code variations, often resulting in redundant and inconsistently maintained versions. Another issue is that graph nodes currently cannot directly take in any state defined in nodes outside of the graph. To mitigate this currently, all execution is global, so the user would simply need to ensure that any dependency is executed beforehand. Finally, while Graph Nodes offer powerful compositional possibilities, excessive nesting or overuse of subgraphs could produce tangled hierarchies, undermining the very clarity they are meant to provide. Further refinement and user studies may be necessary to address these concerns and align IGC’s interface paradigms with varying development workflows.
Despite demonstrating the potential of IGC in diverse scenarios, the case studies introduce several limitations that constrain the broader applicability of these findings. Each study involves a relatively narrow context, raising questions about how well IGC’s features generalize to more complex or large-scale projects. Subjectivity also presents a limitation since researchers may favor the graph-based approach and inadvertently interpret clarity or flexibility as improved. Since the studies rely on simplified or contrived tasks to showcase IGC’s capabilities, the generalizability of the findings may be limited, as real-world settings with different workflows or team sizes could produce different outcomes.
Future Work
The following are some potential directions for future work that could further enhance IGC’s complexity management and exploratory programming capabilities.
Currently, documentation nodes are attached to specific code fragments and are intended to document that fragment. We consider adding label nodes that the user can place anywhere in a graph to provide documentation for the system as a whole. Or the user can document a subsystem by outlining a specific area of a graph and connecting a label node.
Code fragments/nodes in IGC are currently not typed, reflecting the use of the underlying, dynamically typed language Python. IGC also does not perform a complete name-binding analysis on the source code of a graph. However, in support of exploratory programming, it would be beneficial to know which code fragments can be used as alternatives to each other. To mitigate this, we considered adding the option to specify strict type signatures for (the input and output of) graph nodes. Another approach we consider is to have users define typed sources and sinks. A graph can have one or more initial sources with initial values assigned (similar to command line arguments). Executed cells provide the values for sinks, which, in turn, can provide the input to later cells or provide final results. This way, alternative ways of using/providing the values of sinks can be considered, and a type inference mechanism can determine the requirements of the input/output of code nodes.
Currently, the only way to compare state value changes is to switch back and forth between sessions. We consider adding variable watchers as a way to track changes to variables within and across sessions. Working within and across sessions, variable watchers can be used both for debugging purposes and for exploratory programming [26, 3].
6 Related Work
The following section discusses related work that has concepts that overlap with IGC that we believe are important to mention.
The paper “Probing the Design Space: Parallel Versions for Exploratory Programming” [3] introduces Exploriants. Exploriants allow users to create variation points in their code, allowing them to test the effects of different code changes (through probes) live in a programming environment. These features have many similarities to the goal of supporting exploratory programming. Both Exploriants and IGC aim to provide an interface that allows users to experiment with different code versions and observe how they diverge in real-time. A key difference is the way these methods occur. Exploriants focuses on live and reactive code changes, whereas IGC focuses on a proactive approach requiring the user to manually create different sessions to compare different code versions. One advantage of Exploriants over IGC is that probes specifically target specific effects that the user wants to be tested. This allows for more targeted testing and debugging. IGC is still currently limited in this regard, where the only way to compare variables is to toggle between sessions.
Fork It [39] is an example of trying to incorporate exploratory programming in a computational notebook. Fork It allows users to create branches of their code and compare different versions side by side. This is similar to the session-based execution model in IGC. Both systems enable users to create and compare different versions of their code. However, Fork It is limited in that it only allows users to compare two versions of their code at a time. IGC allows users to compare multiple versions of their code at once. This is particularly useful when the user needs to compare multiple versions of their code simultaneously. Fork It notes the advantages of expanding past the linear narrative of computational notebooks. However, IGC takes this a step further by allowing users to create a graph-based representation of their code instead of two different versions of execution. This allows for more complex relationships to be visualized and manipulated.
Smalltalk [17] is, debatably, the first object-oriented programming language [22]. Both of these transformed the way developers interact with software. Smalltalk introduced the concept of treating every element as an object, a design choice that not only promotes modularity but also lays the groundwork for visual environments where developers can interact with objects and data directly [8]. This feature aligns with IGC’s goal of providing a visual, interactive environment for code exploration. Smalltalk also introduced the concept of a “workspace” where developers could experiment with code snippets, an inspiration to the incremental and exploratory programming features seen in IGC. In both cases, the systems encapsulate functionality and manage complexity through different abstractions, though IGC leverages this idea in a visual and structured manner through sub-graphs in Graph Nodes.
7 Conclusion
In this paper, we extend Incremental Graph Code (IGC) with new features designed to better manage software complexity and support exploratory programming. Through three case studies, we demonstrated how projections over the underlying source code graph can aggregate scattered code and documentation, how Graph Nodes can encapsulate subsystems into manageable units, and how session-based execution trees allow developers to branch off and compare alternative solutions. Each of these capabilities addresses known challenges in software engineering: managing large and complex codebases, preserving clarity amid evolving requirements, and enabling rapid, iterative experimentation.
The case studies suggest that IGC’s approach can unify features and programming styles supported by conventional programming environments. By attaching documentation directly to code nodes or composing entire subsystems via graph nodes, developers reduce the cognitive load commonly associated with disconnected documentation and sprawling architectures. Likewise, the introduction of sessions offers a more robust exploratory workflow, preserving past states and providing means to try new code branches without sacrificing previous work.
Despite these advantages, we acknowledge that IGC introduces a new mental model for coding, which may require a steeper learning curve. Additionally, while modular composition can be a powerful tool, it may become difficult to navigate if overused. We plan to address these concerns in future work, guided by user studies that explore adoption barriers and integrations with existing software ecosystems.
Overall, the extended IGC platform demonstrates how a graph-based data model and interface can enhance software development flexibility and comprehensibility. By uniting complexity management and exploratory practices within a single environment, we hope to create a more creative and scalable workflow that is effective for developers across diverse use cases and project sizes.
References
- [1] Mohsen AlSharif, Walter P. Bond, and Turky Al-Otaiby. Assessing the complexity of software architecture. In Proceedings of the 42nd annual ACM Southeast Conference, ACMSE ’04, pages 98–103, New York, NY, USA, April 2004. Association for Computing Machinery. doi:10.1145/986537.986562.
- [2] Sharon Andrews and Mark Sheppard. Software Architecture Erosion: Impacts, Causes, and Management. International Journal of Computer Science and Security (IJCSS), 14(2):82–94, June 2020. ISSN: 19851553.
- [3] Tom Beckmann, Joana Bergsiek, Eva Krebs, Toni Mattis, Stefan Ramson, Martin C. Rinard, and Robert Hirschfeld. Probing the Design Space: Parallel Versions for Exploratory Programming. The Art, Science, and Engineering of Programming, 10(1), February 2025. Publisher: Aspect-Oriented Software Association (AOSA). doi:10.22152/programming-journal.org/2025/10/5.
- [4] Mary Beth Kery and Brad A. Myers. Exploring exploratory programming. In 2017 IEEE Symposium on Visual Languages and Human-Centric Computing (VL/HCC), pages 25–29, October 2017. ISSN: 1943-6106. doi:10.1109/VLHCC.2017.8103446.
- [5] Max Boksem. incremental-graph-code/igc. Software (visited on 2025-08-29). URL: https://github.com/incremental-graph-code/igc/, doi:10.4230/artifacts.24596.
- [6] Max Boksem and L. Thomas van Binsbergen. Bridging Incremental Programming and Complex Software Development Environments. In Proceedings of the 3rd ACM SIGPLAN International Workshop on Programming Abstractions and Interactive Notations, Tools, and Environments, PAINT ’24, pages 29–40, New York, NY, USA, October 2024. Association for Computing Machinery. doi:10.1145/3689488.3689991.
- [7] Grady Booch, Ivar Jacobson, James Rumbaugh, and others. The unified modeling language. Unix Review, 14(13):5, 1996. ISSN: 0321267974.
- [8] I. Borne. A visual programming environment for Smalltalk. In Proceedings 1993 IEEE Symposium on Visual Languages, pages 214–218, August 1993. doi:10.1109/VL.1993.269599.
- [9] Erwan Bousse, Dorian Leroy, Benoit Combemale, Manuel Wimmer, and Benoit Baudry. Omniscient debugging for executable DSLs. Journal of Systems and Software, 137:261–288, March 2018. doi:10.1016/j.jss.2017.11.025.
- [10] Andrew Bragdon, Steven P. Reiss, Robert Zeleznik, Suman Karumuri, William Cheung, Joshua Kaplan, Christopher Coleman, Ferdi Adeputra, and Joseph J. LaViola. Code bubbles: rethinking the user interface paradigm of integrated development environments. In Proceedings of the 32nd ACM/IEEE International Conference on Software Engineering - Volume 1, ICSE ’10, pages 455–464, New York, NY, USA, May 2010. Association for Computing Machinery. doi:10.1145/1806799.1806866.
- [11] Andrew Bragdon, Robert Zeleznik, Steven P. Reiss, Suman Karumuri, William Cheung, Joshua Kaplan, Christopher Coleman, Ferdi Adeputra, and Joseph J. LaViola. Code bubbles: a working set-based interface for code understanding and maintenance. In Proceedings of the SIGCHI Conference on Human Factors in Computing Systems, CHI ’10, pages 2503–2512, New York, NY, USA, April 2010. Association for Computing Machinery. doi:10.1145/1753326.1753706.
- [12] Marco Brambilla, Jordi Cabot, and Manuel Wimmer. Model-driven software engineering in practice. Morgan & Claypool Publishers, 2017. doi:10.2200/S00751ED2V01Y201701SWE004.
- [13] Brian Dobing and Jeffrey Parsons. How UML is used. Communications of the ACM, 49(5):109–113, 2006. Publisher: ACM New York, NY, USA. doi:10.1145/1125944.1125949.
- [14] Lem O Ejiogu. A simple measure of software complexity. ACM SIGPLAN Notices, 20(3):16–31, 1985. Publisher: ACM New York, NY, USA. doi:10.1145/382284.382388.
- [15] Andrés Mejía Figueroa and Reyes Juárez-Ramírez. The Problem of Cognitive Load in GUI’s: Towards Establishing the Relationship between Cognitive Load and Our Executive Functions. In 2017 IEEE 41st Annual Computer Software and Applications Conference (COMPSAC), volume 2, pages 561–565, July 2017. ISSN: 0730-3157. doi:10.1109/COMPSAC.2017.238.
- [16] Damian Frolich and L. Thomas van Binsbergen. A Generic Back-End for Exploratory Programming. In Viktória Zsók and John Hughes, editors, Trends in Functional Programming, pages 24–43, Cham, 2021. Springer International Publishing. doi:10.1007/978-3-030-83978-9_2.
- [17] Adele Goldberg and David Robson. Smalltalk-80: the language and its implementation. Addison-Wesley Longman Publishing Co., Inc., USA, 1983. ISBN: 978-0-201-11371-6.
- [18] B. Hailpern and P. Tarr. Model-driven development: The good, the bad, and the ugly. IBM Systems Journal, 45(3):451–461, 2006. Conference Name: IBM Systems Journal. doi:10.1147/sj.453.0451.
- [19] Maurice H Halstead. Elements of Software Science (Operating and programming systems series). Elsevier Science Inc., 1977. ISBN: 0-444-00205-7.
- [20] Jesse Harden, Elizabeth Christman, Nurit Kirshenbaum, John Wenskovitch, Jason Leigh, and Chris North. Exploring Organization of Computational Notebook Cells in 2D Space. In 2022 IEEE Symposium on Visual Languages and Human-Centric Computing (VL/HCC), pages 1–6, September 2022. ISSN: 1943-6106. doi:10.1109/VL/HCC53370.2022.9833128.
- [21] Ján Juhár and Liberios Vokorokos. A review of source code projections in integrated development environments. In 2015 Federated Conference on Computer Science and Information Systems (FedCSIS), pages 923–927, September 2015. doi:10.15439/2015F289.
- [22] Alan Kay, Dan Engalls, Adele Goldberg, and Dave Robson. The history of smalltalk. ACM Sigplan Not.(Mar. 1993), 10(155360.155364), 1993. URL: http://aturing.umcs.maine.edu/˜meadow/courses/cos301/smalltalk.pdf.
- [23] Mary Beth Kery, Amber Horvath, and Brad Myers. Variolite: Supporting Exploratory Programming by Data Scientists. In Proceedings of the 2017 CHI Conference on Human Factors in Computing Systems, CHI ’17, pages 1265–1276, New York, NY, USA, May 2017. Association for Computing Machinery. doi:10.1145/3025453.3025626.
- [24] M. M. Lehman. On understanding laws, evolution, and conservation in the large-program life cycle. Journal of Systems and Software, 1:213–221, January 1979. doi:10.1016/0164-1212(79)90022-0.
- [25] José Lopes and André Santos. PescaJ: A Projectional Editor for Java Featuring Scattered Code Aggregation. In Proceedings of the 2nd ACM SIGPLAN International Workshop on Programming Abstractions and Interactive Notations, Tools, and Environments, PAINT 2023, pages 44–50, New York, NY, USA, October 2023. Association for Computing Machinery. doi:10.1145/3623504.3623571.
- [26] K. Maruyama and M. Terada. Debugging with reverse watchpoint. In Third International Conference on Quality Software, 2003. Proceedings., pages 116–123, 2003. doi:10.1109/QSIC.2003.1319093.
- [27] T.J. McCabe. A Complexity Measure. IEEE Transactions on Software Engineering, SE-2(4):308–320, December 1976. Conference Name: IEEE Transactions on Software Engineering. doi:10.1109/TSE.1976.233837.
- [28] Alan Ramírez-Noriega, Yobani Martínez-Ramírez, Jesús Chávez Lizárraga, Kevin Vázquez Niebla, and Jesús Soto. A software tool to generate a Model-View-Controller architecture based on the Entity-Relationship Model. In 2020 8th International Conference in Software Engineering Research and Innovation (CONISOFT), pages 57–63, November 2020. doi:10.1109/CONISOFT50191.2020.00018.
- [29] Patrick Rein, Stefan Ramson, Jens Lincke, Robert Hirschfeld, and Tobias Pape. Exploratory and Live, Programming and Coding. The Art, Science, and Engineering of Programming, 3(1):1:1–1:33, July 2018. Publisher: AOSA, Inc. doi:10.22152/programming-journal.org/2019/3/1.
- [30] Helena M. Reis, Simone S. Borges, Vinicius H.S. Durelli, Luis Fernando de S. Moro, Anarosa A.F. Brandão, Ellen F. Barbosa, Leônidas O. Brandão, Seiji Isotani, Patricia A. Jaques, and Ig I. Bittencourt. Towards Reducing Cognitive Load and Enhancing Usability through a Reduced Graphical User Interface for a Dynamic Geometry System: An Experimental Study. In 2012 IEEE International Symposium on Multimedia, pages 445–450, December 2012. doi:10.1109/ISM.2012.91.
- [31] Juergen Rilling, Ahmed Seffah, and Christophe Bouthlier. The CONCEPT project-applying source code analysis to reduce information complexity of static and dynamic visualization techniques. In Proceedings First International Workshop on Visualizing Software for Understanding and Analysis, pages 90–99. IEEE, 2002. doi:10.1109/VISSOF.2002.1019798.
- [32] Adam Rule, Aurélien Tabard, and James D. Hollan. Exploration and Explanation in Computational Notebooks. In Proceedings of the 2018 CHI Conference on Human Factors in Computing Systems, CHI ’18, pages 1–12, New York, NY, USA, April 2018. Association for Computing Machinery. doi:10.1145/3173574.3173606.
- [33] Mecit Sari, Istemi Bahceci, Ugur Dogrusoz, Selcuk Onur Sumer, Bülent Arman Aksoy, Özgün Babur, and Emek Demir. SBGNViz: A Tool for Visualization and Complexity Management of SBGN Process Description Maps. PLOS ONE, 10(6):e0128985, June 2015. Publisher: Public Library of Science. doi:10.1371/journal.pone.0128985.
- [34] Iqbal H. Sarker and K. Apu. MVC Architecture Driven Design and Implementation of Java Framework for Developing Desktop Application. International Journal of Hybrid Information Technology, 7(5):317–322, September 2014. doi:10.14257/ijhit.2014.7.5.29.
- [35] Noah L. Schroeder and Ada T. Cenkci. Spatial Contiguity and Spatial Split-Attention Effects in Multimedia Learning Environments: a Meta-Analysis. Educational Psychology Review, 30(3):679–701, September 2018. doi:10.1007/s10648-018-9435-9.
- [36] Beau Sheil. Datamation®: Power Tools for Programmers. In Readings in artificial intelligence and software engineering, pages 573–580. Elsevier, 1986. doi:10.1016/B978-0-934613-12-5.50048-3.
- [37] David P. Tegarden, Steven D. Sheetz, and David E. Monarchi. A software complexity model of object-oriented systems. Decision Support Systems, 13(3):241–262, March 1995. doi:10.1016/0167-9236(93)E0045-F.
- [38] L. Thomas van Binsbergen, Damian Frölich, Mauricio Verano Merino, Joey Lai, Pierre Jeanjean, Tijs van der Storm, Benoit Combemale, and Olivier Barais. A Language-Parametric Approach to Exploratory Programming Environments. In Proceedings of the 15th ACM SIGPLAN International Conference on Software Language Engineering, SLE 2022, pages 175–188, New York, NY, USA, December 2022. Association for Computing Machinery. doi:10.1145/3567512.3567527.
- [39] Nathaniel Weinman, Steven M. Drucker, Titus Barik, and Robert DeLine. Fork It: Supporting Stateful Alternatives in Computational Notebooks. In Proceedings of the 2021 CHI Conference on Human Factors in Computing Systems, CHI ’21, pages 1–12, New York, NY, USA, May 2021. Association for Computing Machinery. doi:10.1145/3411764.3445527.
- [40] E.J. Weyuker. Evaluating software complexity measures. IEEE Transactions on Software Engineering, 14(9):1357–1365, September 1988. Conference Name: IEEE Transactions on Software Engineering. doi:10.1109/32.6178.
- [41] Martin R. Woodward, Michael A. Hennell, and David Hedley. A measure of control flow complexity in program text. IEEE Transactions on Software Engineering, SE-5(1):45–50, 1979. Publisher: IEEE. doi:10.1109/TSE.1979.226497.