Beyond the Score: Exploring the Intersection Between Sociodemographics and Linguistic Features in English (L1) Writing Placement

Abstract
This study examines the intersection of sociodemographic characteristics, linguistic features, and writing placement outcomes at a community college in the United States of America. It focuses on 210 anonymized writing samples from native English speakers (L1) that were automatically classified by Accuplacer and independently assessed by two trained raters. Disparities across gender and race using 40 top-ranked linguistic features selected from Coh-Metrix, CTAP, and Developmental Education-Specific (DES) sets were analyzed. Three statistical tests were used: one-way ANOVA, Tukey’s HSD, and Chi-square. ANOVA results showed racial differences in nine linguistic features, especially those tied to syntactic complexity, discourse markers, and lexical precision. Gender differences were more limited, with only one feature reaching significance (Positive Connectives, ). Tukey’s HSD pairwise tests showed no significant gender group variation but revealed sensitivity in DES features when comparing racial groups. Chi-square analysis indicated no significant association between gender and placement outcomes but suggested a possible link between race and human-assigned levels (, ). These findings suggest that while automated systems assess general writing skills, human-devised linguistic features and demographic insights can support more equitable placement practices for all students entering college-level programs.
Keywords and phrases:
Developmental Education (DevEd), sociolinguistic variation, text classification, Machine Learning, placement equityCopyright and License:
2012 ACM Subject Classification:
Social and professional topics Student assessment ; Social and professional topics Adult education ; Computing methodologies Language resources ; Computing methodologies Lexical semantics ; Social and professional topics Race and ethnicity ; Social and professional topics Men ; Social and professional topics WomenFunding:
This work was supported by Portuguese national funds through FCT (Reference: UIDB/50021/2020, DOI: 10.54499/UIDB/50021/2020) and by the European Commission (Project: iRead4Skills, Grant number: 1010094837, Topic: HORIZON-CL2-2022-TRANSFORMATIONS-01-07, DOI: 10.3030/101094837).Editors:
Jorge Baptista and José BarateiroSeries and Publisher:
1 Introduction and Objectives
Community colleges play a vital role in expanding access to higher education opportunities for high school graduates across the United States of America [21]. According to this country’s Department of Education111https://www.ed.gov/higher-education (Last accessed: 25th September 2025; all URLs in this paper were checked on this date.) definitions, community colleges are institutions responsible for providing access to the first two years of a Bachelor’s degree, certificates in specialized trades, and/or the academic preparation for occupational credentials for work-ready programs. Operating, in most cases, under an open-admission policy, these institutions are also equipped to provide the academic support needed for students who are linguistically underprepared to join and complete an academic program.
At Tulsa Community College (TCC)222https://www.tulsacc.edu/, where this study took place, students who require academic support in key areas, particularly writing, are placed in a foundational literacy program known as Developmental Education (DevEd). Depending on their demonstrated writing skills prior to beginning an academic program, students can be placed into one of the following three levels (adapted version of the institution’s official course descriptions):
DevEd Level 1: for support with frequent grammar, spelling, and punctuation issues, and lacking cohesion;
DevEd Level 2: for support with some structural improvements still needing targeted support;
College Level: no support needed; skills show academic-level writing with minimal errors.
DevEd placement is typically determined using automated text classification systems. At TCC, Accuplacer333https://accuplacer.collegeboard.org/ [41] is the system currently used to assess students’ writing and assign placement levels accordingly. Existing literature raises concerns about the accuracy and fairness of such systems. For example, in [16] it was mentioned that automated placement tools misplace approximately one-third of students, either assigning them to courses that exceed their preparedness (overplacement) or to levels that do not reflect their actual skills (underplacement), raising both pedagogical and ethical concerns.
Placement decisions often show a mismatch between individual student data and overall institutional demographics, posing questions about whether those placed into non-college-level programs (e.g., DevEd) truly reflect the broader student population at their institutions [19, 35]. A contributing factor to these concerns is that, although some sociodemographic information is voluntarily self-disclosed by test-takers, most placement algorithms are designed to operate without reference to these factors (e.g., native language, race, gender) in an effort to ensure neutrality and avoid bias. However, excluding this information may limit the understanding of the underlying sociolinguistic context that shapes students’ writing development; thus, potentially contributing to disparities in placement outcomes across different student groups [2, 31].
To further explore this gap, we investigate the relationship between sociodemographic variables, linguistic features in student writing, and placement outcomes. Our analysis draws on a corpus of 210 anonymized essays, randomly selected from 1,384 participants who self-identified as native English (L1) speakers, with each essay automatically and manually assessed for skill level. To validate linguistic differences and placement patterns, we employ a suite of statistical techniques, including one-way ANOVA, Tukey’s Honestly Significant Difference (HSD) test [1, 36], and Chi-square tests of independence.
While a range of demographic characteristics exists (e.g., age, first-generation status, academic load), this study focuses specifically on gender and race for two reasons. First, these variables were consistently and reliably self-reported across both institutional and testing datasets, ensuring compatibility and completeness for statistical analysis. Second, other variables – such as age or socioeconomic status – were either unavailable, inconsistently reported, or insufficiently balanced to support valid statistical comparisons.
Grounded within the language resources and corpus linguistics domain, this study aims to contribute to the development of support tools for language teaching and assessment. It also connects with Machine Learning (ML) applications in Natural Language Processing and addresses ethical dimensions surrounding the fairness and transparency of automated placement systems. To support this investigation, we propose the following research questions:
-
1.
How do the sociodemographic characteristics of the students selected for analysis align with the broader population of Accuplacer test-takers?
-
2.
To what extent do gender and race correlate with the use of linguistic features in student writing at the developmental and college-entry levels?
-
3.
Are there significant associations between these demographic variables (gender and race) and the placement outcomes – both automated (Accuplacer) and human-assigned?
Our paper is organized as follows: Section 2 reviews existing research on writing assessment and placement, linguistic features, and demographic disparities. Section 3 describes the institutional context, participant demographics, corpus, feature selection, and statistical procedures. Section 4 presents findings from the ANOVA and Tukey’s HSD analyses. Section 5 examines associations between demographic variables and placement outcomes, both through Accuplacer and human assessment. We conclude by summarizing our key findings.
2 Related Work
Students’ writing skills and placement into college-level or remedial courses are often assessed through standardized systems like Accuplacer. Existing literature raises concerns about the validity and fairness of such instruments [5, 14, 26], particularly given the disproportionate placement of students from historically marginalized groups into non-college level or DevEd courses [3, 35]. Placement into DevEd courses has been consistently associated with lower rates of retention555Percentage of first-time, full-time students who return the following year to continue with their academic program, according to the National Center for Education Statistics (NCES).444455footnotetext: https://nces.ed.gov/ and completion666Percentage of students who successfully complete a course with a grade of “C” or higher, relative to all students originally enrolled, as defined by NCES., posing questions about the economical and social consequences of automated placement decisions [25, 30].
While systems like Accuplacer aim to reduce human biases by standardizing the assessment process, they often struggle to capture subtle indicators of students’ early writing development. These “black box” tools typically emphasize surface-level correctness over deeper communicative competence, limiting their ability to assess whether students can meet academic writing demands [31]. As a result, students often leave the placement process without a clear understanding of what constitutes college-readiness in writing [18] or what traits of their written production may require remediation [29]. Researchers have argued that placement practices must move beyond raw scores to account for their broader consequences [22], as achievement gaps continue to persist across demographic groups. To help uncover potential mechanisms behind disproportionate placement, we explore the role of certain linguistic features, particularly those associated with developing writers in DevEd contexts, by examining how these features differ across racial groups and are also associated with placement levels.
Recent studies further highlight disparities in writing placement outcomes by sex and racial background. For example, [6] reports that female students often outperform male peers in writing, while students from racially and minority groups, particularly Black students, tend to score lower on standardized assessments and, once placed in developmental courses, their completion rate is significantly low [13, 30]. Persistently low success rates, especially among Black students, suggest that DevEd courses may not adequately address students’ linguistic needs. Equitable placement must therefore be paired with instruction that is both culturally responsive and linguistically informed. To address these challenges, assessment frameworks should integrate demographic considerations to: (i) prioritize direct measures of writing abilities to better understand students’ linguistic diversity [27]; (ii) eliminate systemic barriers in classification, placement, and pedagogy that impede student success [25, 40]; and (iii) provide better (and more accurate) support for linguistically underprepared students [33, 39].
Efforts to improve transparency in writing placement tasks through linguistic feature analysis have gained momentum in recent years [24, 31]. Prior studies [10, 12] show that high-quality annotated corpora and careful feature selection significantly enhance the reliability of automated classification systems [17]. Human annotations, in particular, provide fine-grained insights into students’ writing strengths and weaknesses, yielding improved classification outcomes across multiple ML models [21, 23, 32].
These findings align with broader research advocating for the integration of feature-rich platforms [42], such as Coh-Metrix777https://soletlab.asu.edu/coh-metrix/ [28] and CTAP888https://sifnos.iwm-tuebingen.de/ctap/ [7], to enhance writing assessment practices [37]. Refining linguistic feature sets represents a critical step toward advancing placement equity [15], reducing misclassification risks, and supporting more targeted instructional interventions for students, including those enrolled in DevEd programs. This study contributes to these goals by offering new insights into placement outcomes through a linguistically informed lens.
3 Methodology
3.1 Institutional Demographics
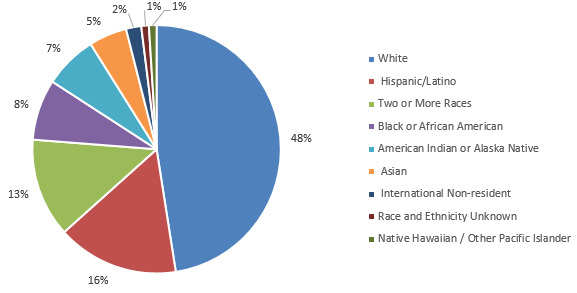
This study builds on prior research into native English (L1) writing proficiency and placement practices [11], focusing on pre-enrollment students from the 2021–2022 and 2023–2024 academic years. In 2023–2024, TCC reported an unduplicated headcount of 14,538 students. As shown in Figure 1, White students made up nearly half the population, followed by Hispanic/Latino, Black or African American, and American Indian or Alaska Native students.
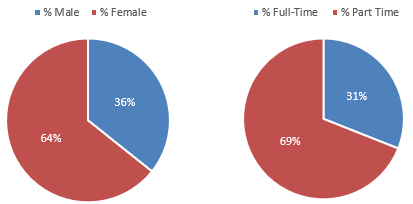
In terms of gender and academic load, as illustrated in Figure 2, approximately two-thirds of students were female and one-third male. Regarding academic load, 69% were enrolled part-time (taking about two courses per semester), while 31% were enrolled full-time (taking four to five courses). The average student age was 23, with 57% aged 24 or younger. Additionally, about 24% was first-generation college students, defined by NCES as those whose parents did not complete a college degree.
Given this demographic profile, writing placement and literacy emerge as central concerns, with nearly 50% of students placed into at least one DevEd course. The average pass rate for DevEd Levels 1 and 2 in 2023–2024 was 56%. Meanwhile, TCC’s retention rate is approximately 65%, and the graduation rate for full-time students stands at 27%. These metrics are critical as institutions work to support student completion and transition into the workforce.
3.2 Participants Demographics and Corpus Selection
To evaluate the representativeness of our sample relative to the broader Accuplacer test-taking population, as guided by our first research question, we examined institutional data from students who completed the Accuplacer exam during the same time period. Table 1 summarizes this data by gender, race, and native language.
| Demographics | Group | Test-Takers | % |
| Gender | Female | 1,244 | 62% |
| Male | 733 | 37% | |
| Other/Undisclosed | 26 | 1% | |
| Total | 2,003 | 100% | |
| Race | American Indian | 208 | 10% |
| Black or African American | 301 | 15% | |
| White | 813 | 41% | |
| Latino/Hispanic | 180 | 9% | |
| Other/Undisclosed | 501 | 25% | |
| Total | 2,003 | 100% | |
| Native Language | English (L1) | 1,384 | 69% |
| Non-English | 619 | 31% | |
| Total | 2,003 | 100% |
A total of 2,003 students (unduplicated count) completed the Accuplacer test, producing a written sample that was automatically assessed and classified by proficiency level. In terms of gender, the test-taking population was composed of 62% females and 37% males, closely mirroring the broader institutional demographics. Regarding race, approximately 41% of students self-identified as White, followed by Black or African American (15%), American Indian (10%), and Latino/Hispanic (9%) students, proportions that closely align with the overall student population. First-language data further indicated that 69% of test-takers reported English as their native language, comparable to the 66% institutional ratio.
Building on prior investigations999An earlier phase of this research analyzed a random subset of 450 essays (from the 2,003 total); demographic data was not examined as placement was the focus., this study narrows its analysis to the 1,384 participants who self-identified as native English (L1) speakers. Placement-level breakdowns for this group were available by gender only and are summarized in Table 2.
| Placement | Male | % | Female | % | Other/Undisclosed | % | Total |
|---|---|---|---|---|---|---|---|
| DevEd Level 1 | 24 | 21.82% | 39 | 35.45% | 2 | 1.82% | 65 |
| DevEd Level 2 | 225 | 22.59% | 443 | 44.48% | 5 | 0.50% | 673 |
| College Level | 252 | 28.25% | 378 | 42.38% | 12 | 1.35% | 642 |
| Score not available | 1 | 20.00% | 3 | 60.00% | 0 | 0.00% | 4 |
| Total | 502 | 25.06% | 863 | 43.09% | 19 | 0.95% | 1,384 |
From this table, we observed that approximately 53% of native English speakers were placed into one of the two DevEd levels (Level 1 or Level 2), with a higher concentration in Level 2. Placement into DevEd was slightly more common among female students. Notably, this 53% placement rate closely mirrors the broader institutional trend of approximately 50% outlined in Section 3.1.
To conduct a more detailed analysis, a subsample of 300 essays was randomly selected from the 1,384 native English speakers (22%). Within this subsample, complete and consistent demographic information was available for 210 participants, which formed the final dataset for this investigation. Among these participants, three racial groups are represented: American Indian (33; 16%), Black or African American (51; 24%), and White (125; 60%). One additional participant did not disclose their race but self-reported English as their native language (L1). Overall, the racial distribution in this subsample closely reflects both institutional demographics and those of the broader Accuplacer test-taking population.
Using the same placement classification criteria, we categorized these 210 participants into developmental and college-level groups, as summarized in Table 3.
| Placement | Male | % | Female | % | Other/Undisclosed | % | Total |
|---|---|---|---|---|---|---|---|
| DevEd Level 1 | 21 | 21% | 33 | 33% | 1 | 1% | 55 |
| DevEd Level 2 | 20 | 20% | 57 | 57% | 2 | 2% | 79 |
| College Level | 23 | 23% | 51 | 51% | 2 | 2% | 76 |
| Total | 64 | 21% | 141 | 47% | 5 | 2% | 210 |
From this table, it is observed that students classified as DevEd (in bold) accounted for approximately 64% of the placements within the subsample (210 participants), while those deemed proficient in writing (College Level; in italics) made up approximately 36%. Although smaller in size, this dataset, anchored in consistent demographic reporting, provides a foundation for the analyses examining the intersections between sociodemographic variables and linguistic features.
It is pertinent to note that all writing samples analyzed in this study were drawn from the institution’s official entrance exam database. The writing task required students to compose an argumentative response (in English) to a standardized prompt encouraging reflection on a social, educational, or ethical issue. Students were instructed to complete the task in a proctored environment, in a single sitting, and without access to dictionaries, the internet, or AI tools.
3.3 Feature Selection
In addition to the Accuplacer classifications, all 210 essays with complete demographic information were manually annotated and evaluated for skill level by two trained raters following classification guidelines developed by the authors [8, 9]. To mitigate potential bias, multiple safeguards were implemented: all essays were anonymized, raters were blinded to students’ demographic information, and a calibration session was conducted prior to annotation to ensure scoring consistency. In alignment with TCC’s Review Board protocols, raters had no access to race, gender, or other sociodemographic data at any stage. While these measures reduced the risk of bias, we acknowledge that implicit bias may still persist.
The annotation process involved marking each text with a set of 11 Developmental Education-Specific (DES) linguistic features. These features captured both negative patterns (errors and deviations from proficiency) and positive patterns (indicators of advanced language use). They were organized into four clusters – Orthographic (ORT), Grammatical (GRAMM), Lexical and Semantic (LEXSEM), and Discursive (DISC), each reflecting a critical dimension of foundational writing proficiency, as summarized in Table 4.
| Pattern Description | Features Clustered | ||||||
|---|---|---|---|---|---|---|---|
|
|
||||||
| Grammatical patterns (GRAMM): evidencing the quality of text production. |
|
||||||
|
|
||||||
| Discursive patterns (DISC): exhibiting the writer’s ability to produce | |||||||
| extended discourse. |
|
Beyond the DES features, additional linguistic features were integrated from prior work [11], which included 106 from Coh-Metrix and 328 from CTAP. Although 434 features101010A detailed description of these features can be found in the documentation of these tools. were originally extracted, only a subset was used in this study. Using Information Gain rankings from ML experiments, the most predictive features of placement were selected. Notably, two DES features – EXAMPLE and ORT – ranked 9th and 31st, respectively.
| Rank | Source | Features | Info. gain | ||
|---|---|---|---|---|---|
| 1 | COH-Metrix | Paragraph length, number of sentences in a paragraph, mean | 0.144 | ||
| 2 | COH-Metrix | Lexical diversity, VOCD, all words | 0.142 | ||
| 3 | CTAP | Lexical Sophistication: Easy noun tokens (NGSL) | 0.124 | ||
| 4 | COH-Metrix | LSA given/new, sentences, mean | 0.124 | ||
| 5 | CTAP | Lexical Richness: Type Token Ratio (STTR NGSLeasy Nouns) | 0.118 | ||
| 6 | COH-Metrix | Lexical diversity, MTLD, all words | 0.115 | ||
| 7 | CTAP | Number of POS Feature: Plural noun Types | 0.109 | ||
| 8 | COH-Metrix | LSA given/new, sentences, standard deviation | 0.109 | ||
| 9 | DES | EXAMPLE | 0.103 | ||
| 10 | CTAP | POS Density Feature: Existential There | 0.102 | ||
| 11 | COH-Metrix | Positive connectives incidence | 0.100 | ||
| 12 | COH-Metrix | LSA overlap, adjacent sentences, mean | 0.100 | ||
| 13 | CTAP | Number of POS Feature: Existential there Types | 0.099 | ||
| 14 | CTAP | Number of POS Feature: Preposition Types | 0.099 | ||
| 15 | COH-Metrix | WordNet verb overlap | 0.098 | ||
| 16 | CTAP | Number of Syntactic Constituents: Postnominal Noun Modifier | 0.097 | ||
| 17 | CTAP | Number of Word Types (including Punctuation and Numbers) | 0.097 | ||
| 18 | CTAP |
|
0.096 | ||
| 19 | CTAP | Number of POS Feature: Existential there Tokens | 0.096 | ||
| 20 | CTAP | Lexical Sophistication: Easy noun types (NGSL) | 0.094 | ||
| 21 | CTAP | Number of POS Feature: Verbs in past participle form Types | 0.092 | ||
| 22 | COH-Metrix | LSA verb overlap | 0.092 | ||
| 23 | CTAP | Number of Unique Words | 0.092 | ||
| 24 | CTAP | Number of Tokens with More Than 2 Syllables | 0.090 | ||
| 25 | CTAP | Number of Word Types with More Than 2 Syllables | 0.086 | ||
| 26 | CTAP | Lexical Richness: HDD (excluding punctuation and numbers) | 0.086 | ||
| 27 | CTAP | POS Density Feature: Possessive Ending | 0.086 | ||
| 28 | CTAP | Number of Syntactic Constituents: Complex Noun Phrase | 0.084 | ||
| 29 | CTAP | Number of POS Feature: Plural noun Tokens | 0.083 | ||
| 30 | CTAP | Referential Cohesion: Global Lemma Overlap | 0.083 | ||
| 31 | DES | ORT | 0.082 |
To emphasize the value of human-derived features, the remaining 9 DES features were retained, resulting in a final feature set of 40, as observed in Table 5. These DES features offer a finer-grained assessment of students’ communicative effectiveness in writing prior to beginning their academic programs [20] and have been documented before and associated with “discrete traits” of academic writing quality [29, 43]. Given ongoing concerns about disparities in placement outcomes across demographic lines, integrating these features with the sociodemographic variables identified for this study (gender and race) allows for a more comprehensive understanding of how writing traits intersect with placement decisions.
3.4 Statistical Tests
Three commonly used statistical tests, validated by the literature, were employed in this study: a one-way ANOVA, Tukey’s HSD, Chi-square test of independence.
The one-way ANOVA test was selected to determine whether statistically significant differences existed in linguistic feature means across groups with more than two categories, specifically gender and race, as supported in the literature [36]. For the interpretation of the -values, we used the following thresholds, commonly mentioned in the literature [38]:
indicates highly significant group differences;
indicates statistically significant group differences;
indicates marginally significant group differences;
indicates not significant group differences
While a multi-way ANOVA could have been used to test for interaction effects between gender and race, it was not applied here due to sample size limitations across intersecting subgroups (race × gender). To meet the assumptions of normality and homogeneity of variances, which are required for valid interaction testing, we opted for separate one-way ANOVAs to analyze each variable independently.
Following the ANOVA calculations, we conducted Tukey’s HSD tests to perform pairwise comparisons. This post-hoc analysis identified which specific groups differed significantly and gauged the magnitude of those differences. Tukey’s HSD has also been used in prior writing studies examining complexity and accuracy in student writing proficiency [4].
Finally, to examine potential associations between the demographic variables in this study and placement levels, both Accuplacer and human assigned, we used the Chi-square test of independence, appropriate for the categorical nature of placement outcomes.
4 Correlating Sociodemographics and Linguistic Features
Correlation with Gender
To address the second research question, namely, to what extent gender and race correlate with the use of linguistic features in student writing, we applied a one-way ANOVA test to the 210 essays completed by native English speakers. The linguistic features described in Section 3.3 were analyzed against the available demographic data for this subset.
Through a one-way ANOVA test, the means of the 40 continuous (ratios) linguistic variables were compared across three gender groups (male, female, other/undisclosed). In preparation for the calculations, we adopted the conventional threshold. The degrees of freedom between groups (dfB) were calculated using: , yielding dfB = 2 given the three gender groups. For the degrees of freedom within groups (dfW), the following formula was used: . While we have 210 individual data points, 3 groups’ means are calculated; therefore, dfW = 207, which is the number of degrees of freedom that remain for estimating variability within the groups. For subsequent experiments the same formulas were employed. All statistical calculations in this study were performed using Python.
When the ANOVA calculations were performed, 36 out of the 40 linguistic features showed no statistically significant differences across the three gender groups, as summarized in Table 6. Of the remaining four features, Positive connectives incidence (in bold), which captures words that aid in discourse flow and cohesion (e.g., however, similarly), showed a -value indicating a significant difference across gender groups (), a textual characteristic previously examined in writing assessment research [37]. The other three features (in italics), Lexical Richness: HDD (excluding punctuation and numbers) (-value = 0.051); Lexical Richness: Type Token Ratio (STTR NGSLeasy Nouns) (-value = 0.094); and Number of POS Feature: Existential there Types (-value = 0.064), indicating marginally significant group variation, which warrants further investigation.
| Features | Mean | Grand Mean | F-Stat. | Interp. | |||
|---|---|---|---|---|---|---|---|
| (M) | (F) | (O) | |||||
| Positive connectives incidence | 79.792 | 91.356 | 92.644 | 87.863 | 5.020 | 0.007 | S |
| Lexical Richness: | |||||||
| HDD (excluding punctuation and numbers) | 0.752 | 0.809 | 0.830 | 0.792 | 3.013 | 0.051 | M |
| Lexical Richness: Type Token Ratio | |||||||
| (STTR NGSLeasy Nouns) | 64.155 | 81.123 | 74.464 | 75.793 | 2.393 | 0.094 | M |
| Number of POS Feature: Existential there Types | 0.656 | 0.695 | 1.400 | 0.700 | 2.791 | 0.064 | M |
| Paragraph length, number of sentences in a paragraph, mean | 16.766 | 18.184 | 15.800 | 17.695 | 0.581 | 0.560 | N |
| LSA overlap, adjacent sentences, mean | 0.192 | 0.195 | 0.157 | 0.193 | 0.442 | 0.644 | N |
| LSA given/new, sentences, mean | 0.292 | 0.305 | 0.271 | 0.301 | 1.946 | 0.145 | N |
| LSA given/new, sentences, standard deviation | 0.138 | 0.135 | 0.114 | 0.135 | 1.042 | 0.355 | N |
| Lexical diversity, MTLD, all words | 74.905 | 71.166 | 79.811 | 72.512 | 0.884 | 0.415 | N |
| Lexical diversity, VOCD, all words | 76.060 | 75.993 | 79.409 | 76.095 | 0.026 | 0.975 | N |
| LSA verb overlap | 0.095 | 0.099 | 0.089 | 0.098 | 0.619 | 0.540 | N |
| WordNet verb overlap | 0.516 | 0.524 | 0.498 | 0.521 | 0.258 | 0.773 | N |
| Lexical Sophistication Feature: SUBTLEX Log. Word Freq. | |||||||
| (AW Type) | 4.155 | 4.227 | 4.106 | 4.202 | 1.678 | 0.189 | N |
| Lexical Sophistication: Easy noun tokens (NGSL) | 38.188 | 43.660 | 41.800 | 41.948 | 1.391 | 0.251 | N |
| Lexical Sophistication: Easy noun types (NGSL) | 23.578 | 24.858 | 24.600 | 24.462 | 0.253 | 0.777 | N |
| Number of POS Feature: Existential there Tokens | 1.156 | 1.227 | 1.600 | 1.214 | 0.198 | 0.820 | N |
| Number of POS Feature: Plural noun Tokens | 19.453 | 19.660 | 20.200 | 19.610 | 0.012 | 0.988 | N |
| Number of POS Feature: Plural noun Types | 13.391 | 12.695 | 14.200 | 12.943 | 0.246 | 0.782 | N |
| Number of POS Feature: Preposition Types | 16.094 | 16.326 | 17.400 | 16.281 | 0.137 | 0.872 | N |
| Number of POS Feature: Verbs in past participle form Types | 5.328 | 5.184 | 8.200 | 5.300 | 1.401 | 0.249 | N |
| Number of Syntactic Constituents: Complex Noun Phrase | 38.813 | 39.348 | 45.400 | 39.329 | 0.259 | 0.772 | N |
| Number of Syntactic Constituents: Prenominal Noun Modifier | 20.453 | 19.106 | 21.400 | 19.571 | 0.340 | 0.712 | N |
| Number of Tokens with More Than 2 Syllables | 94.875 | 93.780 | 94.600 | 94.133 | 0.011 | 0.989 | N |
| Number of Unique Words | 104.922 | 101.567 | 113.600 | 102.876 | 0.291 | 0.748 | N |
| Number of Word Types (including Punctuation and Numbers) | 163.219 | 166.014 | 174.800 | 165.371 | 0.092 | 0.913 | N |
| Number of Word Types with More Than 2 Syllables | 71.359 | 67.532 | 76.200 | 68.905 | 0.352 | 0.704 | N |
| POS Density Feature: Existential There | 0.003 | 0.003 | 0.004 | 0.003 | 0.125 | 0.883 | N |
| POS Density Feature: Possessive Ending | 0.002 | 0.001 | 0.003 | 0.002 | 0.568 | 0.568 | N |
| Referential Cohesion: Global Lemma Overlap | 0.609 | 0.726 | 0.770 | 0.691 | 1.125 | 0.327 | N |
| MWE | 0.072 | 0.071 | 0.061 | 0.071 | 0.121 | 0.886 | N |
| VDISAGREE | 0.002 | 0.003 | 0.003 | 0.003 | 0.683 | 0.506 | N |
| ORT | 0.051 | 0.046 | 0.030 | 0.047 | 0.855 | 0.427 | N |
| PUNCT | 0.042 | 0.043 | 0.041 | 0.043 | 0.044 | 0.957 | N |
| WORDOMIT | 0.006 | 0.008 | 0.005 | 0.007 | 0.821 | 0.442 | N |
| PRECISION | 0.011 | 0.011 | 0.006 | 0.011 | 0.436 | 0.648 | N |
| WORDREPT | 0.002 | 0.002 | 0.003 | 0.002 | 0.538 | 0.585 | N |
| REASON | 0.005 | 0.006 | 0.005 | 0.005 | 0.196 | 0.822 | N |
| WORDSPLIT | 0.002 | 0.002 | 0.001 | 0.002 | 0.306 | 0.737 | N |
| EXAMPLE | 0.002 | 0.003 | 0.002 | 0.002 | 0.154 | 0.858 | N |
| ALTERN | 0.001 | 0.002 | 0.001 | 0.001 | 0.084 | 0.920 | N |
Correlation with Race
Following the same statistical approach described in Section 4, we examined whether differences emerged in the use of all 40 linguistic features across four racial groups (American Indian, Black or African American, White, Other/Undisclosed). This time dfB = 3 given the four racial groups. While we still have 210 individual data points, 4 groups’ means are calculated; therefore, dfW = 206.
As shown in Table 7, 31 features showed no meaningful differences across racial groups (compared to 36 features in the gender-based analysis).
| Features | Mean | Grand Mean | F-Stat. | Interp. | ||||
|---|---|---|---|---|---|---|---|---|
| (1) | (2) | (3) | (5) | |||||
| PUNCT | 0.037 | 0.056 | 0.038 | 0.091 | 0.043 | 6.674 | 0.000 | S |
| WORDOMIT | 0.006 | 0.013 | 0.006 | 0.011 | 0.007 | 8.796 | 0.000 | S |
| PRECISION | 0.009 | 0.018 | 0.009 | 0.023 | 0.011 | 5.871 | 0.001 | S |
| Positive connectives incidence | 78.282 | 96.936 | 86.524 | 108.571 | 87.863 | 4.439 | 0.005 | St |
| Lexical Sophistication Feature: | ||||||||
| SUBTLEX Log. Word Freq. (AW Type) | 4.169 | 4.301 | 4.167 | 4.634 | 4.202 | 3.634 | 0.014 | St |
| Number of Syntactic Constituents: | ||||||||
| Prenominal Noun Modifier | 20.546 | 15.706 | 20.992 | 7.000 | 19.571 | 2.913 | 0.035 | St |
| WordNet verb overlap | 0.502 | 0.553 | 0.513 | 0.576 | 0.521 | 2.200 | 0.089 | M |
| ORT | 0.045 | 0.059 | 0.042 | 0.091 | 0.047 | 2.553 | 0.057 | M |
| REASON | 0.005 | 0.008 | 0.005 | 0.000 | 0.005 | 2.509 | 0.060 | M |
| Paragraph length, number of sentences in a paragraph, mean | 17.576 | 16.353 | 18.368 | 6.000 | 17.695 | 1.038 | 0.377 | N |
| LSA overlap, adjacent sentences, mean | 0.197 | 0.213 | 0.183 | 0.283 | 0.193 | 1.746 | 0.159 | N |
| LSA given/new, sentences, mean | 0.304 | 0.300 | 0.300 | 0.314 | 0.301 | 0.061 | 0.980 | N |
| LSA given/new, sentences, standard deviation | 0.141 | 0.141 | 0.132 | 0.165 | 0.135 | 1.385 | 0.249 | N |
| Lexical diversity, MTLD, all words | 73.130 | 68.164 | 74.002 | 87.500 | 72.512 | 0.981 | 0.403 | N |
| Lexical diversity, VOCD, all words | 75.327 | 70.684 | 78.469 | 80.586 | 76.095 | 0.687 | 0.561 | N |
| LSA verb overlap | 0.094 | 0.100 | 0.098 | 0.086 | 0.098 | 0.264 | 0.851 | N |
| Lexical Richness: HDD (excluding punctuation and numbers) | 0.773 | 0.783 | 0.801 | 0.825 | 0.792 | 0.354 | 0.787 | N |
| Lexical Richness: Type Token Ratio | ||||||||
| (STTR NGSLeasy Nouns) | 70.466 | 74.924 | 78.026 | 16.900 | 75.793 | 0.625 | 0.599 | N |
| Lexical Sophistication: Easy noun tokens (NGSL) | 40.000 | 39.765 | 43.584 | 13.000 | 41.948 | 1.081 | 0.358 | N |
| Lexical Sophistication: Easy noun types (NGSL) | 23.303 | 22.726 | 25.592 | 10.000 | 24.462 | 1.341 | 0.262 | N |
| Number of POS Feature: Existential there Tokens | 0.909 | 1.275 | 1.280 | 0.000 | 1.214 | 0.713 | 0.546 | N |
| Number of POS Feature: Existential there Types | 0.576 | 0.647 | 0.760 | 0.000 | 0.700 | 1.133 | 0.337 | N |
| Number of POS Feature: Plural noun Tokens | 19.455 | 17.412 | 20.632 | 9.000 | 19.610 | 1.112 | 0.345 | N |
| Number of POS Feature: Plural noun Types | 13.970 | 11.059 | 13.496 | 6.000 | 12.943 | 1.719 | 0.164 | N |
| Number of POS Feature: Preposition Types | 15.758 | 15.863 | 16.624 | 12.000 | 16.281 | 0.532 | 0.661 | N |
| Number of POS Feature: | ||||||||
| Verbs in past participle form Types | 5.121 | 4.412 | 5.736 | 2.000 | 5.300 | 1.620 | 0.186 | N |
| Number of Syntactic Constituents: Complex Noun Phrase | 37.697 | 36.059 | 41.256 | 19.000 | 39.329 | 1.309 | 0.272 | N |
| Number of Tokens with More Than 2 Syllables | 92.909 | 85.392 | 98.496 | 35.000 | 94.133 | 1.316 | 0.270 | N |
| Number of Unique Words | 102.546 | 93.961 | 106.920 | 63.000 | 102.876 | 1.395 | 0.246 | N |
| Number of Word Types | ||||||||
| (including Punctuation and Numbers) | 160.727 | 155.137 | 171.280 | 102.000 | 165.371 | 1.113 | 0.345 | N |
| Number of Word Types with More Than 2 Syllables | 69.515 | 59.686 | 72.840 | 27.000 | 68.905 | 2.101 | 0.101 | N |
| POS Density Feature: Existential There | 0.003 | 0.003 | 0.004 | 0.000 | 0.003 | 0.516 | 0.672 | N |
| POS Density Feature: Possessive Ending | 0.002 | 0.002 | 0.001 | 0.000 | 0.002 | 0.052 | 0.984 | N |
| Referential Cohesion: Global Lemma Overlap | 0.605 | 0.689 | 0.719 | 0.200 | 0.691 | 0.680 | 0.565 | N |
| MWE | 0.069 | 0.078 | 0.069 | 0.120 | 0.071 | 0.844 | 0.471 | N |
| VDISAGREE | 0.003 | 0.003 | 0.002 | 0.011 | 0.003 | 0.967 | 0.409 | N |
| WORDREPT | 0.001 | 0.003 | 0.002 | 0.000 | 0.002 | 0.754 | 0.521 | N |
| WORDSPLIT | 0.002 | 0.002 | 0.002 | 0.000 | 0.002 | 0.071 | 0.976 | N |
| EXAMPLE | 0.002 | 0.002 | 0.003 | 0.000 | 0.002 | 0.617 | 0.605 | N |
| ALTERN | 0.002 | 0.002 | 0.001 | 0.000 | 0.001 | 0.368 | 0.776 | N |
The remaining nine features, particularly those connected to syntax complexity, discourse markers, and lexical precision, revealed differences among racial groups. Out of the nine, four of them (bolded), namely, Positive Connectives Incidence, PUNCT, WORDOMIT, and PRECISION, yielded -values that indicated significant differences across race groups. Two features (also bolded), Lexical Sophistication (SUBTLEX Logarithmic Word Frequency) and Number of Syntactic Constituents: Prenominal Noun Modifier, produced -values suggesting statistically significant group differences. The remaining three (in italics), WordNet Verb Overlap, ORT, and REASON, were considered marginally significant, indicating that how these groups exhibit (or not) these linguistic features in their written productions requires further investigation.
Five of these features belong to the DES feature set, suggesting that racial group differences may be more pronounced when assessment focuses on more targeted, humanly-devised indicators of developmental writing. Notably, the Positive Connectives Incidence feature emerged as significant in both the gender and race analyses, potentially highlighting its importance in capturing variation in students’ writing patterns. The differences here analyzed were not uniformly distributed across all features, indicating that group identity may influence only specific aspects of writing.
Beyond the One-way ANOVA
While the one-way ANOVA identified overall group differences by gender and race, Tukey’s HSD post-hoc test was used to determine which specific groups differed from one another.
For the gender analysis, we zeroed in on the statistical differences highlighted in Section 4111111For brevity, Tukey’s HSD tests were only conducted on this feature set; other features, including those identified for racial groups, will be analyzed in future work.. The sample analyzed consisted of 141 females (F) and 64 males (M), for a total of 205 participants. The “Other/Undisclosed” category, which had only 5 participants, was excluded in an attempt to make comparisons involving the other two groups as statistically stable as possible. Consequently, for the Tukey’s HSD test, the following values were used: (groups: Male, Female); dfW = 203; ; .
| Feature | Mean Dif. (F-M) | Stand. Err. | q-Stat | Sign. |
|---|---|---|---|---|
| Positive connectives incidence | 11.564 | 5.161 | 2.241 | N |
| Lexical Richness: HDD (excluding punctuation and numbers) | 0.058 | 0.033 | 1.736 | N |
| Lexical Richness: Type Token Ratio (STTR NGSLeasy Nouns) | 16.968 | 10.970 | 1.547 | N |
| Number of POS Feature: Existential there Types | 0.039 | 0.023 | 1.671 | N |
From Table 8, we see that all pairwise comparisons by gender were not statistically significant at , as the calculated -statistics for all four linguistic features examined fell below the critical value of . Although some mean differences, particularly for Positive Connectives Incidence were notable, they did not exceed the threshold for significance. Consequently, we cannot reject the null hypothesis, which posits no meaningful differences in the use of linguistic features across gender groups. These findings should be interpreted with caution, as the limited sample size and unequal group distributions could limit the statistical power to detect more subtle effects.
| Feature | Mean Diff | Stand. Error | q-Stat | ||||
|---|---|---|---|---|---|---|---|
| (1–2) | (1–3) | (2–3) | (1–2) | (1–3) | (2–3) | ||
| PUNCT | 0.019 | 0.001 | 0.018 | 0.006 | 3.247 | 0.174 | 3.074 |
| WORDOMIT | 0.007 | 0.000 | 0.007 | 0.002 | 3.606 | 0.052 | 3.658 |
| PRECISION | 0.009 | 0.001 | 0.008 | 0.003 | 3.065 | 0.204 | 2.860 |
| Positive connectives incidence | 18.654 | 8.243 | 10.411 | 6.275 | 2.973 | 1.314 | 1.659 |
| Lexical Sophistication Feature: SUBTLEX Log Word Freq (AW Type) | 0.132 | 0.002 | 0.134 | 0.057 | 2.319 | 0.032 | 2.350 |
| Number of Syntactic Constituents: Prenominal Noun Modifier | 4.840 | 0.447 | 5.286 | 2.429 | 1.992 | 0.184 | 2.176 |
| WordNet verb overlap | 0.050 | 0.011 | 0.040 | 0.025 | 1.990 | 0.419 | 1.570 |
| ORT | 0.013 | 0.003 | 0.017 | 0.008 | 1.717 | 0.413 | 2.131 |
| REASON | 0.002 | 0.001 | 0.003 | 0.001 | 1.614 | 0.538 | 2.152 |
We then turned to the post-hoc analysis for the race groups. For Tukey’s HSD test, the following values were used: [race groups: American Indian (1), Black or African American (2), and White (3)]. The Other/Undisclosed race category previously mentioned included only one student. Due to this small count, this category was excluded from the statistical analysis in an attempt to preserve the reliability of the test results. For dfW = 208; ; .
As shown in Table 9, statistically significant differences (in bold) were found for WORDOMIT, PUNCT, and PRECISION between Groups 1 and 2 as well as Groups 2 and 3. A borderline yet statistically significant difference in Positive Connectives Incidence was also observed between Groups 1 and 2 only. Based on the individual means already reported in Table 7, students who identified as Black or African American tended to exhibit a higher incidence of omitted or left-out parts of speech compared to both American Indian and White students. These omissions may affect the overall coherence of their writing. In contrast, American Indian and White students showed nearly identical omission ratios.
Students identifying as Black or African American also used punctuation (e.g., for joining clauses) less frequently than their peers, and exhibited a higher rate of imprecise word usage to describe a concept, as captured by the PRECISION feature. On the contrary, Black or African American students showed a higher incidence of Positive Connectives than American Indian students, suggesting greater use of linking expressions such as however or similarly. These differences may reflect dialectal or regional variation rather than deficits in academic ability [34]. However, given that placement decisions are tied to institutional standards that may not fully account for this linguistic diversity, it is essential that pedagogical interventions not be seen as merely corrective measures but as opportunities to support students in expanding their register and linguistic skills to better navigate academic expectations.
It is equally important to acknowledge that these differences were identified from samples produced at a single point in time, and that external factors, such as test anxiety or unfamiliarity with the writing prompt, may have also influenced students’ performance.
5 Assessing Level Assignment with Demographics
Assesment with Gender
To evaluate the possible association between gender and Accuplacer placement levels, in response to our third research question, a Chi-square test of independence was performed as the final step in this analysis. Table 10 presents the observed counts, expected counts under the null hypothesis of independence, and the individual Chi-square contributions for each cell.
| Placement Level | Gender | Observed | Expected | (O - E)2 / E |
| DevEd Level 1 | Male | 21 | 16.859 | 1.017 |
| Female | 33 | 37.141 | 0.462 | |
| DevEd Level 2 | Male | 20 | 24.039 | 0.679 |
| Female | 57 | 52.961 | 0.308 | |
| College Level | Male | 23 | 23.102 | 0.000 |
| Female | 51 | 50.898 | 0.000 | |
| Total | - | 205 | 205 | 2.467 |
The expected counts were calculated based on the assumption that gender and placement level are independent, and the values represent each cell’s contribution to the overall Chi-square statistic. The total sum of these contributions yielded the total Chi-square value . To assess statistical significance, we compared the calculated value to the critical Chi-square value , determined for and . Alternatively, the associated -value was considered. Since and , we cannot reject the null hypothesis and conclude that there is no statistically significant association between gender and the automatically assigned skill levels via Accuplacer.
The same procedure was applied using the human-assigned skill levels, with identical degrees of freedom and significance thresholds. Because human raters assigned different placement levels than Accuplacer, the distribution of texts by levels varies.
| Placement Level | Gender | Observed | Expected | (O - E)2 / E |
| DevEd Level 1 | Male | 14 | 13.112 | 0.060 |
| Female | 28 | 28.888 | 0.027 | |
| DevEd Level 2 | Male | 36 | 38.088 | 0.114 |
| Female | 86 | 83.912 | 0.051 | |
| College Level | Male | 14 | 12.8 | 0.112 |
| Female | 27 | 28.2 | 0.051 | |
| Total | - | 205 | 205 | 0.415 |
The expected counts, as included in Table 11, were calculated based on the same assumption that gender and placement level are independent, and the values represent each cell’s contribution to the overall Chi-square statistic. The total sum of these contributions yielded the total Chi-square value . The critical Chi-square value was the same . Alternatively, the associated -value was considered. Since and , we also conclude that there is no statistically significant association between gender and the human-assigned placement levels.
Assessment with Race
We also examined whether there was an association first between racial groups and the classification by skill level produced by Accuplacer, and, second, with the human ratings. The distribution of placement levels across racial groups, along with their corresponding observed and expected counts and Chi-square contributions, is presented in Table 12.
| Placement Level | Race | Observed | Expected | (O - E)2 / E |
| DevEd Level 1 | American Indian | 10 | 8.526 | 0.255 |
| Black or African American | 14 | 13.177 | 0.051 | |
| White | 30 | 32.297 | 0.163 | |
| DevEd Level 2 | American Indian | 10 | 12.474 | 0.491 |
| Black or African American | 25 | 19.278 | 1.699 | |
| White | 44 | 47.249 | 0.223 | |
| College Level | American Indian | 13 | 12.000 | 0.083 |
| Black or African American | 12 | 18.546 | 2.310 | |
| White | 51 | 45.455 | 0.677 | |
| Total | - | 209 | 209 | 5.952 |
The degrees of freedom were calculated based on 3 three levels (DevEd Level 1, DevEd Level 2, College Level) and 3 racial groups (American Indian, Black or African American, and White). The computed Chi-square statistic yielded a value of , which does not exceed the critical value of 9.488 for 4 degrees of freedom at the level. The associated -value of is above the conventional threshold for statistical significance. Therefore, we cannot reject the null hypothesis, indicating no statistically significant association between race and Accuplacer placement level within this sample.
Finally, the assessment was repeated but with the humanly-assigned skill level. Table 13 summarizes the observed and expected counts and Chi-square contributions.
| Placement Level | Race | Observed | Expected | (O - E)2 / E |
| DevEd Level 1 | American Indian | 4 | 6.914 | 1.228 |
| Black or African American | 17 | 10.686 | 3.731 | |
| White | 22 | 26.191 | 0.671 | |
| DevEd Level 2 | American Indian | 20 | 19.486 | 0.014 |
| Black or African American | 29 | 30.114 | 0.041 | |
| White | 75 | 73.810 | 0.019 | |
| College Level | American Indian | 9 | 6.600 | 0.873 |
| Black or African American | 5 | 10.200 | 2.651 | |
| White | 28 | 25.000 | 0.360 | |
| Total | - | 209 | 209 | 9.588 |
The computed Chi-square statistic yielded a value of , which slightly exceeds the critical value of 9.488 for 4 degrees of freedom at the level. The associated -value of falls just below the conventional threshold for statistical significance. While this suggests a possible association between race and human-assigned placement levels, even though raters did not have access to demographic data, the result is borderline and should be interpreted cautiously, warranting further investigation.
Upon analyzing each individual Chi-square contribution, we focused on values with the greatest discrepancies between the observed and expected counts within the race. This approach enabled us to identify, within the context of this sample, whether certain racial groups were overrepresented or underrepresented at specific placement levels. A higher observed count relative to the expected suggests overrepresentation, with a lower observed count indicating underrepresentation (italicized values).
In the DevEd Level 1 category, students who self-identified as Black or African American appeared to be more frequently than expected placed within this level, which may help explain their comparatively lower representation at the College Level. In contrast, students who identified as White were more frequently placed in DevEd Level 2 and College Level, indicating a higher-than-expected concentration in those categories. The variations between the observed and expected contributions for American Indians, within each placement level, were not as pronounced as those of the other groups.
6 Conclusions
This study investigated the intersection of sociodemographic characteristics, linguistic features, and writing placement outcomes in a higher education context. We analyzed a corpus of 210 anonymized writing samples from native English speakers (L1), representative of the institution’s demographic composition. Using 40 top-ranked linguistic features drawn from Coh-Metrix, CTAP, and Developmental Education-Specific (DES) feature sets, we assessed potential disparities across gender and race using three statistical tests: one-way ANOVA, Tukey’s HSD, and Chi-square.
The results we obtained provided evidence that not all linguistic features are equally sensitive to demographic variation. Gender, in particular, does not appear to have an influence on the linguistic features measured. This finding supports the idea that, at least for the features examined, variation in writing may not be primarily driven by gender.
Among racial groups, in contrast, a total of 9 features, particularly those tied to syntax complexity, discourse markers, and lexical precision, revealed differences. These features were mostly found within the human-devised set (DES) and aligned with the focus of DevEd courses. While not designed to directly measure academic ability, these DES features offer valuable diagnostic insight into students’ current writing performance at the onset of college and align with DevEd’s mission of identifying support needs for student success.
Comparing automated and human-assigned placement classifications, no significant associations were found with gender. However, a borderline significant association between race and human-assigned placement levels () raises important questions about raters’ sensitivity to linguistic features that intersect with race. This finding highlights the need for continued efforts to ensure placement fairness and address potential bias. Because human evaluation remains essential for detecting nuanced linguistic patterns that automated systems may overlook, our findings advocate for a combined approach that leverages the strengths of human judgment and automated analysis to potentially: (i) enhance placement accuracy and educational outcomes; (ii) guide targeted instruction; and (iii) support the development of more equitable and responsive placement tools.
References
- [1] Hervé Abdi and Lynne J Williams. Tukey’s Honestly Significant Difference (HSD) test. Encyclopedia of Research Design, 3(1):1–5, 2010.
- [2] Lisa R Arnold, Lei Jiang, and Holly Hassel. After implementation: Assessing student self-placement in college writing programs. Journal of Writing Assessment, 17(1), 2024.
- [3] Elisabeth A Barnett, Elizabeth Kopko, Dan Cullinan, and Clive R Belfield. Who should take college-level courses? Impact findings from an evaluation of a multiple measures assessment strategy. Center for the Analysis of Postsecondary Readiness, 2020.
- [4] Jessie S Barrot and Joan Y Agdeppa. Complexity, accuracy, and fluency as indices of college-level L2 writers’ proficiency. Assessing Writing, 47:100510, 2021.
- [5] Susan Bickerstaff, Katie Beal, Julia Raufman, Erika B Lewy, and Austin Slaughter. Five principles for reforming Developmental Education: A review of the evidence. Center for the Analysis of Postsecondary Readiness, pages 1–8, 2022.
- [6] Carolina Castillo and Natalia Ávila Reyes. Students’ sociodemographic characteristics and writing performance: A systematic literature review. Reading and Writing, pages 1–37, 2025.
- [7] Xiaobin Chen and Detmar Meurers. CTAP: A Web-Based Tool Supporting Automatic Complexity Analysis. In Proceedings of the Workshop on Computational Linguistics for Linguistic Complexity (CL4LC), pages 113–119, Osaka, Japan, December 2016. The COLING 2016 Organizing Committee. URL: https://aclanthology.org/W16-4113.
- [8] Miguel Da Corte and Jorge Baptista. Charting the linguistic landscape of developing writers: An annotation scheme for enhancing native language proficiency. In Nicoletta Calzolari, Min-Yen Kan, Veronique Hoste, Alessandro Lenci, Sakriani Sakti, and Nianwen Xue, editors, Proceedings of the 2024 Joint International Conference on Computational Linguistics, Language Resources and Evaluation (LREC-COLING 2024), pages 3046–3056, Torino, Italia, May 2024. ELRA and ICCL. URL: https://aclanthology.org/2024.lrec-main.272/.
- [9] Miguel Da Corte and Jorge Baptista. Enhancing writing proficiency classification in Developmental Education: The quest for accuracy. In Nicoletta Calzolari, Min-Yen Kan, Veronique Hoste, Alessandro Lenci, Sakriani Sakti, and Nianwen Xue, editors, Proceedings of the 2024 Joint International Conference on Computational Linguistics, Language Resources and Evaluation (LREC-COLING 2024), pages 6134–6143, Torino, Italia, May 2024. ELRA and ICCL. URL: https://aclanthology.org/2024.lrec-main.542/.
- [10] Miguel Da Corte and Jorge Baptista. Leveraging NLP and machine learning for English (l1) writing assessment in developmental education. In Proceedings of the 16th International Conference on Computer Supported Education (CSEDU 2024), 2-4 May, 2024, Angers, France, volume 2, pages 128–140, 2024. doi:10.5220/0012740500003693.
- [11] Miguel Da Corte and Jorge Baptista. Refining English writing proficiency assessment and placement in Developmental Education using NLP tools and Machine Learning. In Proceedings of the 17th International Conference on Computer Supported Education - Volume 2: CSEDU, pages 288–303. INSTICC, SciTePress, 2025. doi:10.5220/0013351500003932.
- [12] Miguel Da Corte and Jorge Baptista. Toward consistency in writing proficiency assessment: Mitigating classification variability in Developmental Education. In Proceedings of the 17th International Conference on Computer Supported Education - Volume 2: CSEDU, pages 139–150. INSTICC, SciTePress, 2025. doi:10.5220/0013353900003932.
- [13] Jane Denison-Furness, Stacey Lee Donohue, Annemarie Hamlin, and Tony Russell. Welcome/Not Welcome: From Discouragement to Empowerment in the Writing Placement Process at Central Oregon Community College. In Jassica Nastal, Mya Poe, and Christie Toth, editors, Writing Placement in Two-Year Colleges: The Pursuit of Equity in Postsceondary Education, pages 107–127. The WAC Clearinghouse/University Press of Colorado, 2022. doi:10.37514/PRA-B.2022.1565.2.04.
- [14] Martin East and David Slomp. The ethical turn in writing assessment: How far have we come, and where do we still need to go? Language Teaching, 57(2):262–273, 2024.
- [15] Nikki Edgecombe and Michael Weiss. Promoting equity in Developmental Education reform: A conversation with Nikki Edgecombe and Michael Weiss. Center for the Analysis of Postsecondary Readiness, page 1, 2024.
- [16] Elizabeth Ganga and Amy Mazzariello. Modernzing college course placement by using multiple measures. Education Commission of the States, pages 1–9, 2019. URL: https://postsecondaryreadiness.org/wp-content/uploads/2019/03/Modernizing_College_Course_Placement_by_Using_Multiple_Measures_Final.pdf.
- [17] Sandra Götz and Sylviane Granger. Learner corpus research for pedagogical purposes: An overview and some research perspectives. International Journal of Learner Corpus Research, 10(1):1–38, 2024.
- [18] Sarah Hirsch, Kenny Smith, and Madeleine Sorapure. Collaborative writing placement: Partnering with students in the placement process. Journal of Writing Assessment, 17(2), 2024.
- [19] Darin L Jensen and Joanne Baird Giordano. Afterword. Placement, equity, and the promise of democratic open-access education. Writing Placement in Two-Year Colleges: The Pursuit of Equity in Postsecondary Education, pages 279–86, 2022.
- [20] Young-Suk Grace Kim, Christopher Schatschneider, Jeanne Wanzek, Brandy Gatlin, and Stephanie Al Otaiba. Writing evaluation: Rater and task effects on the reliability of writing scores for children in grades 3 and 4. Reading and writing, 30:1287–1310, 2017.
- [21] Holly Kosiewicz, Cristián Morales, and Kalena E. Cortes. The “missing English learner”’ in higher education: How identification, assessment, and placement shape the educational outcomes of English learners in community colleges. In Higher Education: Handbook of Theory and Research: Volume 39, pages 1–55. Springer, 2023.
- [22] Josh Lederman. Validity and racial justice in educational assessment. Applied Measurement in Education, 36(3):242–254, 2023. doi:10.1080/08957347.2023.2214654.
- [23] Bruce W Lee and Jason Hyung-Jong Lee. Prompt-based learning for text readability assessment. In In Proceedings of the 18th Workshop on Innovative Use of NLP for Building Educational Applications (BEA 2023), pages 1–19. Toronto, Canada. Association forComputational Linguistics., 2023.
- [24] Stephanie Link and Svetlana Koltovskaia. Automated Scoring of Writing, pages 333–345. Springer International Publishing, Cham, 2023. doi:10.1007/978-3-031-36033-6_21.
- [25] Susan Lyons, Maria Elena Oliveri, and Mya Poe. A framework for enacting equity aims in assessment use: A justice-oriented approach. In Culturally Responsive Assessment in Classrooms and Large-Scale Contexts, pages 88–105. Routledge, 2025.
- [26] Ross Markle. Redesigning course placement in service of guided pathways. Educational Considerations, 50(2):8, 2025.
- [27] Michael Matta and Narmene Hamsho and. Consequences of response formats on racial and ethnic bias and fairness in writing assessments. School Psychology Review, 0(0):1–14, 2025. doi:10.1080/2372966X.2025.2462984.
- [28] Danielle S McNamara, Yasuhiro Ozuru, Arthur C Graesser, and Max Louwerse. Validating CoH-Metrix. In Proceedings of the 28th annual Conference of the Cognitive Science Society, pages 573–578, 2006.
- [29] Neil Murray and Gerard Sharpling and. What traits do academics value in student writing? Insights from a psychometric approach. Assessment & Evaluation in Higher Education, 44(3):489–500, 2019. doi:10.1080/02602938.2018.1521372.
- [30] Jessica Nastal. Beyond tradition: Writing placement, fairness, and success at a two-year college. Journal of Writing Assessment, 12(1), 2019.
- [31] Jessica Nastal and Kris Messer. Afterword: Finding the right note in writing placement. Journal of Writing Assessment, 18(1), 2025.
- [32] Mari Nygård and Anne Kathrine Hundal. Features of grammatical writing competence among early writers in a Norwegian school context. Languages, 9(1):29, 2024.
- [33] María Elena Oliveri, René Lawless, and Robert J. Mislevy. Using evidence-centered design to support the development of culturally and linguistically sensitive collaborative problem-solving assessments. International Journal of Testing, 19(3):270–300, 2019. doi:10.1080/15305058.2018.1543308.
- [34] Ramona T Pittman, Lynette O’Neal, Kimberly Wright, and Brittany R White. Elevating students’ oral and written language: Empowering African American students through language. Education Sciences, 14(11):1191, 2024.
- [35] Mya Poe, Jessica Nastal, and Norbert Elliot. Reflection. An admitted student is a qualified student: A roadmap for writing placement in the two-year college. Journal of Writing Assessment, 12(1), 2019.
- [36] Jennifer Reid, Mahshid Ahmadian, D. Jennings, Anathea Abad Pepperl, and et.al. Saying it aloud: Inclusive teaching statements impact on sense of belonging and engagement. Journal of College Science Teaching, 0(0):1–14, 2025. doi:10.1080/0047231X.2025.2487437.
- [37] Rachael Ruegg. Assessment of written assignments in first-year Humanities and Social Sciences courses: Textual features of academic writing. Assessment in Education: Principles, Policy & Practice, 32(1):60–76, 2025. doi:10.1080/0969594X.2025.2467672.
- [38] Padam Singh. P value, statistical significance and clinical significance. Journal of Clinical and Preventive Cardiology, 2(4):202–204, 2013.
- [39] J Suárez-Álvarez, M Oliveri, A Zenisky, and SG Sireci. Current assessment needs in adult education and workforce development: Summary report (center for educational assessment report no. 998). Center for Educational Assessment, 2023. URL: https://createadultskills.org/system/files/ASAP%20Brief%201_Nov%202023_Needs%20Assessment.pdf.
- [40] Meghan Sweeney and Crystal Colombini. (Re) placing personalis: A study of placement reform and self-construction in mission-driven contexts. Journal of Writing Assessment, 17(1), 2024.
- [41] The College Board. ACCUPLACER Program Manual. (online), 2022. URL: https://secure-media.collegeboard.org/digitalServices/pdf/accuplacer/accuplacer-program-manual.pdf.
- [42] Rodrigo Wilkens, David Alfter, Xiaoou Wang, Alice Pintard, Anaïs Tack, Kevin P Yancey, and Thomas François. Fabra: French aggregator-based readability assessment toolkit. In Proceedings of the Thirteenth Language Resources and Evaluation Conference, pages 1217–1233, 2022. URL: https://aclanthology.org/2022.lrec-1.130.
- [43] Sachiko Yasuda. What does it mean to construct an argument in academic writing? a synthesis of English for general academic purposes and English for specific academic purposes perspectives. Journal of English for Academic Purposes, 66:101307, 2023.