Mobility Data Science
Abstract
This report documents the program and the outcomes of Dagstuhl Seminar 22021 “Mobility Data Science”. This seminar was held January 9-14, 2022, including 47 participants from industry and academia. The goal of this Dagstuhl Seminar was to create a new research community of mobility data science in which the whole is greater than the sum of its parts by bringing together established leaders as well as promising young researchers from all fields related to mobility data science.
Specifically, this report summarizes the main results of the seminar by (1) defining Mobility Data Science as a research domain, (2) by sketching its agenda in the coming years, and by (3) building a mobility data science community. (1) Mobility data science is defined as spatiotemporal data that additionally captures the behavior of moving entities (human, vehicle, animal, etc.). To understand, explain, and predict behavior, we note that a strong collaboration with research in behavioral and social sciences is needed. (2) Future research directions for mobility data science described in this report include a) mobility data acquisition and privacy, b) mobility data management and analysis, and c) applications of mobility data science. (3) We identify opportunities towards building a mobility data science community, towards collaborations between academic and industry, and towards a mobility data science curriculum.
Keywords and phrases:
Spatio-temporal, Tracking, Privacy, Behavior, Data cleaning, Data management, AnalyticsSeminar:
January 9–14, 2022 – http://www.dagstuhl.de/220212012 ACM Subject Classification:
Information systems Information systems applications ; Information systems Data management systemsCopyright and License:
![[Uncaptioned image]](x1.png) Except where otherwise noted, content of this report is licensed under a
Creative Commons BY 4.0 International license
Except where otherwise noted, content of this report is licensed under a
Creative Commons BY 4.0 International license
1 Executive Summary
Mobility data is typically available in the form of sequences of location points with time stamps, that are generated by location tracking devices. The use of mobility data has traditionally been linked to transportation industry. Nowadays, with the availability of GPS-equipped mobile devices and other inexpensive location tracking technologies, mobility data is collected and published ubiquitously, leading to large data sets of volunteered geographic information (VGI).
In general, mobility data science is the science of transforming mobility data into (actionable) knowledge. This knowledge is critical towards solutions for traffic management, disease pandemic mitigation, micro-mobility (e.g., shared bikes and scooters), health monitoring, logistics (e.g., delivery services), to mention a few.
Despite the common goal of acquiring, managing, and generating insights from mobility data, the mobility data science community is largely fragmented, developing solutions in silos. It stems from a range of disciplines with expertise in moving object data storage and management, geographic information science, spatiotemporal data mining, ubiquitous computing, computational geometry and more. Furthermore, there is a disconnect in both industry and science between mobility data scientists and domain scientists or end users for which solutions are designed. Therefore, the goal of this Dagstuhl Seminar was to bring together and recognize the mobility data science community as an interdisciplinary research field, strengthen the definition of mobility data science, and together explore challenges and opportunities in the field. The seminar had two objectives: (1) to build a new research community of mobility data science as amalgamation of the several communities who have been looking at mobility data, and (2) to draft a research agenda for mobility data science. This dagstuhl seminar was the first towards these objectives. The consensus of the participants is that more events will be needed in the future to continue the community building effort.
Seminar Program
The seminar was held in the week of January 9 – 14 , 2022. It had 47 participants specialized in different topics: data management, mobility analysis, geography, privacy, urban computing, systems, simulation, indoors, visualization, information integration, and theory. Due to COVID-19, the seminar took place in hybrid mode, with 8 onsite, and 39 remote participants. Despite the challenge of different time zones of the participants, all sessions were attended by at least 37 participants.
The seminar program is given in Figure 1. In the first day, every participant gave a five-minutes self introduction, research interests, and position statement on mobility data science. The rest of the program consisted of panels, and open discussions. To work around the time zone challenge, the seminar activities were centered in the afternoon of Dagstuhl, which was still possible for the Eastern and CHN time zones. The open discussions slots were planned ad-hoc during the seminar. In particular, the slot on Tuesday was used to define what is mobility data science, or more precisely what is the scope of work of this community.
All working group and panel discussions were moderated to converge towards the seminar goals of defining a research agenda and building a community. The results are summarized in this report.
Organization and Panels
To accommodate for the hybrid mode and the time zone differences, we opted to let the participants choose to participate in one of the following three thematic working groups, each having 14-17 members and led by one of the seminar co-organizers:
-
Seminar co-organizers: Mohamed Mokbel, Mahmoud Sakr, Li Xiong, Andreas Züfle
-
Working Group 1: Mobility Data Acquisition and Privacy
The scope includes the full cycle of obtaining and preparing mobility data for further processing. Examples include innovative ways of data collection, crowdsourcing, simulation, data uncertainty, data cleaning, and data visualization. It also includes innovative ways of ensuring mobile users privacy as a means of encouraging users to share their data. Results of Working Group 1 are found in Section 4 -
Working Group 2: Mobility Data Management and Analysis
This includes the full data pipeline from modelling, indexing, query processing/optimization, and data analysis. Existing solutions for mobility data management were discussed and a way forward for a next generation system for mobility data management was conceived. Results of Working Group 2 are found in Section 5. -
Working Group 3 Mobility Data Science Applications
This working group discussed the broader impacts of mobility data science to improve understanding of human behavior, urban sustainability, improving traffic conditions, health, and situational awareness. Specific applications towards these broader impacts including map making, contact tracing, pandemic preparedness, indoor navigation, and marine transportation were discussed. Results of Working Group 3 are found in Section 6.
For each working group a dedicated panel session was organized which was attended by all seminar participants. In addition, two parallel working group sessions were held for discussions and for planning the writing of this report. The working groups presented and further discussed their results with all participants on Wednesday. Four cross-cutting panels discussed the topics of systems, funding opportunities, industry involvement, and curriculum development. All panels started with presentations of panelists as listed below, seven minutes each, where they expressed their positions concerning questions given by the panel moderator. The rest of the panel time opened the discussion to all participants.
-
Mobility Data Acquisition and Privacy Panel. Moderator: Li Xiong
Panelists: Gennady (& Natalia) Andrienko, Kyoung-Sook Kim, John Krumm, Cyrus Shahabi -
Mobility Data Management and Analysis Panel. Moderator: Mahmoud Sakr
Panelists: Walid Aref, Panos Chrysanthis, Christian Jensen, Yannis Theodoridis -
Mobility Data Science Applications Panel. Moderator: Andreas Züfle
Panelists: Sanjay Chawla, Flora Salim, Moustafa Youssef, Demetris Zeinalipour -
Systems Panel. Moderator: Mohamed Mokbel
Panelists: Walid Aref, Dimitrios Gunopulos, Cyrus Shahabi, Esteban Zimányi -
Funding Opportunities Panel. Moderator: Andreas Züfle
Panelists: Johannes Lauer, Mario Nascimento, Matthias Renz, Carola Wenk -
Industry Panel. Moderator: Mohamed Mokbel
Panelists: John Krumm, Johannes Lauer, Siva Ravada, Mohamed Sarwat -
Curriculum Development Panel. Moderator: Mahmoud Sakr
Panelists: Anita Graser, Marc van Kreveld, Martin Werner, Esteban Zimányi
2 Table of Contents
3 What is Mobility Data Science?
During initial seminar discussions, a controversial statement was made that many problems that the spatiotemporal data community is working on do not have any real-world applications. An example was the problem of location prediction, where the number of visitors for point of interests are predicted over time. This controversial statement led to a vivid discussion. While there was disagreement about the broader impacts of the problem of location prediction and other spatiotemporal data science problems, it was widely agreed that a useful and open research challenge is to understanding the underlying behavior: Why does the number of visitor changes? How can explain the underlying human behavior? And how can we leverage this understanding to predict what-if scenarios to maximize future visitor numbers at a point of interest.
Thus, highlighting need to go beyond the question of where will users be, but also why they will be there. Understanding the underlying behavior of users would allow us to explain trends. For example, reduced popularity of a coffee shop could be explained by a nearby competitor attracting customers with a special offer. These explanation of trends can then be used to take actions (such as offering a similar or better offer) to not only predict future trends, but to change them.
But to answer “why” users visit places, we have to think beyond spatial and spatiotemporal data science to understanding the underlying human behavior. Adding a component (human) behavior allows us to transition from traditional spatiotemporal data to mobility data science.
Therefore, we formalize Mobility Data Science as follows.
Definition 1 (Mobility Data).
Spatiotemporal data capturing behavior of moving entities.
Definition 2 (Mobility Data Science).
The science of mobility data.
The additional consideration of (human) behavior in spatiotemporal data is challenging. As Physics nobel laureate Murray Gell-Mann once famously said: “Think how hard physics would be if particles could think”. By adding a dimension of behavior, we’re allowing the entities in our universe of discourse to think. The seminar agreed that experts in social sciences will be paramount to explain and model human behavior, to mine knowledge from mobility data, and to create a mobility data science community. Cross-disciplinary research is challenging because it requires collaboration between domain experts that may address research in very different manners. However, cross-disciplinary research ensures that the solutions provided by the mobility data science community are relevant for society. Another clear benefit from working with experts from other domains is that this creates new research ideas. The mobility data science community should encourage cross-disciplinary research by ensuring prestigious outlets publish industry papers and best-practice papers.
4 Future Research Agenda: Mobility Data Acquisition and Privacy
Results of the first working group on mobility data acquisition and privacy are presented in this section. Specifically, Section 4.1 discusses challenges related to data acquisition, Section 4.2 describes issues on mobility data quality, Section 4.3 discussed bias in mobility data, and Section 4.4 describes privacy threats for mobility data.
4.1 Data Acquisition
Acquisition in the context of this report refers to acquiring mobility data. This is often necessary for the research we want to do – as a way to train models, assess the quality of our algorithms, and analyze the data for patterns and relationships with other data.
Mobility data can take different forms. We normally derive mobility data from humans, but it can also come from animals. Inanimate objects can move as well (e.g., planets, soccer balls, and leaves), but we tend to think of mobility data as coming from something whose motion is intentional or at least guided with intention, such as someone in a bus or autonomous vehicle. The exact data included in mobility data can vary. Perhaps the most common example is timestamped coordinates, such as latitude/longitude. If the timestamps are missing, we would likely call it population data or occupancy data rather than mobility data. The coordinates could instead be replaced by higher level abstractions like points of interest (POI), activities, or other location-specific properties.
The main issue with acquisition of mobility data is how we can get mobility data for our research. Getting the data takes time and effort, especially if it is annotated with human-generated abstractions like activity. There have been efforts to gather and share mobility data, such as GeoLife from Microsoft Research Beijing which covers 182 different users. But there is not yet a massive, shared mobility dataset for human motion. One trend among general research papers over the past several years is to encourage or require authors to make their data publicly available. As an example, there is a repository of animal mobility data at https://www.movebank.org/cms/movebank-main. Besides encouraging sharing in individual papers, we should consider starting a publication venue for mobility datasets (or more generally spatial datasets), similar to the journal “Nature Scientific Data”, which is a “journal for descriptions of scientifically valuable datasets.”
Human mobility data is sensitive (considered “personally identifiable information” (PII) by some companies), so we cannot necessarily share all human mobility data. We note that part of this Dagstuhl Seminar also concentrated on privacy, which is at odds with data sharing. One approach to the privacy problem is to create a community-based open source project where we enroll people who are willing to log and share their location data, possibly with privacy guarantees for the contributors. However, such data would be biased toward people who are willing to share their location data. One solution for the privacy problem is for the data owner to accept code from outside, run it on their proprietary data, and then return the results.
Another way to get mobility data is to generate it synthetically. While numerous synthetic trajectory and movement data generators have been proposed in the past, there is not a generally accepted synthetic generator for mobility data, and no consensus on whether or not such data would be acceptable as the sole test set for a research project. Some have used a synthetic dataset as one of their test datasets for a publication. And sometimes a specialized simulation is used for testing an algorithm, e.g., flocking behavior or location-based social networks.
Our community could take a lesson from generative adversarial networks (GANs) in the deep learning community where the network inspects its artificially generated results for realism. However, we do not yet know how to measure the realism of mobility data. If synthetic mobility data is too realistic, it may invade someone’s privacy if it, for instance, shows where members of a given household actually visit.
In the end, the research community will have to agree on the suitability of synthetic mobility data for research. This agreement could be an explicit statement or could grow naturally from the pool of papers that are successfully published.
4.2 Data Quality
There exists different procedures for collecting mobility data:
-
Time-based: positions of movers are recorded at regularly spaced time moments.
-
Change-based: a record is made when a mover’s position, speed, or movement direction differs from the previous one.
-
Location-based: a record is made when a mover enters or comes close to a specific place, e.g., where a sensor is installed.
-
Event-based: positions and times are recorded when certain events occur, in particular, when movers perform certain activities such as cellphone calls or taking photos.
-
Various combinations of these basic approaches. In particular, GPS tracking devices may combine time-based and change-based re-cording: the positions are measured at regular time intervals but recorded only when a significant change of position, speed, or direction occurs.
To identify data errors, it is necessary to consider systematically the relevant properties of mobility data, including:
-
Mover set properties:
-
–
number of movers: a single mover, a small number of movers, a large number of movers;
-
–
population coverage: whether there are data about all movers of interest for a given territory and time period or only for a sample of the movers;
-
–
representativeness: whether the sample of movers is representative, i.e., has the same distribution of properties as in the whole population, or biased towards individuals with particular properties.
-
–
-
Temporal properties:
-
–
temporal resolution: the lengths of the time intervals between the position measurements;
-
–
temporal regularity: whether the length of time intervals between measurements is constant or variable;
-
–
temporal coverage: whether the measurements were made during the whole time span of the data or in a sample of time units, or there were intentional or unintentional breaks in the measurements;
-
–
time cycles coverage: whether all positions of relevant time cycles (daily, weekly, seasonal, etc.) are sufficiently represented in the data, or the data refer only to subsets of positions (e.g., only work days or only daytime), or there is a bias towards some positions.
-
–
-
Spatial properties:
-
–
spatial resolution: the minimal change of position of an object that can be reflected in the data;
-
–
spatial precision: whether the positions are defined as points (by exact coordinates) or as locations having spatial extents (e.g., areas). For example, the position of a mobile phone call is typically a cell in a mobile phone network;
-
–
spatial coverage: are positions recorded everywhere or, if not, how are the locations where positions are recorded distributed over the studied territory (in terms of the spatial extent, uniformity, and density)?
-
–
Further sources of data errors and uncertainty relate to
-
data collection procedure:
-
–
position exactness: How exactly could the positions be determined? Thus, a movement sensor may detect an object within its range but may not be able to determine the exact coordinates of the object within its detection area. In this case, the position of the sensor stands in for the object’s true the position;
-
–
positioning accuracy, or how much error may be in the measurements;
-
–
missing positions: in some circumstances, object positions cannot be determined, leading to gaps in the data;
-
–
meanings of the position absence: whether absence of positions corresponds to stops, or to conditions when measurements were impossible, or to device failure, or to private information that has been removed.
-
–
Irrespective of the collection method and device settings, there is also indispensable uncertainty in movement data (and, more generally, any time-related data) caused by their discreteness. Since time is continuous, the data cannot refer to every possible instant. For any two successive instants t1 and t2 referred to in the data there are moments in between for which there are no data. Therefore, one cannot know definitely what happened between t1 and t2. Movement data with fine temporal and spatial resolution give a possibility of interpolation, i.e., estimation of object positions between the measured positions. In this way, the continuous path of the mover can be approximately reconstructed by interpolation.
Movement data that do not allow valid interpolation may be called episodic. Episodic data are usually produced by location-based and event-based collection methods but may also be produced by time-based methods when the position measurements cannot be done sufficiently frequently, for example, due to the limited battery lives of the devices. Thus, when tracking movements of wild animals, ecologists have to reduce the frequency of measurements to be able to track the animals over longer time periods.
According to the structure and properties of mobility data, we can identify the following classes of errors in movement data:
-
temporal properties, e.g., missing data during some time intervals;
-
spatial properties, e.g., errors in positions, absence of data in some parts of territory;
-
mover identity properties, e.g., misspelled or duplicate identifiers; or no identifiers at all;
-
data collection properties, e.g., results of restricting positions to a given bounding rectangle.
For identifying data quality issues, it is necessary to consider all major components of the data structure, namely identities, spatial locations, times, and thematic attributes, and their combinations. Any unexpected regularity or irregularity of distributions requires attention and explanation, as such patterns may indicate sampling bias or other kinds of errors. Calculation of derived attributes (e.g., speed, direction) and aggregates over space, time, and categories of objects provides further distributions to be assessed.
4.3 Bias in Data
All datasets are biased, examples include:
-
App data and mobile phone network data are biased against people who don’t use smart phones or use prepaid plans
-
Most traffic counting sensors are installed to count cars but do not count pedestrians, cyclists, wheelchairs, (e-)scooters, and similar
-
Object-detection in video-based systems depends on labels in training data, which often don’t include new mobility options such as (e-)scooters
-
Surveys are biased towards people who are willing and able to fill surveys, i.e., interested, literate, sufficient free time, reachable (e.g., for phone surveying)
-
Cells in mobile phone networks vary widely in size. Trips that stay within a single cell cannot be detected. This affects rural areas with larger cells more than urban areas.
-
Volunteered tracking data is biased towards technically savvy people
-
Sports tracking data is biased towards health conscious middle and upper class
It is important to acknowledge and quantify the bias in mobility data sets to ensure that actions and policies that are based on mobility data science results are equitable and fair and include vulnerable populations.
4.4 Privacy
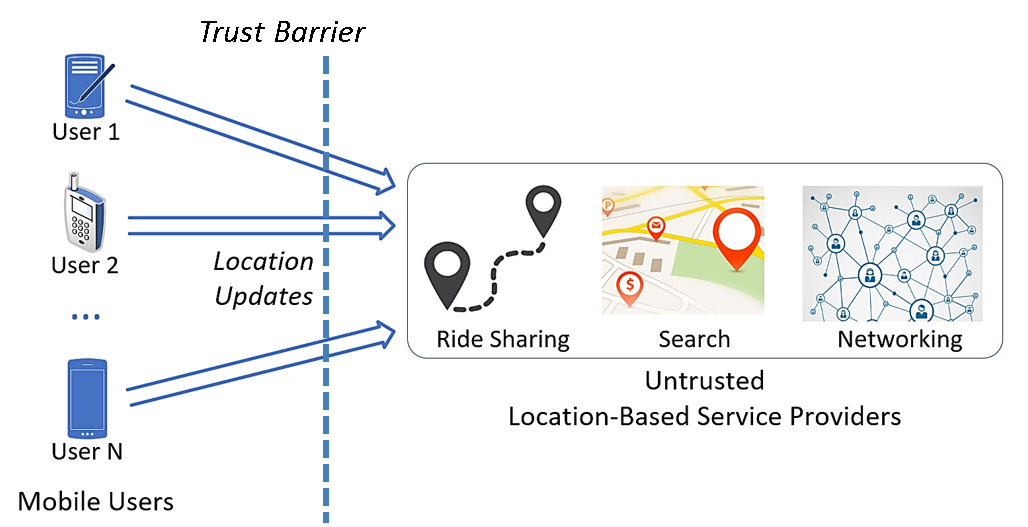
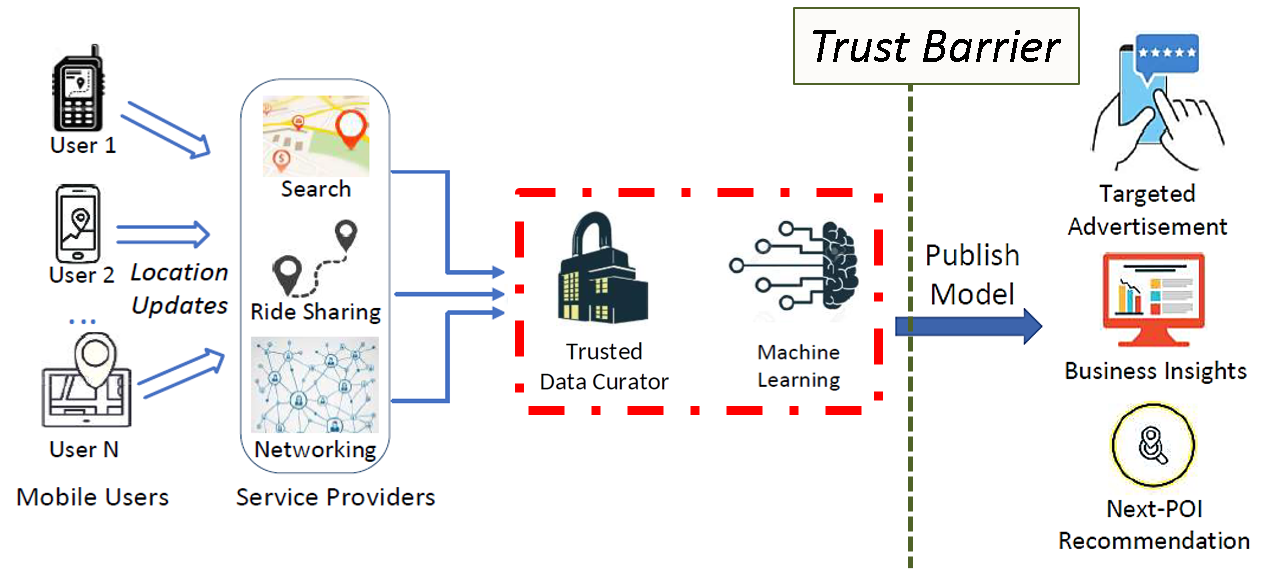
We divide our discussion on privacy into two settings: local settings and central settings. In the local setting (as shown in Figure 2), the mobile service provider is not trusted. Hence, mobile users need to protect their location information (e.g., via perturbation) before uploading them to the service provider in exchange for location based services (LBS). The services include ride sharing, spatial crowdsourcing, and POI search. The aggregate locations from all users can be also used to support location based analytics. In the central setting (as shown in Figure 3), the mobile service provider is trusted and has access to users’ mobility data. It acts as a trusted data curator and shares some form of the mobility data with a third party or the public which are untrusted. The shared data can be aggregate statistics, sanitized or anonymized version of the data, machine learning models trained from the data, or synthetic data generated based on the original data which can support a variety of applications using mobility data (as we discussed in the application section). The privacy goal is to protect against inference risks to the original data from the shared data.
4.4.1 Threat Models and Privacy Definitions
The first challenge for mobility data privacy protection is the need to understand the threat models and adopt or define proper criteria by which to enforce privacy. We need to define first what needs to be protected (i.e., the sensitive information). This may vary for different mobile users and applications. It may be the exact location coordinates, association of coordinate with a sensitive place, co-location of two users, or spatiotemporal activities of a user (e.g., stay at a place, or a trajectory). When defining privacy models and designing subsequent privacy mechanisms, there will (almost always) be an attack to a privacy model which is based on side channel information exploitation. A clear threat model needs to be defined. Relation to cybersecurity and cyber-defense could be interesting and provides a research direction.
Syntactic Privacy Approaches. Early work on privacy for location data focused on location-based services (LBS). Typical use-case scenarios are those where a user wants to retrieve points of interest in her proximity, e.g., nearest gas station. Query types are limited to range or nearest-neighbor queries. In this setting, the protection model considered was one where a user’s whereabouts are hidden, or cloaked, among a set of other individuals, according to the concept of spatial -anonymity. This is a syntactic model, which works well if the adversary does not have access to background knowledge, but fails to provide the required amount of protection when the adversary can use auxiliary information to eliminate some of the locations in a cloaking set. Cryptographic Approaches. Later on, formal protection guarantees in the LBS setting were achieved with the help of encryption approaches. Specifically, existing work encrypts the data and query domain, and answers queries such as nearest neighbors in the transformed space. Other work that provides encryption-strength protection employs Private Information Retrieval (PIR) in conjunction with Voronoi diagrams to answer privately nearest-neighbor queries. Differential Privacy (DP). The introduction of DP and its Geo-Indistinguishability (GeoInd) counterpart specifically designed for location data have opened the field for new approaches that provide formal protection with statistical guarantees. In the case of GeoInd which is designed for the local setting (as shown in Figure 1), one protects against pinpointing the exact location of a targeted user from the reported (perturbed) location. The level of protection is controlled with the help of a privacy parameter. Each user can perturb their own location before reporting it according to well-defined protection mechanisms that provide GeoInd. Later works extended geoInd to account for temporal correlations between consecutive locations of mobile users, protection of customizable spatiotemporal activities instead of raw locations or trajectories. Challenges remain in providing customizable and rigorous privacy notions and mechanisms that provide high utility for a variety of applications.
For the global setting, several types of aggregate computation can be performed privately using DP-compliant mechanisms. One can even train a machine learning model in a private way. Mobility data introduces unique challenges to applying standard DP techniques due to its spatiotemporal correlations which often results in increased privacy cost due to privacy composition and the difficulties in modeling the correlations.
4.4.2 Privacy-Utility Tradeoff and Emerging Applications
When designing privacy mechanisms, it is important to consider the utility of the intended applications. For LBS (as typical in the local setting), the utility needs to be measured by the precision or accuracy of the LBS queries such as range queries for POI search. For aggregate data analytics and machine learning applications using mobility data (in both local setting and central setting), the utility need to be measured by the accuracy of the statistics (e.g., frequency or density estimation), the trained model, or the fidelity of the synthetic data.
The emergence of novel computing paradigms like spatial crowdsourcing led to interesting technical approaches and challenges to achieving privacy. For instance, existing work investigates how one can perform assignment between spatial tasks and workers in crowdsourced systems, without compromising the location privacy of the participants involved. Specifically, the matching is performed based on a DP-compliant algorithm that ensures that an adversary cannot determine with significant probability if a particular individual took part in the crowdsourced system or not.
Another important paradigm shift in terms of type of supported queries occurred with the emergence of techniques for digital contact tracing, which are important in controlling the spread of pandemics, such as COVID-19. In this context, it is less important to capture exact user locations, and what is required is to establish co-location relationships. Determining whether two individuals have been in close proximity or not in a privacy preserving way is a challenging and important problem. For example, while geoInd may be used, the perturbation may introduce false positives and false negatives, a careful balance is needed if the result will be used to notify potential users at risk. In addition, privacy compositions may further increase privacy cost or degrade the utility when considering trajectories of users.
4.4.3 Societal Education
An important challenge of mobility data privacy is to improve explainability of privacy definitions and mechanisms. DP-compliant algorithms and DP-fashioned location privacy models (such as Geo-Ind) as described earlier use privacy parameters to control the trade-off between privacy guarantee and the utility of the private outputs. However, there is a significant gap between the theory and practice of DP: we lack principles and guidelines for choosing privacy parameters when collecting or processing mobility data using DP techniques in the real world.
The parameter of DP is mathematically defined but not well-aligned with the stakeholders’ beneficial interests. Theoretically, of DP represents the bound of marginal adversarial beliefs conditioned on the private output. It is known that the privacy parameters of DP are not absolute but rather relative measures of privacy. That is to say, even for the same , the privacy guarantees enforced by DP could be different based on the datasets and algorithms at hand. In addition, the is not always linked to a specific privacy risk for the users (such as “the probability that an attacker can correctly infer my data”) or a precise utility level for data analyzers (such as “the accuracy of the DP-ML model”). It may arouse distrust towards DP technology without explaining why the specific privacy parameters are chosen and what the potential privacy risk is for the users.
To promote the acceptance of DP technology in practice, we should establish principles, design guidelines, and provide tools for explaining DP’s protection and limitation from stakeholders’ practical interests. For example, we can help data contributors understand the privacy risk (such as membership inference attacks or reconstruction attacks) under different privacy parameters given a concrete DP algorithm; we can also design efficient methods to visualize how data analyzers’ utility metrics (such as MSE or model accuracy) may change along with different privacy parameters.
Towards a privacy and ethics review board, it was discussed that every research project needs to be evaluated in privacy/quality management. This may create a need for an ethics commissions in mobility data science.
5 Future Research Agenda: Mobility Data Management and Analysis
This section discusses the priority topic of research related to the full mobility data pipeline from modelling, indexing, query processing/optimization, and data analysis. It summarizes the discussions that took place within the Working Group of data management and analysis, and were then elaborated in a general discussion between all seminar participants.
5.1 The Architectural Challenges of Mobility Data Management
5.1.1 Hybrid Batch Real-time Data Management and Analytics
Today’s requirements for mobility data management and analytics must combine both batch and real-time data. For example, a common requirement is to visualize the position of a fleet of vehicles in real time (which only requires to access the most recent positions of the vehicles), but at the same time to perform batch analytics on the full trajectory of these vehicles (for example to assess whether the trajectories exhibit ssome unexpected behavior).
Since the 1990s, the need to have both real-time and historical data has led to the development of the data warehouse domain, where operational databases cover the real-time Online Transaction processing (OLTP) while data warehouses cover the historical Online Analytical Processing (OLAP). However, having two different systems for the two kinds of workloads is very costly, and for this reason a new approach referred to as Hybrid Transactional and Analytical Processing (HTAP) has been recently proposed. This approach aims at removing the need for Extraction Transformation and Loading (ETL) process and enables real-time analytical queries on current data. The new generation of NewSQL database management systems aims at achieving this approach. However, research work is currently being done in order to solve all the challenges posed by the HTAP approach, especially in the context of big data.
The situation is similar for mobility data since the training part of ML requires offline processing of large training datasets, while we also need to do real-time prediction for numerous simultaneous moving objects (e.g., air traffic control). It is still an open question whether the recent developments in HTAP and in NewSQL can be extended for manipulating real-time stream and historical mobility data. Another line of research is how edge computing could be integrated into this context, since it may enable a continuum between these two extremes of historical and real-time data analytics.
5.1.2 Distributed Data Management and Processing for Mobility Data
The paradigms of distributed data management for mobility data include distributed RDBs, NoSQL systems, and data flow processing systems based on e.g., the Spark architecture. It has turned out that these architectures have their pros and cons. For instance,
-
while distributed RDBs provide a rich repertoire of features and algorithms, scaling out is hard;
-
NoSQL systems are really scalable but they are still immature for handling mobility data (limited queries, basic partitioning / indexing);
-
systems following the Spark architecture, though scalable and with a rich repertoire of queries, they provide ad-hoc solutions for indexing and querying.
In the near future, the goal for the mobility data management community obviously includes technologies that will combine the best features of each, in fact, scalability together with rich (though not ad-hoc) indexing support and querying functionality. How can it be reached? Among the three above baselines and since high scalability of RDBs seems questionable, the most promising roadmaps are expected to be those exploiting on NoSQL and/or Spark-based systems. Towards this goal, a number of challenges arise. To name but a few:
-
Regarding indexing, (a) how does modern architecture (e.g., SIMD instructions and MSMC architectures) affect the in-memory vs. disk-based processing balance? (b) will the auto-generated index configurations paradigm be the future?
-
Regarding query processing and the convergence of DBMS and DSMS in a single architecture, which is the golden ratio between offline (archive) and online (stream) processing?
-
Regarding analytical processes (from aggregations to forecasting), to what degree they should be considered as duty of the DBMS?
-
Regarding the IoT environment, how smoothly can we deal with the edge/fog/cloud settings that appear there?
In either case, the target should be offering high scalability (not only with respect to volume but also to velocity of data) along with query processing methods – and indexing schemes as their background supporters – that will be based on strong foundations (could it e.g., be a multi-model, multi-granularity algebra?).
5.1.3 IoT Challenges as a Driver Use-case for Mobility Data Science
The Internet of Things (IoT) has recently received significant attention. An IoT device may possess an array of sensors that for example monitors the air temperature, carbon monoxide level, wifi signals, and sound intensity. IoT data is initially created on the device, then sent over to a central database system (e.g., the cloud) that organizes and prepares such data for the ongoing use by myriad applications, which include but are not limited to smart home, smart city, the industrial internet, connected cars, and connected health. Data generated by IoT devices is inherently mobile with spatial and temporal attributes. For instance, an audio signal represents the variation of the sound intensity (retrieved by a sound sensor) over the time dimension. Furthermore, IoT devices can be attached to moving objects such as a connected vehicle or a wearable device.
A promising research direction will incorporate IoT data awareness in state-of-the-art mobility data systems. That also requires that system developers design a middleware framework, which understands the IoT devices streaming data to the central data system on one side and the requirements of applications accessing such IoT data on the other side. The proposed middleware system will tune the mobility data system to adaptively decide whether or not to eagerly propagate data from the device, to the edge, or to the central system. Another important direction is to modify existing relational and spatial query processing algorithms to leverage the IoT device capabilities and handle the different rate and types of data generated by various IoT devices. To capture the interconnected nature of IoT data, a mobility data system must also provide a graph processing API in addition to the spatial / spatiotemporal API. Such a combination is already supported by existing graph data systems, however such systems treat the geospatial location attribute as a second class citizen, and hence cannot achieve real-time or near real-time performance. The community needs to craft efficient query operators that accelerate location-aware graph queries and also investigate new index structures that take into account network aspect of linked IoT data as well as the spatial and spatiotemporal aspects.
5.2 Next Generation Systems
5.2.1 Lessons Learned from Existing Systems
Existing systems are built for a variety of application purposes such as on-line updating and querying, and historical data querying and analytics. Next generation systems may be towards a general platform or cloud system into which individual systems can be integrated as modules. Developers who have already built ad-hoc systems could still further enhance their systems and then upload them into the platform.
Existing systems for mobility data have been already well equipped with a number of data models, structures, functions and operators. For example, there are historical data representation methods, different updating policies, a list of R-tree based index structures and grid index structures, and query algorithms. Those well-established techniques should be encapsulated into next generation systems. That is, one should not build the system from scratch.
One aspect receiving moderate attention in existing systems is to evaluate the data quality of raw mobility data and perform data cleaning. This is because application queries and analytics performed on low-quality data inhibit the system performance and even lead to incorrect results. A powerful, general and intelligent tool should be developed in the community to (i) effectively evaluate the quality of mobility data and (ii) efficiently perform the data cleaning task to provide as high-quality data as possible for the system. The tool should be open sourced and sustained and empowered by the community such that a wide range of researchers as well as those from other communities (e.g., GIS) can benefit from that. The system should be completely or almost completely open source rather than partially open source. In particular, the underlying implementation details should be visible to the community after paper publication such that the techniques can be utilized or even enhanced in a wide domain.
In relational database systems and data mining systems, a natural language interface has been provided such that users can express their queries in natural language. This benefits a wide range of users, especially, non-experts who cannot write structured query expressions. Mobility data systems should also provide a user-friendly interface for non-specialists from other domains. The task is to precisely transform queries in natural language into structure and executable languages in the system. An interactive interface is preferred as users may check the correctness and accuracy of transformed expressions.
Data visualization also plays a pivotal role for application users and developers as not only mobility data but also structures for storing and manipulating them should be displayed in a clear way. For application users, the system fluently displays the data in a clear and interactive way such that they understand the meaning and why such results appear. For developers, the system reports the structure statistics in an intuitive and customizable way such that they well understand the internal characteristics of underlying data structures, and then build the structures in an optimal way for application tasks.
5.2.2 Towards an Eco-system for Mobility Data Science
Location data has almost always been supported in data systems as an afterthought. Many systems, e.g., Postgres, Storm, Spark, and Hadoop, have not been originally designed with location data support in mind. What typically happens is that spatial data types get augmented into tuple-oriented systems to support the location data type. For example, a restaurant tuple that describes various attributes of a restaurant is augmented with the latitude and longitude of the location attribute of the restaurant to support location services. Spatial indexes are provided to speedup the access to these attributes, and some accompanying spatial operators are provided to operate on the location attributes to provide location services, e.g., range or k-nearest-neighbor searches. While this approach works, systems that result are not well-optimized for supporting location data. This is similar in analogy to trying to repurpose a car to be able to fly. While this is possible, it will not perform optimally and will never be the same as designing an airplane from scratch in contrast to starting from a car and modifying the car’s design. Thus, the quest is to realize a data system where location is treated as a first class citizen from the start, i.e., the system will be optimized firsthand for location data and its corresponding services.
It is important to note that over 80% of the data is associated with location data. Thus, it is important that when we design a system that supports location as a first class data type that this system also supports the other forms of data that are associated with the location. A vision, termed Location+X, calls for treating location data as a first-class citizen in a location data system that at the same time can be extended to support other data types (the “X” in Location+X). The data types “X” can be keywords (e.g., to support spatial-keywords and tweets), can be graphs (e.g., to support road-network data), can be relational data (e.g., to support descriptions of spatial data objects), can be click streams (e.g., to support check-in data), can be document data (e.g., to support points of interest and documents that describe them), can be annotated trajectories (e.g., location + time + textual annotations), etc. Notice that in many location services, more than one data type X may need to be supported at the same time, e.g., a graph data type combined with a document or keyword data types, etc., which calls for a multi-model-like data system.
Following the above vision, this gives rise to an eco-system where location is at the core with some form of an extensible multi-model data system that supports the multitude of data types “X”. However, current multi-model data system technology is lacking in several aspects. First, they do not support data streaming that is a cornerstone in location data systems due to the online streamed locations of moving objects. Second and as important, we do not want to fall into the trap of adopting existing multi-model technologies that may affect location being a first class citizen. However, the need for supporting multi-models in one seamlessly integrated location+X system remains a necessity.
In addition to supporting location data via a native location+X engine, an eco-system for mobility data would include many important utilities to facilitate a broad spectrum of location service applications. From the input data side, to help navigate the vast amounts of available location datasets, and discover the right data sets for a given task, a location dataset lake infrastructure and location dataset discovery, cleaning, and integration facilities are needed. From the presentation side, a comprehensive visualization suite is envisioned to support visualizations for combinations of spatial and temporal data analytics on top of location data.
5.2.3 Standards
It is important to have standard interfaces and data exchange formats for the development of an eco-system. The current landscape for mobility data standards has two main players: ISO and OGC (The Open Geospatial Consortium). ISO has one published standard ISO19141 which specifies an abstract data model of a moving geometry consisting of translation and/or rotation of a geographic feature. Based on it, OGC has published multiple standards, of a technical nature, defining data exchange formats and a data access API. Nevertheless the standardization work in mobility data is still in the infancy stage. Compared to spatial data, there already exist more than 80 published ISO standards as part of the ISO191xx suite. This is complemented by more than 160 OGC implementation standards, that are written for a more technical audience, and detail the interface structure between software components.
On the one hand, standards should address the needs of technology users and vendors. Therefore, standardization ideally should involve user communities and vendors. For example, this is important to ensuring that user and vendor needs are addressed; and it can provide assurances to vendors: if they invest in products that comply with standards, the investments are relatively safe. On the other hand, standards should be theoretically sound and should build on the most recent scientific advances. This will benefit all involved, and it calls for the involvement of scientists. To scientists, a key reward for involvement in standardizations is potential real-world impact.
Next, standardization faces a chicken-and-egg dilemma: The existence of high-quality standards can accelerate the exploitation of technology, which is an argument for developing standards early. However, developing standards early runs the risk of the standards being of low quality and hampering the development of compliant products, which in turn slows down exploitation. From this perspective, it may be best to not standardize technology until several products are available.
The “standardize late” route may lead to situations where vendors try to take over standardization with the objective of protecting their investments into their own products. Then standardization processes run the risk of becoming politicized, and scientific arguments (and user needs) are trumped by commercial interests, thus limiting the prospects for achieving science-based standards.
SQL standardization of temporal support provides some insights into potential difficulties. In 1994, a sizable committee of temporal database researchers released that TSQL2 language specification that they hoped could serve as a foundation for standardization. However, the subsequent standardization efforts ran into difficulties. First, it turned out to be very expensive to participate in ISO standardization, which involved meetings across the globe. Second, standardization was dominated by vendors with successful businesses built around SQL-based systems. Third, SQL was, and is, a dinosaur on clay feet: having evolved over many years, it is a complex language that is not the best example of clean language design. Extending such a language is challenging. It turned out that the TSQL2 design did not “scale,” and a redesigned version of TSQL2 based on so-called statement modifiers was eventually proposed for standardization. Although the proposal was good science, it did not make it. A key lesson is that standardization is far from an academic exercise where the best proposal wins. Rather, standardization can involve strong political and commercial special interests. Scientists who pursue standardization need to be prepared for such aspects. They should try to understand the costs and reward structure clearly before they embark on standardization. They may consider forming alliances with vendors or user communities, or with other scientists.
Mobility data science, and data science general, has two main setbacks: (1) GDPR and relevant privacy regulations, and (2) data preprocessing is suspected to generate bias in the analysis results. Standards (and community best practices) could help overcome these two setbacks. Data scientists can then base their work on them, and be able to defend it. This creates requirements for developing standards and community best practices for GDPR compliant data management, and for mobility data science pipelines.
5.3 Learning and Analysis
5.3.1 ML over Mobility Data
The rise of machine learning (ML) has impacted plenty of applications in different domains. Mobility data is no exception, as researchers have explored using ML in boosting various related applications and solving systems issues. For example, improving the accuracy of map building is a recurring application that is being explored through ML models. A major hurdle, and a research opportunity as well, is that existing ML and analytics tools, e.g., tensor flow, do not support location and mobility as base data types to reason about. So, even the basic analysis, such as clustering, classification, similarity, etc, need to be explored when mobility data is involved. These tasks, as well as higher-level analysis, can not be totally independent. Instead, common basic building blocks could have an impact on all or some of them. For example, exploring the effectiveness of feature vector components for mobility data analysis is a basic block that could impact different ML-based analysis tasks. This raises a fundamental and big question on what are the analysis primitives and common building blocks for applications that could shape a framework of ML-based mobility data analysis?
With all those open research questions and challenges, there are still more directions that are hardly touched, although being promising and open for ample exploration. One of these promising directions is exploring the ability of ML technology to help improve mobility data preparation and cleaning. This is an increasingly important task with increasing noisy signals in human-generated mobile data and the availability of a wide variety of heterogeneous data sources. It also includes the fact that mobility data is often very sparse.
Another major direction that currently hinders ML models on spatial and mobility data is scalability on big data. Although it is usually assumed that scalability is a step after supporting primitive blocks and supporting data preparation, practically, this assumption causes a significant lag in using newly developed mobility data techniques in real environments for several reasons. First, it leaves making use of non-spatial technologies, such as general-purpose ML models, as an always-future step, which lags the advancements in mobility data behind the non-mobile environments. Second, the lack of scalability makes the developed techniques practically not very useful for evolving applications that operate on big data. This makes the mobility data community lose its audience early in the ever-running game. Thus, thinking of scalability on big data and solving system-level issues for end-user friendliness and usability should be hand-in-hand with exploring all the new techniques, applications, and directions that have been highlighted above.
5.3.2 In-database Analytics – Analytics Algebra
The wide adoption of a tool or system depends to a large extent on the ease of use. One question therefore is where the functionality of mobility data analysis should reside. One option is to make it a stand-alone application with dedicated data types and methods. Another option is to see it as an extension, or rather a specialization, of a more general purpose system, which would logically be a spatial database or GIS. Since several data types and methods needed for mobility data analysis are already present in GIS, the latter option appears natural.
The most important data types to be supported are movement data in all of its forms: trajectory data, video data, check-in data with ids (like cell towers) or without ids (like induction loops), and more. Other relevant data are contextual, which help to understand or explain mobility or the behavior that underlies it. These data can be (topographic) map data, weather data, elevation data, and data on events in the real world, like a big sports match taking place at a certain location at a certain time.
Since data integration is key to nearly all mobility data analysis tasks, a well-designed system must include this functionality for heterogeneous data. One option is to provide an algebra that can combine different data types, but this is convenient mostly for field data in raster form, and less so for object data in vector form. Since GPS tracks (trajectories) are typically in vector form, further research is needed to see in what ways algebras can be utilized to deal with heterogeneous mobility data.
Another big issue in data management and analysis is the level of detail that must be maintained to support the analysis. Here the situation is the same as for any spatiotemporal research domain: a high level of detail in space and time leads to huge data sets and slow analysis, but a low level of detail may not suffice to answer the research questions. The presence of heterogeneous data implies that a system needs to deal with data with very different spatial and/or temporal resolutions.
5.3.3 Visual Analytics
Visualization and exploratory analysis of mobility data has long been a hot topic in visual analytics. More recently, the trend turned to combining visualization with modeling and simulation to support decision making. This kind of research is by necessity application-oriented, while much less is done on developing more general ideas and approaches.
One general research problem that has only been slightly touched in VA but not systematically addressed is human involvement in real-time analysis of big mobility data. Is it possible to define realistic scenarios for involving human intelligence in big data analytics taking into account the cognitive limitations of human analysts with regard to the amount of information that can be perceived, speed of processing, and time required for analytical reasoning and contributing to the analysis process? It appears possible, in principle, that human experts work at their own pace on gradual improvement of a computational model operating automatically in real-time, provided that the context and the properties of the incoming data do not change too rapidly.
There is even a more general problem of finding effective approaches to combining computational methods of analysis, such as ML, with human expert knowledge and reasoning. While it is usual in VA to involve algorithmic methods in analytical workflows, it is mostly limited to two scenarios. One is the use of algorithmic methods to support human reasoning and generation of new knowledge in the mind of an analyst. The other is human-controlled development of ML models according to the standard data science pipeline. The involvement of human intelligence is limited to thoughtful data preparation, feature selection, parameter setting, and so on. It would be great to find ways to make more direct and effective use of human-possessed concepts and, particularly, knowledge of causal relationships. Possibilities for that could be explored in two directions: (1) transforming purely data-driven ML methods into hybrid approaches that can use human expert knowledge in the learning process and (2) enriching ML outcomes with expert knowledge, so that data-level features are lifted to domain concepts and statistical associations transformed to causal links.
While these research problems and directions sound quite general, there is a specific topic for research on mobility data analysis: from low-level movement data, such as trajectories of moving entities, derive understanding and models of mobility behaviors. This is where the human capability of abstracting, forming general concepts, and reasoning with the use of these concepts are especially valuable, as current algorithmic methods are limited to operating on the data level.
Hence, a grand research challenge for visual mobility analytics is to develop approaches to understanding and modeling mobility behaviors, i.e., how purpose-oriented movements and actions are being adapted to the contexts in which they take place.
The research should include development of a conceptual framework for describing individual and collective behaviors of moving entities. It should encompass various kinds of collective behaviors, from individuals pursuing their own goals while adapting to behaviors of others to groups of cooperating entities having a common goal and, possibly, competing with other groups. The framework should define the set of potentially relevant aspects of a mobility behavior, such as visited places and characteristics of the visits (frequency, duration, regularity, typical times), dynamic properties of movements (speed, direction, mode), as well as affecting factors, including characteristics of the moving entities themselves and the context of their movement.
The next sub-problem to be solved is to find ways of transforming low level mobility data, i.e., trajectories of moving entities, into representations of mobility behaviors. It is the process requiring involvement of human abstractive perception and interpretation of the data in terms of high-level concepts. The human needs to understand how to transform the data and to tell this to the computer. Interactive visual interfaces should support the human both in gaining the understanding and in communicating necessary knowledge and instructions to the computer. In parallel, it is necessary to develop computer algorithms capable of incorporating human knowledge and adhering to the instructions.
The following research problem is how to analyze behaviors after they have been extracted from elementary movement data and represented by appropriate data structures. The conceptual framework should enable defining the types of conceivable patterns of movement behavior. This will provide orientation for developing visualization techniques facilitating visual discovery of behavioral patterns, as well as algorithmic methods for detection of specified types of patterns. These techniques and methods should be incorporated in systems and workflows for analyzing the contexts in which various patterns take place and developing models for describing and predicting mobility behaviors depending on the context.
6 Applications of Mobility Data Science
This section describes the broad impacts of mobility data science as well as specific applications that were identified by participants. Figure 4 provides an overview of this section. We first give an overview of broader impacts of mobility data science in Section 6.1 followed by specific applications described in Section 6.2. In addition, the working group also discussed algorithmic paradigm that may be applied to Mobility Data Science as described in Section 6.3.
6.1 Broader Impacts
This section describes broad areas that may benefit from a mobility data science research agenda. Specific applications which may fall under one or multiple of these areas are described in Section 6.2
6.1.1 Understanding Human Behavior
During the seminar, one participant made a controversial statement claiming that “many researchers focus on the problem of location prediction, yet no useful application for this problem exists”. Indeed, it seems difficult to leverage knowledge such as “User X will visit Coffee Shop A next” or “32 users will visit Coffee Shop A today” for marketing or other applications. However, if we can begin to understand the underlying behavior, at the individual-, group-, or population-scale, that leads to such predictions, we could begin to understand why one coffee shop chain is increasing visitor rates (for example due to a movement towards organic coffee sold by the former coffee shop). Through inferring from the data about such behaviours, only then we can take corresponding actions not only to predict locations, but also to prescribe actions (such as offering more organic coffee) to improve visitor rates. Such understanding of (human) behavior will broadly affect applications using mobility data: While traditional spatiotemporal data science allows predictive analytics to predict the future, mobility data science enables prescriptive analytics by understanding the underlying human behavior to devise actions and policies that change the future in a desirable way.
6.1.2 Urban Sustainability
Rising temperatures on Earth, have led to the exploration of new technologies to help curb the severe effects of Climate Change. Highly urbanized environments are a focal point for the application of these new technologies as they introduce a variety of mobility modalities (e.g., EVs, bicycle, scooters with respective sharing programs) and smart spaces (e.g., smart IoT living spaces with renewable energy), where human spend 90% of their time. According to the European Environmental Agency, urban environmental sustainability encourages revitalization and transition of urban areas and cities to improve livability, promote innovation and reduce environmental impacts while maximizing economic and social co-benefits. In the epicenter of these challenges lay challenging spatiotemporal data-driven problems that require new operators, algorithms and infrastructures to schedule energy prosumer’s (consumers-producers) activity to minimize the CO2 footprint while improving livability. Given that the computing field is anticipated to increase its CO2 footprint from 4% to 8% until 2025, compared to only 2% of the whole aviation industry, clearly demonstrate that not only computing requires to become more energy efficient, but also that the computing field has to compensate for this increase by reducing CO2 in a variety of other domains (i.e., smart-everything: transport, heating, industry, agriculture/land.)
By understanding how people move in cities, outer suburban, and regional areas, the demand for infrastructure and energy can be better understood. This, will not only help to ensure sustainable production and consumption, but also to reduce urban inequalities in cities. In addition, tools that use accurate models of people mobility to predict future transportation demands would be very useful to stakeholders to plan future developments, formulate evaluate alternative policies for improving city infrastructures, end evaluate the impact of various decisions.
6.1.3 Improving Traffic Conditions
Traffic is a problem of global scale, as recognized by transportation science over a decade ago. Drivers in the United States spend 6.9 billion of man-hours stuck in traffic and waste more than 11 billion liters of fuel per year according to INRIX. Measured per-capita, people in Russia and Thailand spend even more time in traffic, while Brazil, South Africa, the UK, and Germany are only slightly behind the United States. The SIGSPATIAL community had great success in exploiting mobility data for predicting traffic and using these predictions for traffic-aware routing. Leveraging mobility data science and understanding the underlying behavior of human participants concomitantly with different transportation modes, can enable more effective solutions to multiple problems at the heart of improving traffic management. One such example is devising accurate models for dynamic scheduling of public transportation. Another example is the context-aware optimization of traffic signals regime – i.e., incorporating the impact of additional flux of pedestrians in bus/train stations, to minimize the stop-and-go impacts for vehicles.
6.1.4 Health, Well-being, and Productivity
Mobility data has been found increasingly useful in novel applications in the social care domain. For example, contact-tracing solutions have been using human mobility data during the COVID-19 pandemic to notify individuals who may have been in close contact with an infectious individual. As another example, GPS-enabled smart-watch can be used to monitor the movement of elder users. In addition, given the increasingly blurred boundaries between work and private lives, especially since the disruptions led by the pandemic, understanding mobility patterns in conjunction with daily works can provide insights into work-life balance. Given that humans are creatures of habit, disruptions to the daily habits in work and private lives can also led to disrupted productivity. Mobility data can provide a deeper insight to assist users in maintaining health, wellbeing, and productivity, when incorporated to digital assistance.
6.1.5 Situational Awareness
Situational awareness, initially a term coined in defence applications, involve perception of the environmental states using the surrounding data, comprehension of the ingested data to understand the emerging situations, and projection of future states and/or events, which require predictive analytics. Mobility data provides critical components and insights into situational awareness in cities. When achieved, this is applicable not only to enabling robust critical infrastructures in cities, but also to protecting them from harm, such as forest fires, earthquakes, terrorist attacks, etc. Many researchers have used mobility data as an input to enable situational awareness in cities.
6.2 Specific Application Fields
This section described specific applications of mobility data science identified during the Dagstuhl Seminar.
6.2.1 Map Making
The spatiotemporal data science community has proposed many successful solutions to infer maps from trajectory data. Such data is important to identify changes in a road network which is paramount for autonomous driving. In addition to considering trajectories, understanding the underlying purpose of human mobility will allow to create maps tailored to different purposes. For example, by understanding which trajectories correspond to commuters, tourists, and joggers, we can devise better maps for such groups, rather than having a single map that is oblivious to the purpose of a trip and the underlying human behavior. It is important to note that accurate map making is an important enabler in all autonomous car applications, and at the same time data from automonous and semi-autonomous car operation (which includes GPS, video and other sensor readings) is a useful source for improving automatically generated maps.
6.2.2 Public Transportation and Traffic Management
Public transportation and mobility-as-a-service, particularly in urban areas, is a key application area for mobility data science. This also includes the recent ridesharing services. People need to move from A to B daily, either for work, leisure, or caring purpose. The means to achieve that vary, either a single modal trip with a private vehicle, or a multimodal trip involving driving a private car, parking, a subway ride, and a final Uber ride or an e-scooter hire. The latter, when computed as an integrated mobility and offered as a service, is called mobility-as-a-service. The challenges are broad, from understanding demands and volumes of traffic, rides, or shared bikes pick-ups, to allocating resources (vehicles as well as drivers) to regions with high demand. In peak travel times, and high holiday seasons, efficient and effective transportation and mobility services, and other application of smart cities (such as smart parking) are critical to enable sustainable operations in cities.
6.2.3 Contact Tracing
Contact Tracing refers to the process of tracking persons who may have come into spatial contact with an infected person, and subsequently collecting further information about these contacts. The feature-rich interaction, processing and localization/communication modalities of smartphone devices, have brought these to battle on the technological forefront and have curbed the fast spread of pandemics, like COVID-19. The community has to this date proposed a wide range of approaches, ranging from: opportunistic to participatory approaches, privacy-sensitive to no-privacy approaches, handheld-based (distributed) to cloud-based (centralized) approaches, proximity-based (e.g., BLE, sound) to location-based approaches (e.g., Wi-Fi, GPS), for only outdoor settings to indoor settings, using closed-source to open-source counterparts. However, a wide range of challenges remain unanswered, including methodologies to improve the penetration and adoption rates, alleviate privacy or expectation skepticism, ubiquitous availability on low-end terminals as well as technological/psychological adoption barriers, achieving cross-country interoperability with standard formations beyond recommendations, scalability/reliability and accuracy verification of engaged spatial technologies as well as lessons about effectiveness from real large-scale deployments.
6.2.4 Pandemic Prevention
Leveraging (human or animal) mobility data to understand the underlying behavior will allow us to gain an understanding of how a new or re-emerging disease spreads across space and time, provide accurate predictive models and devise actionable interventions and policies to prevent future epidemics and pandemics. Such understanding will require close collaboration with sociologists who are able to explain human behavior (such as social distancing behavior or vaccine uptake), epidemiologists to understand the ecology of infectious diseases, and experts in policy to help devise policies to mitigate diseases spread and to effectively communicate such policies to the public.
6.2.5 Elder Health Monitoring
GPS-enabled smart-watch technology can be used to monitor the movement of elder users. The trajectory data recorded by this smart-watch can reflect the mental health state of the user. In particular, if the user is showing early signs of dementia, her/his trajectories could show an abrupt change from her/his movement history. For instance, a user, who normally walks in a park then going to a restaurant, is found to only stay in the park for a substantial amount of time. Indoor sensors installed in the room can also be used to track whether an elder or a patient falls from the bed. Trajectory outlier analysis methods, together with gerontology knowledge, can be very useful for this kind of applications.
6.2.6 Indoor Localization/Navigation
Indoor localization is still an open research problem due to the non-existence of the indoor equivalent of GPS: a system that can provide the user location in any building worldwide. This is particularly important in many applications such as pandemic tracing, E911, indoor analytics, among others. There are a number of systems developed over the years to address this problem based on different data sources including WiFi signals strength and time of arrival, cellular signal, UWB, ultrasonic, magnetic tracking, inertial sensors, among others but also a new wave of infrastructure-free localization method using deep learning and computer vision.
6.2.7 Location Privacy
The incorporation of localization technologies creates new challenges with privacy, as localization processes might allow the service provider to know the location of a user at all times. Location tracking is unethical in many respects and can even be illegal if it is carried out without the explicit consent of a user. It can reveal the stores and products of interest in a mall we’ve visited, doctors we saw at a hospital, book shelves of interest in a library, artifacts observed in a museum and generally anything else that might publicize our preferences, beliefs and habits. Privacy-preserving localization has been an intensive subject of research in the past, yet the advent of new localization, tracking and contact tracing technologies brings new challenges to the topic that need to be investigated by the mobility data science commununity.
6.2.8 Marine Transportation
International shipping is 1000 million tonnes CO2 one of the main emitters of Greenhouse Gases (GHG). This is equivalent to 3% of the global emissions worldwide, in the order of the total emissions of Germany. An optimization of ship routes could effectively lead to significant reductions of GHG emissions and contribute to the actions against anthropogenic global warming. The influence of ocean currents, waves and wind on the course and speed to ships are known for centuries. Mean currents, usually displayed in sea charts, can be used, for example to utilize the Gulf Stream on the way from North America to Europe and avoid it on the way back. However, ocean currents are highly variable and change their strength and directions on timescales of days to weeks. Used optimally, ocean currents lead to more efficient paths between two given ports. Though the spatial and spatiotemporal database and mobility community well studied how to optimize routes on street traffic networks taking many influencing parameters, like traffic jams, route preferences, etc. into consideration, problems of open-water routing for ships hasn’t been touched by the community, yet. This application field opens up new interesting fields of research in the community, including studies on ocean current, wave and wind prediction, free-space routing, routing in highly dynamic environments, etc.
6.2.9 Animal Behavior
It has been long recognized that the motion trends of different wildlife species have a significant impact on ecological processes, spanning from the dynamics of biodiversity, through transmission of diseases, to feedback-like changes of the very animals behavior in terms of relocating breeding locations. Advances in sensing devices and communication have increased the observational capabilities – however, to date, there is no systematic exploitation of such data in a manner that would enable derivation of models for predicting the animal behavior and movement ecology broadly. In addition to the landscape type of interactions with terrestrial animals (e.g., pasture vs. forestation; impact of urbanization) that could benefit from mobility data science, there is significant potential of its application in the domain of aquatic animals where certain species (e.g., salmon) are well known to travel large distances between their adult habitat and the nesting one.
6.3 Algorithmic Paradigms
In addition to discussing how spatial computing can be applied to other fields, the Applications Working Group also discussed the flipside of which novel algorithmic paradigms may find application in spatial computing. This section summarizes these findings.
6.3.1 Blockchain Computing
A key component in future Web 3.0 scenarios using edge learning is the requirement to utilize a shared database that allows all participants to operate collaboratively with more functionality and transparency. The objective is to enable users execute updates and queries on the collaborative edge database while preserving a consistent view among all users maintaining the system consistency and transparency. Blockchain database architectures keep records on an immutable chain of blocks, so later on, nodes agree on the shared state across a network of untrusted participants. Thus, it forms the blockchain platform that can be viewed as a distributed (transaction-log or) database system. One basic obstacle in these are performance issues measured in terms of throughput and latency, because of the lengthy consensus protocols. As such, the Mobile Data Science community needs to identify new algorithms, structures and protocols to make blockchain databases for mobility data science practical and efficient.
6.3.2 Quantum Computing
Quantum computing provides a new way of designing algorithms that provides a number of advantages over their classical counterparts. For example, quantum parallelism can allow exponential gains in speedup and storage space compared to classical algorithms. Moreover, the no-cloning theory, which states that quantum bits (qubits) cannot be copied, gives an advantage to quantum algorithm in different security applications. This in turn opens the door for addressing different mobility data science problems in terms of enhancing the speed of the current algorithms as well as introducing new algorithms that benefit from the potential of quantum computing concepts. For instance, quantum computing allows to solve np-hard problems efficiently, which affects many spatial computing problems that can be reduced from the np-hard traveling salesman problem.
6.3.3 Visualization of Mobility Data
As discussed and defined in Section 3, mobility data science considers the human behavior that underlies the observed data. It requires expertise from behavioral and social sciences not only to understand this behavior, but also to leverage this understanding for informed decision and policy making. To make mobility data science results actionable for policy makers, such as local health departments, an important paradigm is effective visualization of mobility data to inform domain experts that may not be computer scientists. New solutions for mobility data visualization are required to go beyond understanding of spatiotemporal patterns towards understanding of the underlying behavioral patterns that drive them.
6.3.4 Modeling and Simulation
Understanding the human behavior that causes observed spatiotemporal data allows us to abstract behavior into models of human behavior that can be captured by simulation models. For example, the decision process of individuals to visit a certain point of interest like a coffee shop can be modeled depending on age and gender of individual agents in an agent-based model. Informed by observed human mobility data, such an (agent-based) model can than be used to simulate entire cities having millions of individuals. Such simulation can then be used to predict future “what-if”-scenarios, for example to predict the impact of opening a new coffee shop or of changing the menu to attract certain population groups, or to simulate the spread of an infectious disease across a city. Having the ability to run many such simulation, we can investigate optimal actions and policies achieve a desired future, for example to maximize the number of customers in a coffee shop, or to minimize the spread of an infectious disease.
7 Mobility Data Science and Industry
There is a consensus that we want to make our work practical, and the connection with industry is a good motivator toward this goal. But how to create such connections? Talking to engineers and product groups is more effective in establishing links than talking to industrial R&D groups. Engineers and product groups own the data and the products, and they have the problems. Visiting the company and giving presentations and demonstrations is a persuasive way to develop contacts. Industry is generally interested in getting exposed to good students for hiring. Thus, inviting industry to sponsor student activities such as programming contests and projects is another way to create links. Commercial companies also fund research directly, sometimes in the form of collaborations. Industry can also be found in 3rd party communities with common interest for research, like OGC, thematic meetups, hackathons, and tournaments.
University researchers can provide teaching and training opportunities for people in industry, which helps bridge the gap. Other than industry, research can generate impact by involving the future beneficiaries and users. Industry, on the other hand, could launch projects with a lab culture, where they prepare a sandbox where researchers can work and put their algorithms to have impact on an industry problem.
The efforts in academia and industry are not always aligned. Figure 5 outlines the different cases. The first case is where an idea starts in academia and gets adopted in industry. Good examples for this case are navigation, map matching, route planning, and map making. The three top problems with Mobile data that Microsoft is trying to solve are: (1) how to spend less on road map data, (2) how to identify where people visit, and (3) creating enterprise solutions for fleet management.
Spatial indexes have also proved to be very useful for practical applications, and they came from academia. However, after the very first spatial index proposals for R-tree and Quad-tree, very many indexing papers appeared proposing incremental changes. Improving a spatial index to perform 2% better is not an interesting problem to industry. It comes at a high cost of development, testing and deployment, which is not worth the time from the company’s point of view. Integrating such solutions depends on the ROI of the proposed improvement. If this enables new products and applications or saves costs, it will be integrated – assuming it is maintainable.
Many inventions are getting traction when they are available for a broader community via open source. The speed may also result from industry actions like Amazon Scholar, where researchers can become affiliated to Amazon and get full employee access to data and resources to implement their ideas. Another way is to launch academic startups and take the ideas directly to industry.
The second case in Figure 5 is when an idea that starts in academia never makes it to industry. A main reason is that the problem is made up, and does not map to real user need. Location prediction has been around for a while, but never got into real use. Another example is the problem of understanding what people are doing from their mobility. A third example is COVID contact tracing. It became clear early that there is not enough data to make COVID tracking applications work. Nevertheless many papers continued to appear with COVID tracking solutions. Another reason for not reaching the industry is that the solution might be too complex to implement. If simpler solutions exist, they tend to be more adopted, being easy to integrate with the whole eco-system that the industry has. Some complex solutions found their way to commercial tools though, backed by strong customer need, e.g., RSA encryption.
Researchers might be in a position to think that the feedback from industry limits visionary thoughts. The problems of industry are no less interesting than the problems of open-ended research. Industry operate on constraints for price, for time, for infrastructure, and so forth. The ability of research to recognize as many of these constraints as possible, makes it effective.
The fourth case, and possibly the most recurring, is where a practical mobility problem is not picked up by academia. This is mostly because of lack of data. Data is a key for research in mobility, and the lack of data is a major obstacle. To strengthen the data sharing between industry and academia, both sides need to converge toward the ambitions of each other. The business ROI is different from research ROI. Researchers want publications, citations, keynotes, and research funds while industry wants profits, IP, new markets, and new products. Researchers tend to ignore practical/technical difficulties, such as the deployment of the solution. Something simple like the availability of a docker image can push forward an innovation to get used. This can also be addressed by starting further research/innovation projects in 3rd party founded programs. A connection of interesting and valuable research topics with market requests and opportunities can trigger a win-win-win situation, where researchers can publish results, companies can integrate the findings in their products and users do get improved solutions. Initiatives such as the EU’s FAIR principle can ensure real data becomes available. However, the EU’s GDPR rights must be fulfilled to ensure the privacy of individuals.
Synthetic data is still highly useful, e.g, to test the scalability of solutions. Such datasets should have similar properties with existing publicly available datasets, and will also foster the development and testing of new research by academia. To build such benchmarks we will need to leverage new optimization techniques and mobility models.
In early 2000s, spatial data used to be addressed as a special kind of data in database engines. This proved to be counter productive, as users rather prefer to have native support for their data in the database that they use. Applying this experience to the domain of mobility data, it has to be thought of from the beginning as a native data type.
8 Towards a Mobility Data Science Curriculum
When we initiate a curriculum, and consequently a degree, we have implicit commitment to the students that join this degree about the market opportunities. In the case of mobility data science, clear employers will be cities, transport authorities, and consultation companies. The current state in market is that there are CS graduates who approach every problem by code, and often try to re-invent the wheel. On the other hand there are geographers, planners, and architects who are often not able to code. This gap is currently closing by discrete initiatives for programs that link the two. With this argument, it is time to harmonize these initiatives and start collaborating on building curricula for mobility data science. Yet we need to take steps to evolve interest, and hence to evolve sufficient mass of students. Naturally this has to go bottom up, starting with a single course, then a specialization, then a study program, depending on the student enrollment.
A text book on mobility data science is missing. The seminar participants collaborated in creating a list of topics to be included in a curriculum.
-
Basic principles of mobility data science
-
Intro to time-series, ST and trajectory, spatial data handling
-
Mobility data modeling, e.g., multi-modal traffic modeling
-
Mobility databases and query processing
-
Modelling, i.e., transform a real-world problem into a computational problem that is meaningful.
-
Search and Optimisation, e.g., routing
-
Movement data processing, and data warehousing
-
Specific errors and problems in mobility data (data quality and data cleaning)
-
Mobility data visualization
-
ML techniques for mobility data
-
Privacy of mobility data, GDPR, and data minimization
-
Ethical, responsible / FATE in AI for mobility
-
Hands-on mobility data science projects and case studies
-
Big data mobility processing
A practical approach to developing a book is to start by a mobility data science problem, then develop the needed theory and techniques towards solving this problem. Imagine a company that wants to develop an application for eco-routing starting with CAN bus data. The process of developing the curriculum would then develop around the needed steps. The company will need to first collect the data, then clean, transform, correlate with weather data, etc. The curriculum shall then be developed in a way that teaches students the theory and practice of these tasks.
Building a complete program on mobility data science for CS students might be too specific at the moment. A pragmatic approach is to incorporate it as a special track in existing data science programs (1-2 semesters). It can also be offered as a specialized diploma/certification program. This argument is supported by the big overlap in knowledge, skills, and questions between data science and mobility data science. Both share the foundations of statistics, graph theory, linear algebra, measures and metrics, etc. They also share the techniques like clustering, classification, learning, heterogeneity and modeling. As such mobility data science will be more of an appealing flavor of data science, mainly to attract students, while teaching the same thing with a twist.
Yet if we expand the scope, which seems more proper, a mobility data scientist needs to acquire other knowledge and skills than CS. Domains like urban and transportation have went a long way in building curricula. A curriculum in mobility data science should not ignore and redo. Mobility is not entirely a CS topic. It connects to people mobility, and students must be trained on the human and policy aspects. A curriculum should cover at least the additional topics of: geography, urban/transport planning, and ethics. Students also need to learn the pitfalls of real-world data, which is a topic that is often missed in CS programs. They need to learn and appreciate the state of art in mobility and transport modeling. Finally they need to learn how to produce value with minimal data requirements, and how to deal with the human part of the problem. Building such a curriculum cannot be solely covered by CS departments. It has to be conceived in an inter-faculty structure. A mobility data science curriculum should not adopt on a toolbox view. It should rather train students for analyzing and explaining the results.
Promoting a disciplined approach to mobility data science goes through open science and open software. A basic toolset, developed through proper scientific software development, that every can use helps aligning the state of practice and the sharing of experience among practitioners. Successful examples in the spatial domain are the geopandas, and geos libraries. It also helps to promote this discipline in scientific and in practitioner events, and to possibly evolve communication platforms and events.
9 Closing Notes
The vivid discussions during the seminar demonstrated a consensus that it is timely to identify mobility data science as a multidisciplinary research topic, and to start building a community. This report presented a clear definition of the scope of work, and the key research problems for this community. Many of the participants indicated the necessity to have follow up events, e.g., another Dagstuhl Seminar, and community building tools, e.g., mailing list. Specially that the majority of participants in this seminar were remote, a physical gathering should be planned as soon as the pandemic situation allows.
The majority of participants in this seminar stem from CS domains. In follow-up events, it will be needed to increase the participation of other domains such as social and behavioral sciences and epidemiology whose expertise is paramount to understand the human behavior that causes mobility data.
In the time of COVID-19, organizing a scientific gathering is challenged by the uncertainty of physical participation. The organizer would like to thank the Dagstuhl team, which allowed the switching from purely onsite into hybrid only a few weeks before the seminar due to the Omicron variant of COVID-19. This flexibility, which is not matched by hotels and conference centers, allowed the organizers to focus on the program and the participation, rather than focusing on the venue logistics. This Dagstuhl Seminar allowed the field of mobility data science to take a great step forward. All participants greatly appreciate the unique opportunity that Dagstuhl provides for supporting the science.
Seminar Hybrid-Photo
![[Uncaptioned image]](Figs/hybridphoto.jpeg)
10 Participants
-
Taylor Anderson – George Mason Univ. – Fairfax, US
-
Amr Magdy – University of California – Riverside, US
-
Mahmoud Sakr – ULB – Brussels, BE
-
Flora Salim – University of New South Wales – Sydney, AU
-
Maxime Schoemans – ULB – Brussels, BE
-
Bettina Speckmann – TU Eindhoven, NL
-
Marc van Kreveld – Utrecht University, NL
-
Andreas Züfle – George Mason Univ. – Fairfax, US
![[Uncaptioned image]](22021.jpg)
11 Remote Participants
-
Jussara Almeida – Federal University of Minas Gerais-Belo Horizonte, BR
-
Gennady Andrienko – Fraunhofer IAIS – Sankt Augustin, DE
-
Natalia V. Andrienko – Fraunhofer IAIS – Sankt Augustin, DE
-
Walid Aref – Purdue University – West Lafayette, US
-
Eric Auquiere – STIB / MIVB – Brussels, BE
-
Yang Cao – Kyoto University, JP
-
Sanjay Chawla – QCRI – Doha, QA
-
Reynold Cheng – University of Hong Kong, HK
-
Panos Kypros Chrysanthis – University of Pittsburgh, US
-
Xiqi Fei – George Mason Univ. – Fairfax, US
-
Gabriel Ghinita – University of Massachusetts – Boston, US
-
Anita Graser – AIT – Austrian Institute of Technology – Wien, AT
-
Dimitrios Gunopulos – University of Athens, GR
-
Joon-Seok Kim – Pacific Northwest National Lab. – Richland, US
-
Kyoung-Sook Kim – AIST – Tokyo Waterfront, JP
-
Peer Kröger – Universität Kiel, DE
-
John Krumm – Microsoft Corporation – Redmond, US
-
Johannes Lauer – HERE – Schwalbach am Taunus, DE
-
Mohamed Mokbel – University of Minnesota – Minneapolis, US
-
Mario A. Nascimento – University of Alberta – Edmonton, CA
-
Siva Ravada – Oracle Corp. – Nashua, US
-
Matthias Renz – Universität Kiel, DE
-
Dimitris Sacharidis – ULB – Brussels, BE
-
Mohamed Sarwat – Arizona State University – Tempe, US
-
Cyrus Shahabi – USC – Los Angeles, US
-
Egemen Tanin – The University of Melbourne, AU
-
Yannis Theodoridis – University of Piraeus, GR
-
Kristian Torp – Aalborg University, DK
-
Carola Wenk – Tulane University – New Orleans, US
-
Martin Werner – TU München – Ottobrunn, DE
-
Song Wu – ULB – Brussels, BE
-
Li Xiong – Emory University – Atlanta, US
-
Jianqiu Xu – Nanjing University of Aero- nautics and Astronautics, CN
-
Moustafa Youssef – Alexandria University, EG
-
Demetris Zeinalipour – University of Cyprus – Nicosia, CY
-
Esteban Zimanyi – ULB – Brussels, BE
-
Dimitris Zissis – University of the Aegean – Ermoupolis, GR