Human in the (Process) Mines
Abstract
This report documents the program and the outcomes of Dagstuhl Seminar 23271, “Human in the (process) mines”. The seminar dealt with topics that are at the intersection of process mining and visual analytics, and can potentially contribute to both areas. Process mining is a discipline blending data science concepts with business process management. It utilizes event data recorded by IT systems for a variety of tasks, including the automated discovery of graphical process models, conformance checking between data and models, enhancement of process models with additional analytic information, run-time monitoring of processes and operational support. Ultimately, the purpose of process mining is to make sense of event data and answer business and domain-related questions to support domain-specific goals. Visual Analytics, defined as “the science of analytical reasoning facilitated by interactive visual interfaces,” is a multidisciplinary approach, integrating aspects of data mining and knowledge discovery, information visualization, human-computer interaction, and cognitive science to support humans in making sense of various kinds of data. While these two research disciplines face similar challenges in different contexts, there have been few interactions and cross-fertilization efforts between the respective communities so far. This Dagstuhl Seminar is intended to bring together researchers from both communities and foster joint research efforts and collaborations to advance both fields and enrich future approaches to be developed.
Keywords and phrases:
human in the loop, process mining, visual analyticsSeminar:
July 2–7, 2023 – https://www.dagstuhl.de/232712012 ACM Subject Classification:
Applied computing Business process management ; Human-centered computing Visual analyticsCopyright and License:
![[Uncaptioned image]](x1.png) Except where otherwise noted, content of this report is licensed under a
Creative Commons BY 4.0 International license
Except where otherwise noted, content of this report is licensed under a
Creative Commons BY 4.0 International license
1 Executive Summary
Claudio Di Ciccio (Sapienza University of Rome, IT)
Silvia Miksch (TU Wien, AT)
Pnina Soffer (University of Haifa, IL)
Barbara Weber (Universität St. Gallen, CH)
License: ![[Uncaptioned image]](x2.png) Creative Commons BY 4.0 International license © Claudio Di Ciccio, Silvia Miksch, Pnina Soffer, and Barbara Weber
Creative Commons BY 4.0 International license © Claudio Di Ciccio, Silvia Miksch, Pnina Soffer, and Barbara Weber
This summary provides an overview of the outcomes of our Dagstuhl Seminar Human in the (Process) Mines. It began with a general introduction to the aim, scope and context of the Dagstuhl Seminar. The preliminary presentation was followed by a sequence of two-minute speeches, with which every participant could give a brief overview of their own background, expertise and personal expectations for the seminar. The seminar participants included experts from both the process mining and visual analytics communities, with industry representatives and researchers in academia at different levels of seniority. The following four talks then set the scene to establish a shared understanding of the two research areas’ core concepts, employed methods and pursued aims: “Process Mining and Visual Analytics: A Story of Twins separated at Birth,” by Jan Mendling; “Visual Analytics for Time-Oriented Data” by Wolfgang Aigner; “The Interaction Side of Visual Analytics” by Christian Tominski; “The Process of Process Mining: Looking into Process Mining through the Lens of Process Analysts,” by Francesca Zerbato. The reader can find the abstracts of those talks below. Thereupon, a plenary brainstorming session began, moderated by the seminar organizers. Every participant in the assembly could suggest a topic that they would like to investigate together with the other attendees. The whole assembly decided how to distill and join the topics together. Figure 1 shows the set of fourteen arguments gathered from the discussion, then merged into eleven points (see the right-top, left-top, and bottom-left quadrants in the figure). To form the working groups, every attendee was asked to write on a card their name and the top two topics they would like to discuss further, in order of priority (see Fig. 1 in the bottom-right corner). The organizers collected the cards and divided the participants into groups of five to six people based on the preferences declared on the cards while keeping the teams heterogeneous in terms of background, research interests and affiliation. To this end, the suggested topics underwent another merging round in order to draw out six key research questions at the intersection of process mining and visual analytics. The questions and the main results that were achieved follow.

How to incorporate knowledge into an interactive analysis process of event data?
Addressing this question resulted in a conceptual model of knowledge-assisted interactive visual process mining, which extends an established model in the area of visual analytics. To validate this model, it has been instantiated for an example process mining task.
How to make sense of multi-faceted process data?
This question has guided the development of an interactive framework called “Tiramisù”. Based upon the interconnection of multiple visual layers, it displays process information under different perspectives and projects them onto a domain-friendly representation of the context in which the process unfolds. The feasibility of the framework was demonstrated through its application in use-case scenarios. A paper summarizing these results has been submitted to a workshop co-located with the 5th International Conference on Process Mining (ICPM 2023).
What comprehension metrics can be used to evaluate visualizations for process mining tasks?
As a starting point for addressing this question, the ICE-T hierarchical evaluation framework was selected to adapt its metrics for the process mining domain. Adapting the methodological approach included the selection of process mining tasks and the use of the ICE-T framework for evaluation. An initial evaluation using the Disco process mining software and the road traffic fine management process data set was performed.
How to select appropriate visualizations for object-centric and multi-dimensional process mining tasks?
Addressing this question has focused on investigating and developing a conceptual categorization that facilitates a structured design process of multidimensional visual process mining artefacts grounded in multi-faceted visual analytics design. Existing process mining visualizations have been mapped onto well-established visual analytics facets.
How to design visualizations for the task of conformance checking?
This question deals with providing visual support to a major process mining task, of assessing conformance between a process model and the behaviour captured in event data, measuring it, spotting deviations, and analyzing them. Addressing this question, gaps in existing conformance-checking visualizations were analyzed. Then, using a visual analytics workflow, specific application scenarios of conformance checking were analyzed.
How to support human-centred process mining by constructing a unified process mining and visual analytics task taxonomy?
Aiming to realize opportunities at the intersection of human-centred process mining activities, the various cognitive aspects of these activities, and visual ways of supporting them, a taxonomical approach was taken. The objective of the proposed taxonomy was to establish a common vocabulary and shared understanding across the three bodies of knowledge, serve as a point of reference, and inform measurements for evaluating process visualizations.
From the second day on, time was mostly devoted to working groups, each discussing one of the research questions that were raised in breakout sessions. This activity was accompanied by “lightning talks”, i.e., brief presentations on issues that emerged during the discussions: “Process mining: A hands-on session” by Anti Alman, “Extended Cognition with Big Data and AI” by Irit Hadar, “How Visual Analytics People Work: Design Study Methodology in Practice” by Tatiana von Landesberger, and “Coping with Volume and Variety in Temporal Event Sequences” by Jan Mendling. Periodic intermediate group presentations reported on the advancement of the teams’ work. The final presentations of the results achieved by the working groups and a discussion of the continuation of the freshly established collaborations took place on the final day. The seminar was concluded with the plan for a follow-up Dagstuhl Seminar, having Pnina Soffer, Katerina Vrotsou, Claudio Di Ciccio, and Christian Tominski as the proponents and prospective organizers. In the remainder of this report, the talks held on the first day of the Human in the (Process) Mines Dagstuhl Seminar and the final working group reports follow.
2 Table of Contents
3 Overview of Talks
3.1 Visual Analytics for Time-Oriented Data
Wolfgang Aigner (FH – St. Pölten, AT)
License: Creative Commons BY 4.0 International license © Wolfgang Aigner
Main reference: Wolfgang Aigner, Silvia Miksch, Heidrun Schumann, Christian Tominski: “Visualization of Time-Oriented Data”, Springer, 2023
Visual Analytics (VA) has been defined as the science of analytical reasoning supported by interactive visual interfaces. This hints towards the goal of supporting human users in making sense of large and complex data. In order to achieve that, VA intertwines computers and humans by combining automated analysis with interactive visualization methods. Processes and sequences are concepts inherently tied to the time dimension. Therefore, the focus of this talk is on Visual Analytics for time-oriented data. In particular, this includes aspects of modeling of time and time-oriented data, their visualization, as well as interactivity.
3.2 Process Mining and Visual Analytics: A Story of Twins separated at Birth
Jan Mendling (HU Berlin, DE)
License: Creative Commons BY 4.0 International license © Jan Mendling
Joint work of: Jan Mendling, Anton Yeshchenko
In this talk I elaborate on the relationship and intersection of process mining and visual analytics research. Partially, I refer to a recent survey by Anton Yeshchenko and Jan Mendling on Approaches for Event Sequence Analysis and Visualization using the ESeVis Framework (https://arxiv.org/abs/2202.07941).
3.3 The Interaction Side of Visual Analytics
Christian Tominski (Universität Rostock, DE)
License: Creative Commons BY 4.0 International license © Christian Tominski
Main reference: Christian Tominski, Heidrun Schumann:: “Interactive Visual Data Analysis,” AK Peters Visualization Series, CRC Press 2020, ISBN 9781498753982.
Visual Analytics combines computational, visual, and interactive methods to help users gain insight into large and complex data. In this talk, I highlight the importance of interactivity for the knowledge generation process. In the first part of the talk, I explain basic models and notions of interaction, including Shneiderman’s information seeking mantra, Keim’s visual analytics mantra, Norman’s action cycle, Yi’s interaction intents as well as direct manipulation and fluid interaction as defined by Shneiderman and Elmqvist. The second part of the talk showcases several techniques for interacting with graph structures, mostly from my own work, including responsive matrix cells for analyzing and editing multivariate graphs, interactive lenses for graph exploration, naturally-inspired visual comparison, and fluid in-situ unfolding of edges. I also briefly touch upon guidance in visual analytics, progressive visual analytics, and multi-modal interaction. I close with advocating human-data interaction as a key ingredient of visual analytics.
3.4 The Process of Process Mining: Looking into Process Mining through the Lens of Process Analysts
Francesca Zerbato (Universität St. Gallen, CH)
License: Creative Commons BY 4.0 International license © Francesca Zerbato
Joint work of: Francesca Zerbato, Pnina Soffer, Barbara Weber, Lisa Zimmermann, Elizaveta Sorokina, Irit Hadar
Over the years, process mining research has mainly emphasized the development of automated techniques, giving less attention to the crucial role of (human) analysts involved in the analysis process. Research on the Process of Process Mining (PPM) aims to uncover how process analysts do their work in practice, i.e., how they act in the process mining tools and how they reason as the analysis unfolds. This talk provides an overview of recent research on the PPM, describing how the combination of different modalities of data, such as interaction traces and verbal data, can be combined to gain insights into the behavior and work practices of process analysts. The talk concludes by presenting two illustrative examples of analyzing such data. The first example demonstrates a bottom-up analysis approach utilizing interaction trace data to reveal what visualizations are used during the analysis, how they are used and why. The second example introduces a novel cognitive model derived from the theory of Prediction Error Minimization, which offers a top-down analytical perspective on the behavior of process analysts and their cognitive processes.
Acknowledgments.
B. Weber, F. Zerbato and L. Zimmermann are supported by the ProMiSE project funded by the SNSF under Grant No.: 200021_197032.
4 Working groups
4.1 Visual Process Mining: from Interaction to Knowledge
Wolfgang Aigner (FH – St. Pölten , AT), Chiara Di Francescomarino (University of Trento, IT), Daniel Schuster (Fraunhofer FIT – Sankt Augustin, DE), Cagatay Turkay (University of Warwick – Coventry, GB), and Francesca Zerbato (Universität St. Gallen, CH)
License: Creative Commons BY 4.0 International license © Wolfgang Aigner, Chiara Di Francescomarino, Daniel Schuster, Cagatay Turkay, and Francesca Zerbato
Process mining (PM) techniques enable organizations to extract valuable insights and generate knowledge from the event data captured by their information systems. Visual analytics (VA) aims to intertwine analytical reasoning by humans based on visual perception with the processing power of computers for automated data analysis [5]. Both fields share the aim of generating knowledge based on data, but have developed rather independently from each other. Process mining research has emphasized the development of automated techniques, giving less attention to the role of (human) process analysts involved in the analysis [6]. Visual analytics literature focuses mostly on event data [3] and have paid little attention to the underlying process models and lack approaches to address some common tasks in process mining. There is therefore significant potential for the two communities to learn from each other and develop synergies across concepts, theories, methods, and artifacts.
This working group focused on studying the role of the human together with the integration of knowledge in the overall process. Presently, only a few process mining techniques incorporate knowledge alongside event data, which is the primary input for most techniques [4, 2]. For instance, the work by Schuster et al. [4] reviews domain knowledge utilization in process discovery. However, few knowledge-utilizing approaches exist compared to automated discovery techniques, indicating the need for further research.
Our group, comprising process mining and visualization researchers, started with exploring existing process mining and visual analytics models and approaches to develop a shared language across the team. We set out to bring together established models and techniques from the visual analytics and process mining literature with an objective to explore an interactive and visual approach to doing process mining that puts humans and domain knowledge at its core. We narrowed down our emphasis to conceptual frameworks that emphasize knowledge and how it is elicited and externalized through the use of visual analytics and process mining techniques.
Specifically, we based our work on a conceptual model of knowledge-assisted visual analytics (KAVA) [1] that brings together visualization, automated analysis, analytical reasoning of human users, and the knowledge created based on these. Central to the KAVA model is the utilization of visualizations and interaction to extract knowledge from data.
Building upon the KAVA model, we focused on adapting it to the process mining domain. To this end, we evaluated various common process mining tasks such as process discovery, conformance checking, temporal performance analysis, predictive process mining, comparative process mining, and action-oriented process mining in the context of the model. As a result, we derived a conceptual model that allows us to understand how different process mining approaches involve and consider humans and how process analysts generate and externalize knowledge through their interaction with process mining tools and techniques.
Figure 2 reports the derived conceptual model.
Going beyond the classical PM approaches that automatically learn from data, the model focuses on the user-machine system, and especially on how the human user visualizes (V), interacts (E), as well as generates (through perceptions and interactions) and externalizes (X) tacit knowledge in PM tasks.
We derived the model in several iterations. First, in dialogue with the process mining literature, we started untangling and interrogating the different components of the KAVA model. Our goal with this exercise was twofold: 1) to understand the model’s fit and coverage for process mining, and 2) to revise the model as a descriptive framework for a knowledge-centric interactive and visual process mining approach.
Then, we explored the literature in both visual analytics and process mining to associate techniques, concepts and terms to each of the components in the model, e.g., we listed automated data processing techniques from both areas specifically designed for event-based and process data. We then focused our attention on the transitions between these elements and added new transitions and links to strengthen how well the model underpins our envisioned knowledge-centric interactive and visual process mining approach.
Once we established a first version of the model, our next exercise was to go over a range of process mining sessions as a case study and explore how comprehensively our model captures the process mining process. This enabled us to put our model to test. This exercise resulted in a number of revisions which led to the model we introduced in Figure 2. We concluded our working group activities by identifying a range of process mining tasks that will enable us to more systematically evaluate our model in the next steps.
Summing up, the discussions of the working group resulted in two main outcomes: 1) a conceptual model for interactive visual process mining that takes a knowledge-centric perspective; 2) an instantiation of the model on a real PM task so as to validate the suitability of the model to the field, as well as to identify challenges and opportunities for both communities.
Going forward, the working group will further refine the proposed model with a goal to better understand the role of tacit and explicit knowledge in the context of different process mining tasks. We will use the model as a vehicle to identify challenges, open problems and opportunities in supporting users in generating and externalizing knowledge during visual process mining. Through these we envision to bring the process mining and visual analytic communities together along a shared research agenda on advancing interactive and visual process mining.
Acknowledgments.
F. Zerbato is supported by the ProMiSE project funded by the SNSF under Grant No.: 200021_197032.
References
- [1] Paolo Federico, Markus Wagner, Alexander Rind, Albert Amor-Amoros, Silvia Miksch, and Wolfgang Aigner. The role of explicit knowledge: A conceptual model of knowledge-assisted visual analytics. In Brian D. Fisher, Shixia Liu, and Tobias Schreck, editors, 12th IEEE Conference on Visual Analytics Science and Technology, IEEE VAST 2017, Phoenix, AZ, USA, October 3-6, 2017, pages 92–103. IEEE Computer Society, 2017.
- [2] Chiara Di Francescomarino, Chiara Ghidini, Fabrizio Maria Maggi, Giulio Petrucci, and Anton Yeshchenko. An eye into the future: Leveraging a-priori knowledge in predictive business process monitoring. In Josep Carmona, Gregor Engels, and Akhil Kumar, editors, Business Process Management – 15th International Conference, BPM 2017, Barcelona, Spain, September 10-15, 2017, Proceedings, volume 10445 of Lecture Notes in Computer Science, pages 252–268. Springer, 2017.
- [3] Phong H. Nguyen, Rafael Henkin, Siming Chen, Natalia V. Andrienko, Gennady L. Andrienko, Olivier Thonnard, and Cagatay Turkay. VASABI: hierarchical user profiles for interactive visual user behaviour analytics. IEEE Trans. Vis. Comput. Graph., 26(1):77–86, 2020.
- [4] Daniel Schuster, Sebastiaan J. van Zelst, and Wil M. P. van der Aalst. Utilizing domain knowledge in data-driven process discovery: A literature review. Comput. Ind., 137:103612, 2022.
- [5] James J. Thomas and Kristin A. Cook. A visual analytics agenda. IEEE Computer Graphics and Applications, 26(1):10–13, 2006.
- [6] Francesca Zerbato, Pnina Soffer, and Barbara Weber. Process mining practices: Evidence from interviews. In Claudio Di Ciccio, Remco M. Dijkman, Adela del-Río-Ortega, and Stefanie Rinderle-Ma, editors, Business Process Management – 20th International Conference, BPM 2022, Münster, Germany, September 11-16, 2022, Proceedings, volume 13420 of Lecture Notes in Computer Science, pages 268–285. Springer, 2022.
4.2 Towards a visual analytics framework for sensemaking of multi-faceted process information
Anti Alman (University of Tartu, EE), Alessio Arleo (TU Wien, AT), Iris Beerepoot (Utrecht University, NL), Andrea Burattin (Technical University of Denmark – Lyngby, DK), Claudio Di Ciccio (Sapienza University of Rome, IT), and Manuel Resinas (University of Sevilla, ES)
License: Creative Commons BY 4.0 International license © Anti Alman, Alessio Arleo, Iris Beerepoot, Andrea Burattin, Claudio Di Ciccio, and Manuel Resinas
4.2.1 Introduction
Process mining (PM) is the discipline aimed at extracting information from events recorded by information systems executing processes [22]. The operational context of process mining is multi-variate in that data potentially stems from multiple sources and pertains to diverse dimensions (control flow, time, resources, object lifecycle). As argued by the seminal work of Beerepoot et al. [2], a critical, yet largely unaddressed, issue of process mining is the fixed-granularity level of process analysis, namely the inability to navigate through distinct, and possibly domain-specific, dimensions. This problem makes the investigation of process improvement less effective, as studied by Kubrak et al. [13], as it entails a partial view over an inherently complex search space, which is typical of knowledge-intensive processes [5, 6]. Visual Analytics (VA) is the discipline of supporting users’ analytical reasoning through the use of interactive visual interfaces [12]. VA is intended to keep the user within the analysis loop, so that human comprehension and perception actively contribute to generating new insights and increasing confidence with the analysis results. VA has extensively studied the problem of representing complex, multi-faceted phenomena (see, e.g., [11, 16]), which is also the type of phenomena often encountered within real-life business processes.
Thus far, there has been limited cooperation between PM and VA. In this paper, we argue that VA can play a pivotal role in addressing the above limitation of fixed-granularity in process mining. With a cross-pollinating effect, PM can equip VA with a collection of established algorithms and techniques for the automated generation of process-oriented representations of system dynamics.
During the seminar, we envisioned a novel framework that resorts to VA for the interactive investigation of factual evidence of process insights revolving around information mined from data sources that go under the name of sequence event data, to use VA’s terminology, or event logs, as per the PM nomenclature. Our framework will follow a multi-layer approach, providing end users with a context-aware visualization integrating classical PM representation elements (such as workflow nets [19], directly-follows graphs [21], or declarative process maps [7]) with additional diagrams and visual cues tailored for context-variable and metadata representations (e.g., timelines and calendars for time, geographical or building maps for space). We introduce a couple of use cases that could benefit from such a framework. The interconnection of the different layers and their anchorage to a backdrop onto which the representations are projected provides the user with means to foster explainability for process analysis and, eventually, enhancement.
In the remainder of this section, Sec. 4.2.2 describes our framework, illustrating its key concepts and the interplay of its components. Section 4.2.3 showcases two use cases demonstrating the application of the Tiramisù approach in the area of knowledge-intensive processes. Section 4.2.4 acknowledges some known limitations of our work, paving the path for future work discussed in Sec. 4.2.5.
4.2.2 The Tiramisù framework

In Tiramisù we envision a visualization framework designed to support sensemaking when dealing with complex PM event sequences. Our goal is to augment existing process models with additional dimensions that can provide further context during the analysis, easing the generation of insights and generally providing a more comprehensive understanding of the process and phenomenon under investigation. With this goal in mind, we envision Tiramisù as a multi-level framework (see Fig. 3), reminiscent of the popular tiramisù cake. The framework will be structured with a “backdrop”, a main layer with the process model, and one or more dimension layers. These are meant to be superimposed on the first two, in a details-on-demand fashion, thus reminding the different layers of a tiramisù.
4.2.3 Use-case scenarios
In this section, we illustrate some scenarios that motivate our work. We focus on two classes of knowledge-intensive processes, pertaining to healthcare [15] and personal information management [4].
4.2.3.1 Behavioral deviation analysis in healthcare
Healthcare is one of the most difficult, but at the same time, one of the most promising domains to tackle both in the field of PM [15] as well as in the area of VA [3]. As such, healthcare is a natural domain for applying the Tiramisù approach. To demonstrate this, we have chosen the specific task of analyzing the sleeping routine of patients suffering from dementia or other similar diseases. Naively applying the already existing process mining approaches to this task can, for example, lead to relying on simple process maps where the nodes represent various activities performed by the patients, and the arcs represent dependencies or other temporal constraints among these activities [8]. While the above models may be sufficient for a process mining expert to extrapolate meaningful process insights, it can quickly become challenging for domain experts, who may lack training in interpreting these formalisms: as discussed in [8, 10], the most likely users of such a system would, in practice, not be a process expert, but the doctors and the nurses responsible for the care of the specific patient.
4.2.3.2 Personal productivity analysis in work processes
Personal information management (PIM) pertains to the organization of one’s own activities, contacts, etc., through the use of software on laptops and smart devices. Similarly, personal informatics systems resort to one individual’s own information to pursue the objective of aiding people to collect and reflect on their personal information [14]. Several techniques can be used to collect personal information like non-participant observation, screen recording, and timesheet techniques, each with their own advantages and disadvantages [17]. Regardless of the technique used, collected personal information can be seen as an event log, which can be analyzed using process mining techniques to discover personal work processes.
Depending on the characteristics of the work, personal work processes can be knowledge-intensive and significantly unstructured, which means they present the aforementioned challenges. In this use case, we focus on the personal work processes performed by an academic during her daily work, which involves conducting research, preparing lessons, grading students or reviewing research papers, among many other activities.
Specifically, our focus is on the retrospective analysis of the influence of the personal work processes a person has followed during a certain period of time on the positive or negative outcome of a task. For instance, an academic who has missed the deadline for submitting a review to a conference might be interested in knowing what happened during the period of time in which she was working in the review that caused the delay.
4.2.4 Limitations
Evidence-based discovery approaches suffer from the potential bias given that only a part of processes (especially the knowledge-intensive ones) are recorded by computerized systems [9]. Our framework is in this sense no different. The injection of additional facts stemming from domain experts and users is complementary to this investigation and paves the path for future work (see Section 4.1 for further details in this regard).
Also, we assume the user knows what visualizations best suit their needs, although this may be a challenge on its own. Investigating this aspect goes beyond the scope of this report. However, the interested reader is referred to the work of Sirgmets et al. [18], which presents a framework aimed to guide design choices for the effective visualization of analytical data.
Data-based process analysis tasks often involve a significant amount of time for extracting, reformatting, and filtering event logs from information systems [20]. Our framework requires these preliminary operations too, with the addition that oftentimes knowledge-intensive processes record executions over a heterogeneous set of applications and devices in partially structured or unstructured formats [6]. Furthermore, the notion of a process instance (case) tends to be less defined in such contexts, thus requiring a prior customizable reconciliation of shared events [1]. The emergence of the novel and event data meta-models that are less centered around the concept of case could be beneficial to the information processing we envision in Tiramisù [23].
Finally, our framework covers the visualization aspects related to VA in PM. However, the interaction aspects are only partly discussed, leaving a gap which further iteration of this framework should address. This would be made easier and more effective if a task taxonomy about VA in PM were made available, opening a further research direction with the potential to bring together the two disciplines.
4.2.5 Conclusions and future remarks
In this report, we have envisioned Tiramisù, a framework based on the multi-layered representation of mined process information helping the user navigate the multi-faceted information at hand while keeping the data under the focus consistently linked and navigable across different dimensions.
We foresee the following research endeavors in the future. A further elaboration of the framework and its application to the use case scenarios identified. An evaluation based on an empirical study involving users is in our plans to assess the efficacy and effectiveness of our solution. The implementation of a working prototype is crucial to this extent and is part of our agenda. We envision the customization and refactoring of layers, their aggregation rules, and backdrops as key challenges to be addressed in the future. Finally, we observe that stepping from a single-backdrop multi-layer design to a tree-like hierarchical structure of backdrops could initiate a new path toward a significant extension of the expressive richness guaranteed by our framework.
Acknowledgments.
The work of A. Alman was supported by the European Social Fund via “ICT programme” measure and by the Estonian Research Council grant PRG1226. The work of C. Di Ciccio was supported by the Italian Ministry of University and Research (MUR) under PRIN grant B87G22000450001 (PINPOINT) and by project SERICS (PE00000014) under the NRRP MUR program funded by the EU-NGEU. The work of M. Resinas was partially supported by projects PID2021-126227NB-C21/ AEI/10.13039/501100011033/ FEDER, UE and TED2021-131023B-C22/ AEI/10.13039/501100011033/ Unión Europea NextGenerationEU/PRTR.
References
- [1] Dina Bayomie, Claudio Di Ciccio, and Jan Mendling. Event-case correlation for process mining using probabilistic optimization. Inf. Syst., 114:102167, 2023.
- [2] Iris Beerepoot et al. The biggest business process management problems to solve before we die. Comput. Ind., 146:103837, 2023.
- [3] Jesus J. Caban and David Gotz. Visual analytics in healthcare – opportunities and research challenges. J. Am. Medical Informatics Assoc., 22(2):260–262, 2015.
- [4] Tiziana Catarci, A.J. Dix, Akrivi Katifori, Giorgos Lepouras, and Antonella Poggi. Task-centred information management. In DELOS Conference, volume 4877 of Lecture Notes in Computer Science, pages 197–206. Springer, 2007.
- [5] Jochen De Weerdt, Annelies Schupp, An Vanderloock, and Bart Baesens. Process mining for the multi-faceted analysis of business processes - A case study in a financial services organization. Comput. Ind., 64(1):57–67, 2013.
- [6] Claudio Di Ciccio, Andrea Marrella, and Alessandro Russo. Knowledge-intensive processes: Characteristics, requirements and analysis of contemporary approaches. J. Data Semant., 4(1):29–57, 2015.
- [7] Claudio Di Ciccio and Marco Montali. Declarative process specifications: Reasoning, discovery, monitoring. In Wil M. P. van der Aalst and Josep Carmona, editors, Process Mining Handbook, volume 448 of Lecture Notes in Business Information Processing, pages 108–152. Springer, 2022.
- [8] Gemma Di Federico and Andrea Burattin. Do you behave always the same? In Marco Montali, Arik Senderovich, and Matthias Weidlich, editors, Process Mining Workshops, pages 5–17, Cham, 2023. Springer Nature Switzerland.
- [9] Marlon Dumas, Marcello La Rosa, Jan Mendling, and Hajo A. Reijers. Fundamentals of Business Process Management, Second Edition. Springer, 2018.
- [10] Gemma Di Federico, Andrea Burattin, and Marco Montali. Human behavior as a process model: Which language to use? In Andrea Marrella and Daniele Theseider Dupré, editors, Proceedings of the 1st Italian Forum on Business Process Management co-located with the 19th International Conference of Business Process Management (BPM 2021), Rome, Italy, September 10th, 2021, volume 2952 of CEUR Workshop Proceedings, pages 18–25. CEUR-WS.org, 2021.
- [11] Steffen Hadlak, Heidrun Schumann, and Hans-Jörg Schulz. A survey of multi-faceted graph visualization. In EuroVis (STARs), pages 1–20, 2015.
- [12] Daniel Keim, Gennady Andrienko, Jean-Daniel Fekete, Carsten Görg, Jörn Kohlhammer, and Guy Melançon. Visual analytics: Definition, process, and challenges. Springer, 2008.
- [13] Kateryna Kubrak, Fredrik Milani, and Alexander Nolte. A visual approach to support process analysts in working with process improvement opportunities. Business Process Management Journal, 29(8):101–132, 2023.
- [14] Ian Li, Anind K. Dey, and Jodi Forlizzi. A stage-based model of personal informatics systems. In CHI, pages 557–566. ACM, 2010.
- [15] Jorge Munoz-Gama, Niels Martin, et al. Process mining for healthcare: Characteristics and challenges. J. Biomed. Informatics, 127:103994, 2022.
- [16] Renata Georgia Raidou. Visual analytics for the representation, exploration, and analysis of high-dimensional, multi-faceted medical data. Biomedical Visualisation: Volume 2, pages 137–162, 2019.
- [17] Tea Sinik, Iris Beerepoot, and Hajo A. Reijers. A peek into the working day: Comparing techniques for recording employee behaviour. In Research Challenges in Information Science: Information Science and the Connected World – 17th International Conference, RCIS 2023, volume 476 of Lecture Notes in Business Information Processing, pages 343–359. Springer, 2023.
- [18] Marit Sirgmets, Fredrik Milani, Alexander Nolte, and Taivo Pungas. Designing process diagrams – A framework for making design choices when visualizing process mining outputs. In Hervé Panetto, Christophe Debruyne, Henderik A. Proper, Claudio Agostino Ardagna, Dumitru Roman, and Robert Meersman, editors, OTM, volume 11229 of Lecture Notes in Computer Science, pages 463–480. Springer, 2018.
- [19] Wil M. P. van der Aalst. The application of petri nets to workflow management. Journal of Circuits, Systems, and Computers, 8(1):21–66, 1998.
- [20] Wil M. P. van der Aalst. Process Mining – Data Science in Action, Second Edition. Springer, 2016.
- [21] Wil M. P. van der Aalst. Foundations of process discovery. In Wil M. P. van der Aalst and Josep Carmona, editors, Process Mining Handbook, volume 448 of Lecture Notes in Business Information Processing, pages 37–75. Springer, 2022.
- [22] Wil M. P. van der Aalst and Josep Carmona, editors. Process Mining Handbook, volume 448 of Lecture Notes in Business Information Processing. Springer, 2022.
- [23] Moe Thandar Wynn, Julian Lebherz, et al. Rethinking the input for process mining: Insights from the XES survey and workshop. In Jorge Munoz-Gama and Xixi Lu, editors, ICPM workshops, volume 433 of Lecture Notes in Business Information Processing, pages 3–16. Springer, 2021.
4.3 Comprehension Metrics for Process Mining Visualizations
Axel Buehler (Olympus – Hamburg, DE), Irit Hadar (University of Haifa, IL), Monika Malinova Mandelburger (Wirtschaftsuniversität Wien, AT), Andrea Marrella (Sapienza University of Rome, IT), Silvia Miksch (TU Wien, AT), and Shazia Sadiq (University of Queensland – Brisbane, AU)
License: Creative Commons BY 4.0 International license © Axel Buehler, Irit Hadar, Monika Malinova Mandelburger, Andrea Marrella, Silvia Miksch, and Shazia Sadiq
The working group explores the evaluation of visualizations in process mining. Process mining is a valuable tool for analyzing and improving business processes based on event logs (event sequences). Our approach emphasizes the cognitive load involved in the process of process mining and the need for effective visualizations to support analysts in solving process mining tasks. The research question addressed is: What comprehension metrics can be used to evaluate visualizations for process mining tasks? The ICE-T hierarchical evaluation framework is selected as a starting point towards adapting its metrics for the process mining domain. We outline the methodological approach, including the selection of process mining tasks and the use of the ICE-T framework for evaluation. We perform the evaluation using the Disco process mining software and the road traffic fine management process data set. We conclude with the first prototypical evaluation results, highlighting the need for customization and validation of the ICE-T metrics for the process mining domain and outlining future steps for this research.
4.3.1 Motivation and Introduction
Process mining enables process analysts to provide insights into the business processes of organizations. Process mining tools use event logs as data inputs in order to make sense of the organization’s processes. An event log includes data that has been generated by various systems within an organization. Process mining aims to discover, analyze, monitor and ultimately improve business processes, all based on the event log. The process of process mining is a highly interactive process. The general aim faced by analysts is to make sense of the process data, where the data serves as the input coming from the external world. This sense-making process entails an iterative cycle of data exploration toward revealing insights about the process investigated. This process entails a high cognitive load, and as such it requires high cognitive effort. Process analysts are supported by tools that enable the generalization of various visualizations of the business processes as they are executed in real time. Appropriate visualization can reduce cognitive load, and in fact serve as an extended cognition mechanism supporting and enhancing the cognitive process [11].
However, for a visualization to enable this cognitive benefit, we need to ensure that it is a good fit for both the task and the user. We therefore ask the following research question: What comprehension metrics can be used for effectively evaluating visualizations for solving process mining tasks?
In order to answer this question, we looked for relevant metrics from the field of visualization and visual analytics, and found the ICE-T hierarchical evaluation framework for evaluating visualizations as a good starting point. Our aim is to adapt this framework for the process mining domain and validate it as reliable metrics for evaluating the comprehension of a process mining visualizations.
4.3.2 Methodological Approach
4.3.2.1 Selected Tasks in Process Mining
As one result of the co-operation between the process mining and visual analytics communities, we require a reference evaluation framework for typical tasks performed in the context of a process mining analysis to be available for general use. Our aim for the preliminarily selected evaluation framework was therefore to adapt it to the context of process mining, i.e., a process analyst solving specific process mining tasks. Accordingly, we needed to select tasks suitable for initial testing of the suitability of the selected evaluation framework.
As this reference framework is not yet available, we reviewed and brainstormed typical tasks of a process analyst by walking through a prototypical analysis session, enriched by typical visual analysis tasks performed while designing solutions for users applicable to the process mining use case.
Typical tasks we identified are:
-
Check the quality of the event log during the generation and refinement thereof.
-
Detect and communicate the core structure of the process, i.e. its most frequent paths, number of cases, events, and aggregated metrics for time passing between events.
-
Detect potential issues in the process (e.g., loops, non-conformance, bottlenecks, long waiting times, outliers).
-
Explore if the presence of a certain activity correlates with a change in throughput time.
-
Identify differing process behavior within a given event log, e.g.,
-
–
by clustering traces or variants by various case attributes or variant features
-
–
by exploring the data set to detect attributes that potentially derive segmentation
-
–
-
Detect, explore, understand causes and consequences of observed process behavior
There are various existing theories and comprehension metrics for evaluating different types of visualizations:
-
Cognitive Load Theory: The construct representing the mental effort that, when a learner performs a particular task, imposes itself on the learner’s cognitive system.
-
Cognitive Fit Theory: The visualization should fit the task at hand. It provides an explanation for performance differences among users across different presentation formats of information.
-
Physics of Notation: Provides principles for modeling notations to be easily understood by their users. It highlights the semantic understanding of the symbols forming the notation.
-
Representation Theory: Diagrams are better than sentential representations in terms of information comprehension and inferencing.
-
Split-attention Effect: Split-source information can generate a heavy cognitive load in the process of information assimilation.
-
The ICE-T: A Heuristic Approach to Value-Driven Evaluation of Visualizations/Visual Analytics approaches.
As a starting point, we selected one of the tasks for prototypical evaluation using the ICE-T framework, as detailed in Section 3.
4.3.2.2 ICE-T Framework
For our evaluation, we used a heuristic-based evaluation methodology, called ICE-T. ICE-T is a hierarchical value framework consisting of four components (i.e., metrics): insight, time, essence, and confidence. Each component includes a guideline, which describes important aspects of the high-level component. Each guideline is then comprised of a small set of low-level heuristics that are designed to be actionable, rate-able statements reflecting how a visualization achieves that guideline. Evaluators who have knowledge of visualization and visual analytics should assess the design with respect to these heuristics (using 7-point Likert scale: 1-strongly disagree to 7-strongly agree, or N/A-not applicable). The component scores are a simple average of the associated mid-level guideline scores, and the mid-level guideline scores are a simple average of the ratings for the low-level heuristics. According to the ICE-T guidelines, five experts are sufficient and a visualization design is successful when the mean score exceeds five.
4.3.2.3 Data Set and Process Mining Tool: Analysis of the Road Traffic Fine Management Process in Disco
The data set used to perform the prototypical evaluation is derived from the management of road-traffic violations by the Italian local police and the information system used for this purpose. The process begins with the “Create Fine” transition, and offenders can pay the fine partially or in full at different stages. If the entire amount is paid or overpaid, the fine management is closed. Notifications and penalties are involved if the offender fails to pay within a certain period. Appeals can be made, and if successful, the process ends. Otherwise, the case proceeds with the “Receive Result” step. If the offender still does not pay, the case may be handed over for credit collection. See [8] for a detailed discussion of the data set. The data set is publicly available (https://data.4tu.nl/articles/_/12683249/1)
4.3.3 First Prototypical Evaluation of ICE-T
To evaluate the effectiveness of process mining visualizations for solving process mining tasks, we first had to think of tasks that are typically solved by process analysts when using process mining, as well as the various visualizations generated by the different process mining tools. As one of the most typical uses of process mining is process discovery, we decided to take one of the most common process discovery tasks “Discover the most frequent process path” as a starting point. The process mining visualization that is mostly used by a process analyst to perform this task is the directly-follows graph (DFG). The DFG generated from the above-mentioned data set is shown in Fig. 4 and has been generated using the process mining tool Disco. We used the customized ICE-T comprehension metrics to evaluate the effectiveness of the DFG with regard to the task of discovering the most frequent process path. Five experts evaluated the DFG visualization using the four components of the ICE-T framework. From the five experts, one is a process mining practitioner, and four are researchers. The four researchers come from the process mining, conceptual modeling, and visual analytics disciplines.
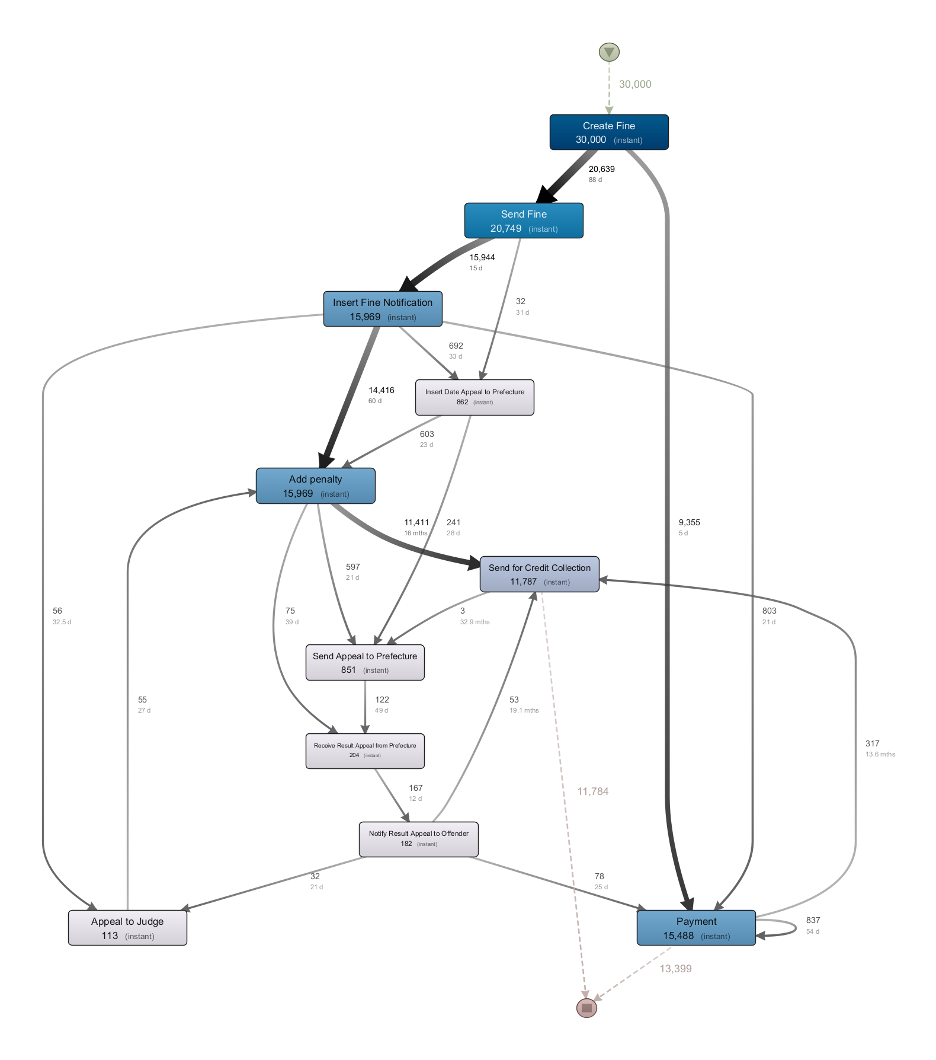
As a first step, each expert evaluated the DFG from Figure 4 individually. The ICE-T framework uses a 7-point Likert scale. After the individual evaluations were done, the five experts discussed their perceived understanding of the heuristics listed for each ICE-T component, as well as the difficulty to evaluate each of the heuristics against the DFG. As a result, we were able to identify two aspects that should be modified in order to fit the purpose of evaluating process mining visualizations for solving process mining tasks. The first aspect is with regard to the terminology used to describe the heuristics. Certain terms from the visual analytics community share the same semantics but are referred to differently in the process mining community. For example, “data case” in visual analytics is referred to a “process trace” in the process mining community. Therefore, we had to reformulate the terminology into the terminology used and understood by process mining analysts. Second, we found that some heuristics should be split into two heuristics, because the heuristic includes two different concepts that might lead to different evaluations of the same heuristic. We split such composed heuristics into two separate heuristics.
4.3.4 Next Steps
The next steps for continuing this research stream are:
-
Fully customize the ICE-T metrics for the process mining domain
-
Validate the customized ICE-T (prototypical)
-
–
Select existing process mining tasks
-
–
Select existing and emerging visualizations from the other Working Groups of the Dagstuhl seminar to support the process mining tasks
-
–
Conduct the ICE-T survey for each task and visualization with 5 process mining experts
-
–
-
Prepare a vision/research paper
-
Generalize the customized ICE-T (experiment)
References
- [1] Palash Bera. Does cognitive overload matter in understanding bpmn models? J. Comput. Inf. Syst., 52(4):59–69, 2012.
- [2] Christian Bors. Facilitating data quality assessment utilizing visual analytics: tackling time, metrics, uncertainty, and provenance. PhD thesis, Wien, 2019.
- [3] Matthew Brehmer and Tamara Munzner. A multi-level typology of abstract visualization tasks. IEEE Trans. Vis. Comput. Graph., 19(12):2376–2385, 2013.
- [4] Davide Ceneda, Natalia V. Andrienko, Gennady L. Andrienko, Theresia Gschwandtner, Silvia Miksch, Nikolaus Piccolotto, Tobias Schreck, Marc Streit, Josef Suschnigg, and Christian Tominski. Guide me in analysis: A framework for guidance designers. Comput. Graph. Forum, 39(6):269–288, 2020.
- [5] Tianwa Chen, Shazia W. Sadiq, and Marta Indulska. Sensemaking in dual artefact tasks – the case of business process models and business rules. In Gillian Dobbie, Ulrich Frank, Gerti Kappel, Stephen W. Liddle, and Heinrich C. Mayr, editors, Conceptual Modeling – 39th International Conference, ER 2020, Vienna, Austria, November 3-6, 2020, Proceedings, volume 12400 of Lecture Notes in Computer Science, pages 105–118. Springer, 2020.
- [6] Lei Han, Tianwa Chen, Gianluca Demartini, Marta Indulska, and Shazia W. Sadiq. On understanding data worker interaction behaviors. In Jimmy X. Huang, Yi Chang, Xueqi Cheng, Jaap Kamps, Vanessa Murdock, Ji-Rong Wen, and Yiqun Liu, editors, Proceedings of the 43rd International ACM SIGIR conference on research and development in Information Retrieval, SIGIR 2020, Virtual Event, China, July 25-30, 2020, pages 269–278. ACM, 2020.
- [7] Monika Malinova and Jan Mendling. Cognitive diagram understanding and task performance in systems analysis and design. MIS Q., 45(4):2101–2158, 2021.
- [8] Felix Mannhardt, Massimiliano de Leoni, Hajo A. Reijers, and Wil M. P. van der Aalst. Balanced multi-perspective checking of process conformance. Computing, 98(4):407–437, 2016.
- [9] Jan Mendling, Mark Strembeck, and Jan Recker. Factors of process model comprehension – findings from a series of experiments. Decis. Support Syst., 53(1):195–206, 2012.
- [10] Daniel L. Moody. The “physics” of notations: Toward a scientific basis for constructing visual notations in software engineering. IEEE Trans. Software Eng., 35(6):756–779, 2009.
- [11] Albert Newen, Shaun Gallagher, and Leon De Bruin. 4e cognition: Historical roots, key concepts, and central issues. 2018.
- [12] Jan Recker and Alexander Dreiling. Does it matter which process modelling language we teach or use? an experimental study on understanding process modelling languages without formal education. ACIS 2007 Proceedings, page 45, 2007.
- [13] Hajo A. Reijers, Jan Mendling, and Remco M. Dijkman. Human and automatic modularizations of process models to enhance their comprehension. Inf. Syst., 36(5):881–897, 2011.
- [14] Emily Wall, Meeshu Agnihotri, Laura E. Matzen, Kristin Divis, Michael Haass, Alex Endert, and John T. Stasko. A heuristic approach to value-driven evaluation of visualizations. IEEE Trans. Vis. Comput. Graph., 25(1):491–500, 2019.
- [15] Wei Wang, Tianwa Chen, Marta Indulska, Shazia Wasim Sadiq, and Barbara Weber. Business process and rule integration approaches – an empirical analysis of model understanding. Inf. Syst., 104:101901, 2022.
- [16] Shaochen Yu, Tianwa Chen, Lei Han, Gianluca Demartini, and Shazia Sadiq. Dataops-4g: On supporting generalists in data quality discovery. IEEE Trans. Knowl. Data Eng., 35(5):4668–4681, 2023.
4.4 Multi-Faceted Process Visual Analytics
Stef Van den Elzen (TU Eindhoven, NL), Mieke Jans (Hasselt University, BE), Christian Tominski (Universität Rostock, DE), Sebastiaan Johannes van Zelst (Celonis Labs GmbH – München, DE), and Mari-Cruz Villa-Uriol (University of Sheffield, GB)
License: Creative Commons BY 4.0 International license © Stef Van den Elzen, Mieke Jans, Christian Tominski, Sebastiaan Johannes van Zelst, and Mari-Cruz Villa-Uriol
As the application of process mining is becoming more relevant and is being used in a broader context, there is a need for new interactive visual representations that are better focused and use-case specific. For example, the recent object-focused refinement of event data, i.e., often referred to as object-centric process mining, defines a multi-dimensional process perspective, requiring corresponding interactive multi-dimensional visual representations. However, the design process of existing process mining visualizations is relatively unstructured and not well-studied. As such, the working group has focused on investigating and developing a conceptual categorization that facilitates a structured design process of multidimensional visual process mining artifacts grounded in multi-faceted visual analytics design [4, 3]. The working group has mapped existing process mining visualizations onto well-established facets from the domain of visual analytics. Correspondingly, blind-spots and opportunities (e.g., by means of combining novel facets) have been identified. Furthermore, the categorization enables a more structured approach to exploring and designing new visual representations.
4.4.1 Multi-Faceted Visual Analytics
In order to arrive at a well-balanced multi-faceted representation, it makes sense to follow a two-step design procedure [9]. First, a base representation has to be defined for the primary data facet whose depiction will govern the overall display. In alignment with the effectiveness principle [5], the most powerful visual variables should be used for the primary facet (usually, this means mapping the primary facet to the visual variable of position). Second, the additional data facet(s) will be incorporated into the base representation using further visual channels (e.g., color, size, orientation, or shape). In the next section, we describe the categorization of data facets applicable to process mining artifacts.
4.4.2 Data Facets
A wide variety of facets is identifiable in process mining, where the relevance of a facet as a driving force for a visual design largely depends on the perspective from which users need to look at their data. In general, there are key facets to be considered (in some cases to be refined hierarchically) according to the visual analytics literature. We mostly discussed the following facets inspired by [3] and [9] (see Figure 6):
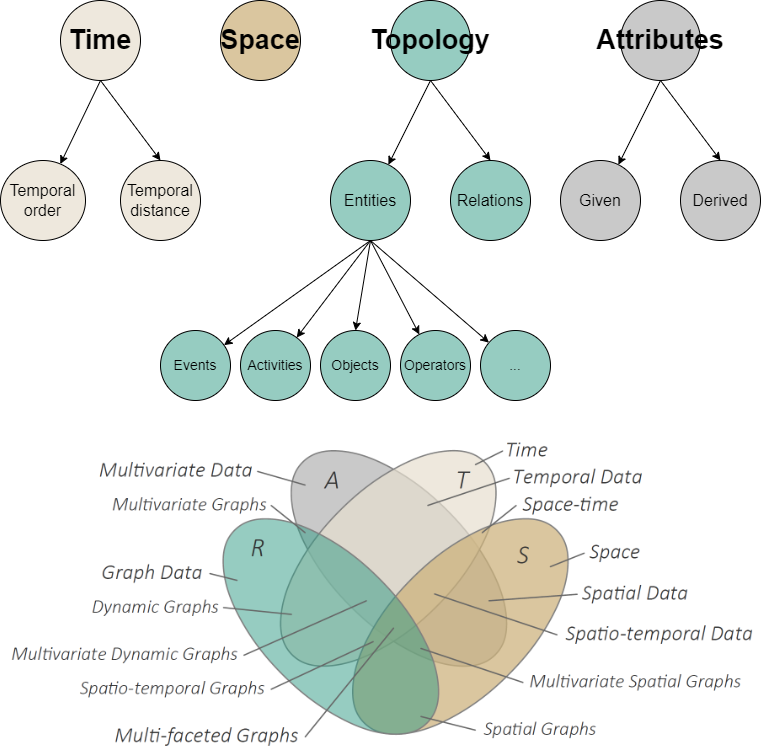
Note that some entities, e.g., activities and objects, can also act as a given attribute. To distinguish between these roles in existing visual representations of process mining data and models, we studied the use of marks and visual channels, as the information-bearing building blocks in visualization idioms. Data that are explicitly represented as marks are interpreted as entities. If data are encoded using visual channels, we interpret them as attributes.
4.4.3 A Faceted View on Existing PM Visualizations
To develop a common understanding of existing process mining visualizations, we worked on a categorization that assigns to commonly used visual designs the data facets that they represent. In addition to the visualization-facet mapping, we also cover the marks and visual channels for selected examples:
-
Dotted chart (scatter plot)
-
–
Primary facet: Time
-
–
Additional facets: Topology (entities – events) and Attributes
-
–
Mark: Event dot
-
–
Visual channel: Activity color
-
–
-
Performance spectrum (Marey’s diagram)
-
–
Primary facet: Time (temporal order)
-
–
Additional facets: Time (temporal distance) and Attributes
-
–
Mark: Derived Attributes (temporal distance of two events) line
-
–
Visual channel: end-point positioning color
-
–
-
Maps
-
–
Primary facet: Space
-
–
Additional facets: Attribute
-
–
-
Frequency diagrams (basic charts)
-
–
Primary facet: Attribute
-
–
Additional facets: anything
-
–
-
Variant diagrams
-
–
Primary facet: Time (temporal order)
-
–
Additional facets: Topology (entities – activities) and Attributes
-
–
-
Process matrix
-
–
Primary facet: Topology (relations)
-
–
Additional facets: Attribute
-
–
-
Directly-Follow Graphs
-
–
Primary facet: Time (temporal order)
-
–
Additional facets: Topology (relations – activities) and Attributes
-
–
-
BPMN
-
–
Primary facet: Time (temporal order)
-
–
Additional facets: Topology (relations – activities and operators) and Attributes
-
–
-
Petri Nets
-
–
Primary facet: Time (temporal order)
-
–
Additional facets: Topology (relations – activities and operators) and Attributes
-
–
-
Process Trees
-
–
Primary facet: Time (temporal order)
-
–
Additional facets: Topology (relations – activities and operators) and Attributes
-
–
-
Object-Centric Petri Nets
-
–
Primary facet: Time (temporal order)
-
–
Additional facets: Topology (relations – activities and operators) and Attributes (objects)
-
–
4.4.4 Discussion
From the existing process mining visual representations classified according to the earlier defined categorization, we observed the following:
-
Time tends to be the primary facet, mostly focusing on temporal order.
-
Space is rarely included in visual representations as a data facet.
-
Attribute as a primary facet is only used in basic charts; more complex advanced multivariate visualizations are not used (e.g., scatterplot-matrix, parallel-coordinate plot, glyph-based approaches).
-
BPMN, Petri Nets, and Process trees all use the same facets from a data visualization point of view, although they use different semantics.
-
In contrast to the other process modeling languages, DFGs do not have operators that can be used as a mark.
-
Current object-centric process mining maps use the most important element, object, only as a visual channel: if color is removed, it can be considered a traditional Petri Net.
Based on the identified facets and observations, we plan to condense our work into a journal publication. The publication is intended to present the following contributions.
-
1.
Propose a multi-faceted framework for the categorization of PM visualizations
-
2.
Categorization of existing process mining visualizations
-
3.
Identification of blind spots and challenges in PM visualizations
-
4.
Outline opportunities how to enhance PM with interactivity and analytical abstractions
As defined in Munzner [5], visual idioms are described with Data, Marks, Visual Channels, and Tasks. With the Facets from the categorization, we cover the Data element. Furthermore, we identify for each of the existing visual process mining representations the Marks and Visual Channels. We did not cover the Tasks in our working group as this was the topic of working group Group 6: Task taxonomies in process mining and visual analytics. By combining the results of both working groups, we can ultimately construct novel visual representations for specific process mining tasks.
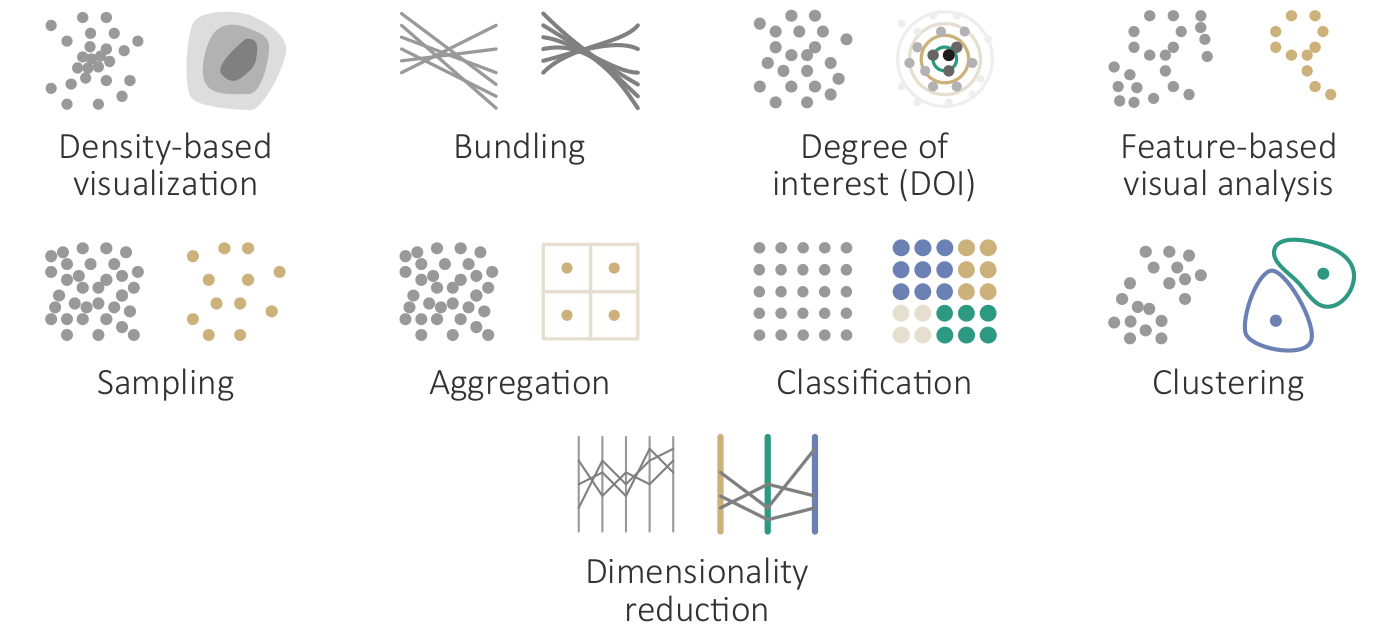
The working group also discussed the importance of analytical abstractions and interactivity for advancing existing process mining practices. The visual analytics community provides helpful categorizations of analytical abstractions (see Figure 7), which basically can be applied to each data facet. This would be something to be considered in future work. Similarly, interaction techniques such as view coordination [1], focus+context [2], interactive lenses [8], interactive comparison [7], or dynamic view adaptations [6] would be helpful to integrate into existing process mining tools.

References
- [1] Michelle Q. Wang Baldonado, Allison Woodruff, and Allan Kuchinsky. Guidelines for using multiple views in information visualization. In Vito Di Gesù, Stefano Levialdi, and Laura Tarantino, editors, Proceedings of the working conference on Advanced visual interfaces, AVI 2000, Palermo, Italy, May 23-26, 2000, pages 110–119. ACM Press, 2000.
- [2] Andy Cockburn, Amy K. Karlson, and Benjamin B. Bederson. A review of overview+detail, zooming, and focus+context interfaces. ACM Comput. Surv., 41(1):2:1–2:31, 2008.
- [3] Steffen Hadlak, Heidrun Schumann, and Hans-Jörg Schulz. A Survey of Multi-faceted Graph Visualization. In EuroVis State of the Art Reports, pages 1–20. Eurographics Association, 2015.
- [4] Johannes Kehrer and Helwig Hauser. Visualization and visual analysis of multifaceted scientific data: A survey. IEEE Trans. Vis. Comput. Graph., 19(3):495–513, 2013.
- [5] Tamara Munzner. Visualization Analysis and Design. A K Peters/CRC Press, 2014.
- [6] Christian Tominski, Gennady Andrienko, Natalia Andrienko, Susanne Bleisch, Sara Irina Fabrikant, Eva Mayr, Silvia Miksch, Margit Pohl, and André Skupin. Toward Flexible Visual Analytics Augmented through Smooth Display Transitions. Visual Informatics, 5(3):28–38, 2021.
- [7] Christian Tominski, Camilla Forsell, and Jimmy Johansson. Interaction Support for Visual Comparison Inspired by Natural Behavior. IEEE Transactions on Visualization and Computer Graphics, 18(12):2719–2728, 2012.
- [8] Christian Tominski, Stefan Gladisch, Ulrike Kister, Raimund Dachselt, and Heidrun Schumann. Interactive Lenses for Visualization: An Extended Survey. Computer Graphics Forum, 36(6):173–200, 2017.
- [9] Christian Tominski and Heidrun Schumann. Interactive Visual Data Analysis. AK Peters Visualization Series. CRC Press, 2020.
4.5 Visualization for Conformance Checking
Tatiana von Landesberger (Universität Köln, DE), Jan Mendling (HU Berlin, DE), Giovanni Meroni (Technical University of Denmark – Lyngby, DK), Luise Pufahl (TU München – Heilbronn, DE), and Jana-Rebecca Rehse (Universität Mannheim, DE)
License: Creative Commons BY 4.0 International license © Tatiana von Landesberger, Jan Mendling, Giovanni Meroni, Luise Pufahl, and Jana-Rebecca Rehse
4.5.1 Introduction
Process mining defines a set of techniques that take event sequence data in the form of event logs as an input in order to produce evidence-based insights into the execution of business processes. Different groups of techniques are distinguished, including automatic process discovery, conformance checking, enhancement, performance analysis, or deviance analysis [10, 3]. Conformance checking is of particular importance in this context. It allows analysts to investigate to which extent observed event sequences deviate from normative process models and which behavior constraints are violated. This can for example be used for compliance checking to check how far the execution of business processes complies with certain regulations, such as the General Data Protection Regulation (GDPR) or clinical guidelines.
The current practice of conformance checking builds on functionality implemented in professional process mining tools. These tools, in essence, support basic conformance checking tasks: They allow users to (i) quantify the conformance of a process, (ii) compare the conformance values of, e.g., different locations, (iii) localize the specific deviations in a process [6], and (iv) explaining those deviations by means of external factors [8]. Hence, we observe that support for conformance checking has been implemented in various ways. So far, research has not investigated which of the various approaches are most effective for analysts in order to fulfill their tasks. Overall, much of conformance checking research has been driven by technical challenges of efficiently calculating alignments between event sequences and process models [2], defining precision and fitness measures with sound formal properties [7], and providing feedback to business users who are not familiar with formal concepts [4].
In general, research on process mining can be framed at different levels [11]. Empirical research has been conducted at the level of organizational anchoring and impact [1] but mostly abstracted from the analyst as a user. What is by and large missing is a research strategy that considers the tasks and user characteristics as a focus of conformance checking research [5]. More specifically, several research questions miss specific answers from empirical and engineering research on process conformance checking, including the following.
-
What kind of characteristics do the users have?
-
Which are the conformance checking tasks?
-
What data is required for each of the tasks?
-
Which techniques can be used for specific tasks? What is missing?
-
What are the functional/non-functional requirements of the systems?
-
Which are effective conformance checking algorithms for the tasks?
-
Which are effective visualizations for the conformance checking tasks?
-
How to design an effective interaction between the conformance checking algorithms and visualizations?
-
How to support annotations and editing to the original data?
-
How to support decision-making and actions (i.e., implement interventions) in the real world?
-
How to cope with updates of the real world in the conformance checking visualization system?
This report presents the discussion of the working group on conformance checking of the Dagstuhl Seminar 23271 on “Human in the (Process) Mines”, held at Schloss Dagstuhl on 2–7 July 2023. We conclude by summarizing a set of action points that our working group identified.
4.5.2 Discussions of the Working Group
As a first step, the working group identified the limitations of current visualization techniques adopted by conformance checking tools. It emerged that deviations are often not represented in an effective way that stands out from the normal execution flow. This is typically caused by a gap between visualization producers, users who create the graphical notations, and visualization consumers, users who have to interpret the graphical notation.
The working group then discussed the typical workflow that visual analytics researchers adopt to address these issues [9]. This typically consists in involving domain experts to identify what kind of tasks (actions) that they need to perform to obtain insights. Then conformance checking techniques able to address these tasks are adopted or developed, which then produce output data. Models and visuals will then be built to effectively represent output data. Finally, the visual representation will be checked by domain experts to see if they are effective for accomplishing their tasks, what is missing, and what can be improved.
Following this workflow, the working group analyzed different application domains in which they had direct experience (e.g., by previous research projects) in order to identify the tasks (actions) that the user need to perform to obtain insights on the compliance of its processes. From this analysis, it emerged that, for auditing purposes, it is more relevant to produce a list of cases that caused a deviation and see their impact. If one has a large number of deviations, these need to be grouped into classes. The hypothesis in conformance checking is that if the trace is the same, then they have the same meaning. However, information on resources, data, etc, is currently missing.
This lead to the definition of which information should be the input for a system combining visual analytics with conformance checking, and which interactions with the domain expert this system should support (see Fig. 9).
To apply conformance checking one needs to create a model from regulations and norms, and an event log from information on a database or other data sources. The model can use different formalisms (DFG, BPMN, Declare, etc.), and the logs can be at different levels (task execution, task start/complete, changes in data, etc). Then, the outcome of conformance checking would be deviations. Deviations are grouped in harmful/not harmful, variants, or having additional or missing activities. They are then typically qualified based on risk by domain experts, and quantified by computing measures from the types. Then, deviations are explained. Qualifying, Quantifying and Grouping can be performed multiple times.
Thank to conformance checking, one can perceive how the actual process is performed, then make sense of process-related information, which leads to data-driven decision making, that can eventually lead to implementing interventions on the process.
VA can 1) apply an algorithm and then visualize the results: you choose the algorithm and visualize/interact only with the output. 2) Interact in a cyclic behavior: after observing the result, parameters are changed and the algorithm is rerun. 3) computational steering: while the algorithm is running one changes the parameters and adjusts on-the-fly what is happening.
One can also edit VA results with annotations and corrections. Corrections directly change the data sources (e.g., fixing a wrong timestamp). Annotations highlight relevant behaviors in the data, without changing the data sources (e.g., noting that a regulation has changed, explaining why a trace is non-conformant).
Next, we discussed what input data is available and needed for proper and useful conformance checking. We identified, on the one hand, the event log or a stream of events that represents the process execution. On the other hand, we discussed that the business analyst usually does not provide a standard process model, but rather a set of rules to which the process needs to comply. This can be control flow (activity A must be followed by B), time (activity A must complete within 30 minutes), resource (activity A must be executed by the financial department), and data-related rules (activity A must produce an invoice with a fee not higher than 5000 EUR). These rules need to be formalized, such that conformance checking techniques can automatically identify deviations in the traces of an event log, the individual process executions. Sometimes, business analyst has no rules at hand, but they have hypotheses in mind about how their process should be executed and what should not happen. For such a case, the business analyst needs support in formulating hypotheses and confirming them.
4.5.3 Next steps
Our discussions this week have led us to believe that visual analytics can provide a completely new angle on process conformance, with a much stronger emphasis on the needs of the user and the tasks that conformance checking is supposed to fulfill. The working group has agreed on two immediate next steps. First, we would like to gather our newly established insights into the potential of visual analytics for the advancement of conformance checking into a workshop paper, outlining the ideas and concepts already presented in this report. Second, we would like to further develop, substantiate, and structure these ideas, with the goal of submitting a joint research proposal.
Concretely, the next steps that we want to take for the substantiation of our ideas are the following:
-
Identify additional application scenarios, such as healthcare, purchasing, infection control, ambient assisted living, or logistics, and characterize them with regard to their similarities and differences to obtain a clear set of objectives
-
Conduct an design study [9] with process analysts or process managers to verify and extend the preliminary list of tasks that conformance checking should fulfill
-
Collect and analyze process-related regulations to develop a better understanding of the different types of rules that business processes are subject to
-
Analyze existing visualizations of timed event sequence data, such as [12], from the VA domain to find out which functionalities they already provide
References
- [1] Peyman Badakhshan, Bastian Wurm, Thomas Grisold, Jerome Geyer-Klingeberg, Jan Mendling, and Jan Vom Brocke. Creating business value with process mining. The Journal of Strategic Information Systems, 31(4):101745, 2022.
- [2] Josep Carmona, Boudewijn van Dongen, Andreas Solti, and Matthias Weidlich. Conformance checking. Switzerland: Springer.[Google Scholar], 56, 2018.
- [3] Marlon Dumas, Marcello La Rosa, Jan Mendling, Hajo A Reijers, et al. Fundamentals of business process management, volume 2. Springer, 2018.
- [4] Luciano García-Bañuelos, Nick RTP Van Beest, Marlon Dumas, Marcello La Rosa, and Willem Mertens. Complete and interpretable conformance checking of business processes. IEEE Transactions on Software Engineering, 44(3):262–290, 2017.
- [5] Jan Mendling, Djordje Djurica, and Monika Malinova. Cognitive effectiveness of representations for process mining. In International Conference on Business Process Management, pages 17–22. Springer, 2021.
- [6] Giovanni Meroni. Artifact-Driven Business Process Monitoring – A Novel Approach to Transparently Monitor Business Processes, Supported by Methods, Tools, and Real-World Applications, volume 368 of Lecture Notes in Business Information Processing. Springer, 2019.
- [7] Artem Polyvyanyy, Andreas Solti, Matthias Weidlich, Claudio Di Ciccio, and Jan Mendling. Monotone precision and recall measures for comparing executions and specifications of dynamic systems. ACM Transactions on Software Engineering and Methodology (TOSEM), 29(3):1–41, 2020.
- [8] Jana-Rebecca Rehse, Luise Pufahl, Michael Grohs, and Lisa-Marie Klein. Process mining meets visual analytics: the case of conformance checking. In Hawaii International Conference on System Sciences, 2023.
- [9] Michael Sedlmair, Miriah Meyer, and Tamara Munzner. Design study methodology: Reflections from the trenches and the stacks. IEEE transactions on visualization and computer graphics, 18(12):2431–2440, 2012.
- [10] Wil van der Aalst. Data science in action. Springer, 2016.
- [11] Jan vom Brocke, Mieke Jans, Jan Mendling, and Hajo A Reijers. A five-level framework for research on process mining. Business & Information Systems Engineering, 63(5):483–490, 2021.
- [12] Marcel Wunderlich, Kathrin Ballweg, Georg Fuchs, and Tatiana von Landesberger. Visualization of delay uncertainty and its impact on train trip planning: A design study. In Computer Graphics Forum, volume 36, pages 317–328. Wiley Online Library, 2017.
4.6 Milana – A Task Taxonomy for Supporting Human-Centered Process Mining with Visual Analytics
Lisa Zimmermann (Universität St. Gallen, CH), Philipp Koytek (Celonis Labs GmbH – München, DE), Shazia Sadiq (University of Queensland – Brisbane, AU), Pnina Soffer (University of Haifa, IL), Katerina Vrotsou (Linköping University, SE), and Barbara Weber (Universität St. Gallen, CH)
License: Creative Commons BY 4.0 International license © Lisa Zimmermann, Philipp Koytek, Shazia Sadiq, Pnina Soffer, Katerina Vrotsou, and Barbara Weber
Process Mining is an activity that can significantly benefit from human-in-the-loop approaches. The current body of knowledge is lacking a full exploitation of opportunities that sit at the intersection of human-centered process mining activities, the various cognitive aspects of these activities, and visual ways of supporting them. To realize these opportunities we undertake a taxonomical approach to identify the key concepts and relationships across the three bodies of knowledge. The objective of the proposed taxonomy, namely Milana, is to establish a common vocabulary and shared understanding, serve as a point of reference, and inform measurements for evaluating process visualizations.
4.6.1 Introduction
Over the last two decades, process mining has developed into a collection of techniques and tools that have the potential to provide immense value to business users. Although the techniques have gained a significant level of sophistication in terms of their algorithmic approaches and outcomes, supporting the human within the process of process mining [7] has so far received little attention.
Therefore, the goal of this work is to develop a task taxonomy for supporting human-centered process mining with visual analytics.
We argue that the development of such a taxonomy, which we call Milana, needs to be guided by multiple perspectives that include process mining, visual analytics and cognitive underpinnings. The current body of knowledge is lacking a full exploitation of opportunities that sit at the intersection of human-centered process mining activities, the various cognitive aspects of these activities, and visual ways of supporting them.
We envision that Milana can provide a reference to apply a three-way mapping between analytical tasks in process mining, cognitive tasks, and visualization tasks. Such a mapping will establish a common vocabulary and contribute to a shared understanding between the different communities. Moreover, it can be leveraged to justify design choices of process visualizations, identify gaps to inform future work, and be used to inform the measurements for evaluating process visualizations.
4.6.2 Description of the theme
A taxonomy (or taxonomic classification) is a scheme of classification, especially a hierarchical classification, in which things are organized into groups or types [8]. Typically, the development of a taxonomy involves a number of steps including (i) identifying the concepts and relationships within the domain(s) of interest, (ii) establishing a nomenclature for the representation of the concepts, (iii) constructing the taxonomy using established notation (usually hierarchical), (iv) evaluating or validating it against its intended goal, and (v) setting up a mechanism for its continued maintenance.
During the seminar, we derived an approach to develop Milana. As shown in Fig 10, it consists of three steps to identify concepts and relationships of the taxonomy:
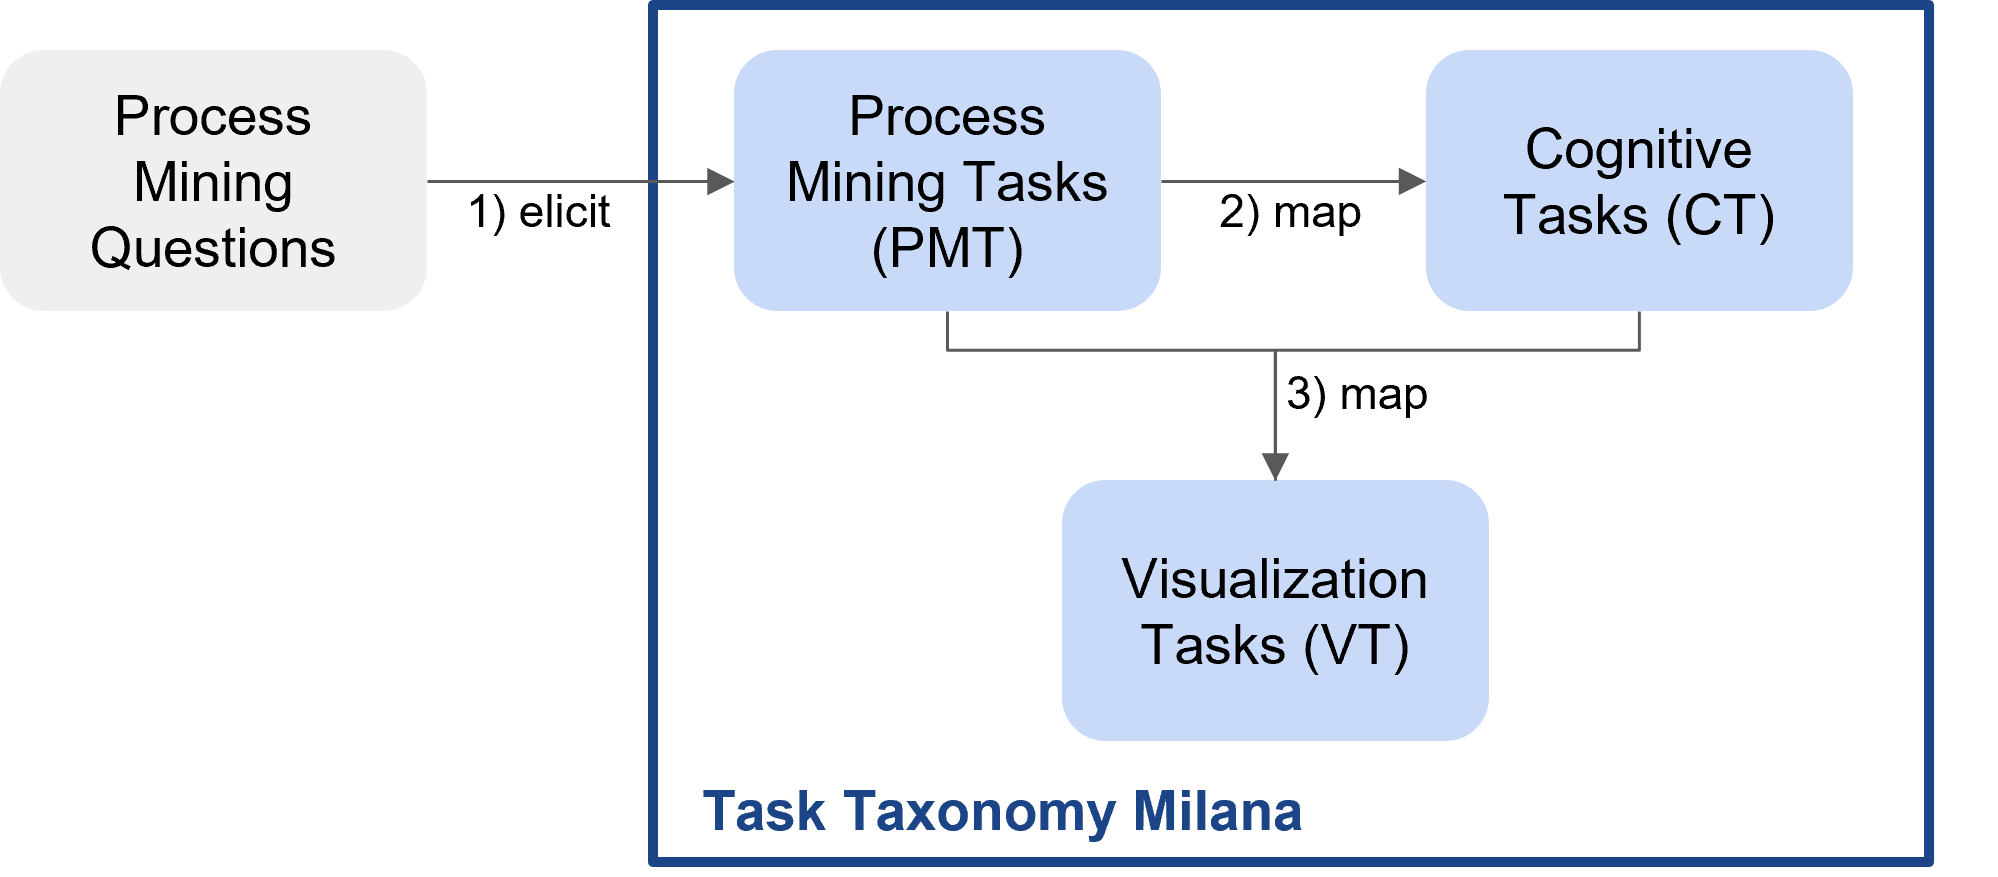
Taking these steps as a starting point, we can build on the large body of knowledge on visualization and visual analytics that gives us a proven link on relevant and most suited visual representations which is the main goal of developing Milana.
Considering that the concepts will be derived from three different bodies of knowledge, namely process mining, visual analytics and cognitive theories, establishing the nomenclature is a critical and non-trivial step and will continue to be refined as the taxonomy is further developed. The work on the taxonomy construction, validation and plan for maintenance is yet to be undertaken.
4.6.2.1 Elicit Process Mining Tasks (PMT)
The first step of our work is to elicit a comprehensive overview of process mining tasks. This requires choosing a valid source for identifying such tasks and to align on a suitable abstraction level for these tasks.
To identify tasks, we evaluated different approaches, of which the elicitation from questions seems to be the most promising one. In visual analytics literature, questions and tasks are often used as synonyms [1] and also in the process mining literature, for example Zerbato et al. [10], identified the analysis question as an important factor that determines the analysis approach (task).
As a source for process mining questions, we plan to start from the business process intelligence challenges (BPIC) published by the IEEE Task Force on Process Mining of which ten editions, dating back to 2011, exist [3]. These challenges contain real-world event logs and business questions posted by different organizations. Moreover, we can leverage out-of-the-box analyses for questions commonly asked by customers in existing process mining tools (e.g., Celonis Business Miner). These questions serve as an additional source and complement the BPIC questions.
Exemplary questions are “Are there cases that spend a very short time at Service Line 1 before being escalated?”(Source: BPIC 2013), or “How many unwanted activities are in my process?” (Source: Celonis Business Miner).
Depending on the complexity of the question it might manifest in several process mining tasks (low level of abstraction). For the first question, for example, one would need to (i) identify cases processed by service line 1, (ii) calculate the throughput time for the respective sub-process, (iii) identify what “short” refers to and derive a threshold, and (iv) count the remaining cases.
As part of the taxonomy development we aim to harmonize the tasks over the available questions until we reach saturation. For this purpose, we plan to identify the (main) operations performed to answer the question, the process mining entity that is the subject of interest (e.g. case, activity, …), its respective cardinality, and the attribute of the event log that is required to execute that operation.
4.6.2.2 Mapping to Cognitive Tasks (CT)
At this step we consider the cognitive tasks that are involved in the process of process mining [7], depicted in Fig. 11. This model relates to the individual process of process mining from a cognitive perspective where different process mining tasks may be performed iteratively. For example, conducting one or many process mining tasks may entail focusing on a part of the log, creating a process model (an artifact), exploring the model to identify “interesting” patterns, generating hypotheses which explain these patterns, applying additional analysis algorithms for testing these hypotheses, and assessing whether the result is as expected and can be used for completing the task.
Our premise is that the cognitive tasks that underpin various process mining tasks provide an important perspective on the information needs of the process analyst and are therefore relevant for the identification of suited visualizations supporting these tasks. Hence, we propose to include this perspective in the taxonomy which requires a mapping of the process mining tasks identified in the previous step (cf. Sec 4.6.2.1) to the cognitive tasks.

4.6.2.3 Mapping to Visualization Tasks (VT)
The final perspective we consider for Milana, is the mapping to the visualization task that links to the combination process mining task and cognitive task. As a starting point for this third mapping step, we surveyed the currently available taxonomies in the field of visualization and visual analytics and identified that they vary with respect to their focus and levels of abstraction. Examples include users’ interactions intents [9] and visualization usage [2, 4].
Brehmer & Munzner [2] proposed a multi-level typology of visualization tasks that attempts to specify the WHY and HOW of a visualization task that is performed. The aim of their taxonomy is to enable the expression of complex sequences of activities in terms of simpler tasks. Moreover, its focus is on a high abstraction level that is not tied to specific application domains. This allows the freedom to make comparisons between domains but also provides the opportunity to customize it for the purpose of a specific domain; which is the ambition of this working group.
To derive our approach, we draw inspiration from Rind et al. [5] who introduced a three-dimensional conceptual space for user tasks in visualization, called TaskCube. The three considered dimensions are perspective, composition, and abstraction. Perspective is concerned with the objectives of the user, corresponding to the “why” of the taxonomy by Brehmer & Munzner [2], and actions which correspond to the “how”. Composition relates to the break-down of the task from low-level, including small and concise steps, to high-level steps concerned with broader tasks. Finally, abstraction classifies tasks according to their level of abstraction from concrete to abstract.
In their work, Rind et al. [5] have classified a number of previously related taxonomies in terms of the dimensions of the TaskCube. This classification provides further motivation and guidance for our work towards a taxonomy. To this end, we intend to extend the generic visualization tasks defined by Brehmer & Munzner [2] to a more concrete abstraction level by applying it to the formulated process mining tasks (PMTs) (Sec. 4.6.2.1). In terms of the TaskCube classification this would place our proposed taxonomy on a concrete abstraction level with respect to data type (i.e. process data) and potentially also domain (e.g., “Business Processes”).
4.6.3 Outline of the Next Steps
In the future we plan to continue our work as follows.
-
1.
Concerning the identification of process mining tasks, we will continue to apply the approach to more questions that are collected from the BPICs until we reach saturation (cf. Sec. 4.6.2.1).
-
2.
For mapping the identified process mining tasks to the cognitive tasks that would be required, a critical evaluation of the relevant cognitive tasks that could guide the identification of visual representations is outstanding (cf. Sec. 4.6.2.2).
- 3.
-
4.
Finally, Milana will be validated (e.g., case studies, user studies, and experiments).
Milana will pave the way for both evaluating existing process analysis visualizations in terms of their appropriateness for the tasks as well as provide a blueprint for the design of novel visual representations.
Acknowledgments.
B. Weber and L. Zimmermann are supported by the ProMiSE project funded by the SNSF under Grant No.: 200021_197032.
References
- [1] Natalia V. Andrienko and Gennady L. Andrienko. Exploratory analysis of spatial and temporal data – a systematic approach. Springer, 2006.
- [2] Matthew Brehmer and Tamara Munzner. A multi-level typology of abstract visualization tasks. IEEE Trans. Vis. Comput. Graph., 19(12):2376–2385, 2013.
- [3] BPI Challenge. BPI Challenge. https://www.tf-pm.org/competitions-awards/bpi-challenge, 2023. [Online; accessed 25-July-2023].
- [4] Jeffrey Heer and Ben Shneiderman. Interactive dynamics for visual analysis: A taxonomy of tools that support the fluent and flexible use of visualizations. Queue, 10(2):30–55, 2012.
- [5] Alexander Rind, Wolfgang Aigner, Markus Wagner, Silvia Miksch, and Tim Lammarsch. Task cube: A three-dimensional conceptual space of user tasks in visualization design and evaluation. Inf. Vis., 15(4):288–300, 2016.
- [6] Alexander Rind, Taowei David Wang, Wolfgang Aigner, Silvia Miksch, Krist Wongsuphasawat, Catherine Plaisant, and Ben Shneiderman. Interactive information visualization to explore and query electronic health records. Found. Trends Hum. Comput. Interact., 5(3):207–298, 2013.
- [7] Elizaveta Sorokina, Pnina Soffer, Irit Hadar, Uri Leron, Francesca Zerbato, and Barbara Weber. Pem4ppm: A cognitive perspective on the process of process mining. In Business Process Management – 21th International Conference, BPM 2023. Accepted for publication.
- [8] Wikipedia, the free encyclopedia. Taxonomy. https://en.wikipedia.org/wiki/Taxonomy, 2023. [Online; accessed 25-July-2023].
- [9] Ji Soo Yi, Youn ah Kang, John T. Stasko, and Julie A. Jacko. Toward a deeper understanding of the role of interaction in information visualization. IEEE Trans. Vis. Comput. Graph., 13(6):1224–1231, 2007.
- [10] Francesca Zerbato, Pnina Soffer, and Barbara Weber. Process mining practices: Evidence from interviews. In Claudio Di Ciccio, Remco M. Dijkman, Adela del-Río-Ortega, and Stefanie Rinderle-Ma, editors, Business Process Management – 20th International Conference, BPM 2022, Münster, Germany, September 11-16, 2022, Proceedings, volume 13420 of Lecture Notes in Computer Science, pages 268–285. Springer, 2022.
5 Participants
-
Wolfgang Aigner – FH – St. Pölten , AT
-
Anti Alman – University of Tartu, EE
-
Alessio Arleo – TU Wien, AT
-
Iris Beerepoot – Utrecht University, NL
-
Axel Buehler – Olympus – Hamburg, DE
-
Andrea Burattin – Technical University of Denmark – Lyngby, DK
-
Claudio Di Ciccio – Sapienza University of Rome, IT
-
Chiara Di Francescomarino – University of Trento, IT
-
Irit Hadar – University of Haifa, IL
-
Mieke Jans – Hasselt University, BE
-
Philipp Koytek – Celonis Labs GmbH – München, DE
-
Monika Malinova Mandelburger – Wirtschaftsuniversität Wien, AT
-
Andrea Marrella – Sapienza University of Rome, IT
-
Jan Mendling – HU Berlin, DE
-
Giovanni Meroni – Technical University of Denmark – Lyngby, DK
-
Silvia Miksch – TU Wien, AT
-
Luise Pufahl – TU München – Heilbronn, DE
-
Jana-Rebecca Rehse – Universität Mannheim, DE
-
Manuel Resinas – University of Sevilla, ES
-
Shazia Sadiq – University of Queensland – Brisbane, AU
-
Daniel Schuster – Fraunhofer FIT – Sankt Augustin, DE
-
Pnina Soffer – University of Haifa, IL
-
Christian Tominski – Universität Rostock, DE
-
Cagatay Turkay – University of Warwick – Coventry, GB
-
Stef Van den Elzen – TU Eindhoven, NL
-
Sebastiaan Johannes van Zelst – Celonis Labs GmbH – München, DE
-
Mari-Cruz Villa-Uriol – University of Sheffield, GB
-
Tatiana von Landesberger – Universität Köln, DE
-
Katerina Vrotsou – Linköping University, SE
-
Barbara Weber – Universität St. Gallen, CH
-
Francesca Zerbato – Universität St. Gallen, CH
-
Lisa Zimmermann – Universität St. Gallen, CH
![[Uncaptioned image]](x3.jpg)