Low-Dimensional Embeddings of High-Dimensional Data: Algorithms and Applications
Abstract
This report documents the program and the outcomes of Dagstuhl Seminar “Low-Dimensional Embeddings of High-Dimensional Data: Algorithms and Applications” (24122). Low-dimensional embeddings are widely used for unsupervised data exploration across many scientific fields, from single-cell biology to artificial intelligence. These fields routinely deal with high-dimensional characterization of millions of objects, and the data often contain rich structure with hierarchically organized clusters, progressions, and manifolds. Researchers increasingly use 2D embeddings (t-SNE, UMAP, autoencoders, etc.) to get an intuitive understanding of their data and to generate scientific hypotheses or follow-up analysis plans. With so many scientific insights hinging on these visualizations, it becomes urgent to examine the current state of these techniques mathematically and algorithmically.
This Dagstuhl Seminar brought together machine learning researchers working on algorithm development, mathematicians interested in provable guarantees, and practitioners applying embedding methods in biology, chemistry, humanities, social science, etc. The aim of the seminar was to (i) survey the state of the art; (ii) identify critical shortcomings of existing methods; (iii) brainstorm ideas for the next generation of methods; and (iv) forge collaborations to help make these a reality.
Keywords and phrases:
dimensionality reduction, high-dimensional, visualizationSeminar:
March 17–22, 2024 – https://www.dagstuhl.de/241222012 ACM Subject Classification:
Computing methodologies Machine learningCopyright and License:
![[Uncaptioned image]](x1.png) Except where otherwise noted, content of this report is licensed under a
Creative Commons BY 4.0 International license
Except where otherwise noted, content of this report is licensed under a
Creative Commons BY 4.0 International license
1 Executive Summary
Dmitry Kobak (Universität Tübingen, DE)
Sebastian Damrich (Universität Tübingen, DE)
Fred A. Hamprecht (Universität Heidelberg, DE)
Smita Krishnaswamy (Yale University – New Haven, US)
Gal Mishne (University of California, San Diego – La Jolla, US)
License: ![[Uncaptioned image]](x2.png) Creative Commons BY 4.0 International license © Dmitry Kobak, Sebastian Damrich, Fred A. Hamprecht, Smita Krishnaswamy, and Gal Mishne
Creative Commons BY 4.0 International license © Dmitry Kobak, Sebastian Damrich, Fred A. Hamprecht, Smita Krishnaswamy, and Gal Mishne
2D embeddings in science
In recent years, high-dimensional “big” data have become commonplace in multiple academic fields. To give some examples, single-cell transcriptomics routinely produces datasets with sample sizes in hundreds of thousands and dimensionality in tens of thousands [1]; single-cell mass spectrometry deals with millions of samples [2]; genomic datasets quantifying single-nucleotide polymorphisms can deal with many millions of features [3]; behavioural physiology produces high-dimensional datasets with tens of thousands of samples [4]. In neuroscience, calcium imaging allows to record time-series activity of thousands of neurons. Many scientific fields that traditionally did not have to deal with high-dimensional data analysis now face similar challenges; for example, a digital library can yield a dataset with tens of millions of samples and hundreds, if not millions, of features [5].
Such datasets require adequate computational methods for data analysis, including unsupervised data exploration. In fact, exploratory statistical analysis has become an essential tool in many scientific disciplines, allowing researchers to compactly visualise, represent and make sense of their data. It became commonplace to explore low-dimensional embeddings of the data, generated by methods like t-SNE [6] or UMAP [7]. Such visualisation has proven to be a valuable tool for exploring the data, performing quality control, and generating scientific hypotheses (Figure 1).
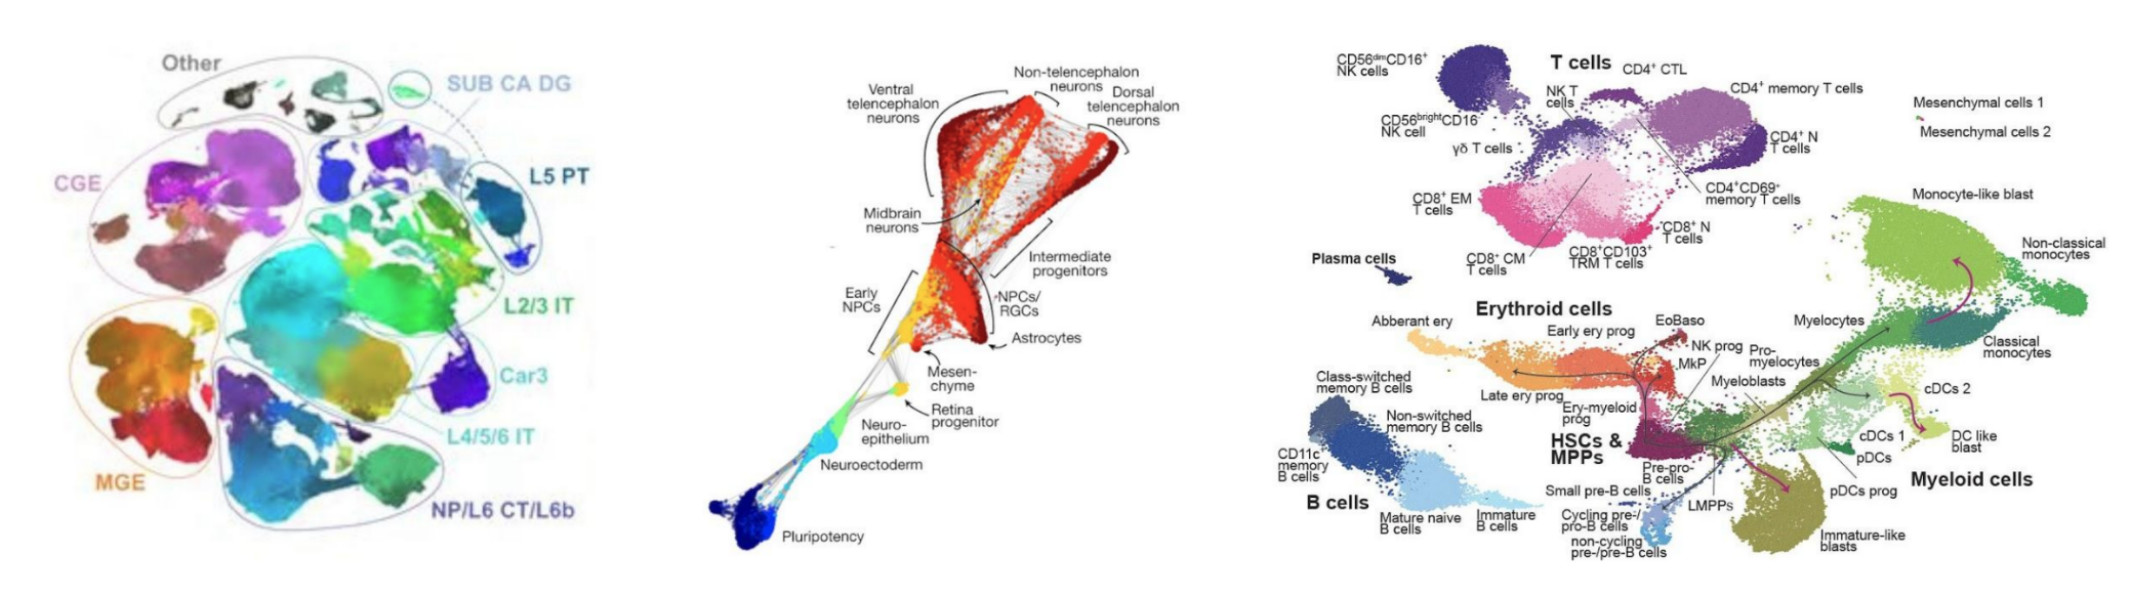
Similar algorithms are also applied in artificial intelligence research to visualise massive datasets used to train state-of-the-art artificial intelligence models, such as image-based and text-based generative models. This allows researchers to discover biases and gaps in the data, to highlight model limitations, and ultimately to develop better models (Figure 2). A concise overview of the model’s training data can also be helpful for societal oversight and public communication.

Neighbour embedding methods like t-SNE and UMAP create a low-dimensional map of the data based on the k-nearest-neighbour graph. As a result, they are often unable to reproduce large-scale global structure of the data [12], creating potentially misleading visualizations [13]. Acquisition of increasingly high-dimensional data across scientific fields has sparked widespread interest in employing dimensionality reduction and visualisation methods. However, there is a gap between method developers who propose and implement these algorithms, and domain experts who aim to use them. The purpose of this seminar was to bring together machine learning researchers, theoreticians, and practitioners, to address current gaps in theoretical guarantees and evaluation measures for state-of-the-art approaches, highlight practical challenges in applying these techniques in different domains, brainstorm the solutions, and set up new collaborations to tackle open problems in this vibrant field.
Seminar topics
The overarching purpose of this Dagstuhl Seminar was to brainstorm open problems and challenges in the field of low-dimensional embeddings, as seen by (i) practitioners; (ii) theoreticians and mathematicians; and (iii) machine learning researchers — leading to new collaborations to tackle these problems. The seminar focused on the following open questions, grouped into four areas.

Low-dimensional embeddings in actual practice
Single-cell biology, working with large quantities of high-dimensional data and interested in exploratory research, became a field heavily relying on low-dimensional embeddings. But embeddings of texts [5], of genomes [14], of graph nodes [15], of chemical structures [16], etc., are also rapidly gaining popularity. Seminar participants discussed and brainstormed which fields in the coming years are likely to generate data amenable for embedding methods, and compared challenges raised by each of these application fields.
Neighbour embeddings have a number of well-known limitations [12]: for example, they can strongly distort the global structure of the data and are unable to represent high-dimensional topological features of the data. These artefacts can lead practitioners to incorrect scientific conclusions or to chasing unfounded hypotheses. We extensively discussed (i) which limitations can be addressed by the new generation of algorithms; (ii) how to diagnose misleading aspects of any given embedding; and (iii) what evaluation metrics are necessary and sufficient for comparing different visualisation techniques.
Moreover, two-dimensional embeddings have been recently criticised as being dangerously misleading [13]. At the same time, they are widely used across many disciplines and can be helpful in actual scientific practice, if used with care [12]. In several talks and multiple discussions, seminar participants talked about specific examples of how and where the embeddings are useful, and which best practices can help to avoid them being misleading.
Common themes across state-of-the-art algorithms and relevant trade-offs
One common theme in multiple talks and discussions was trade-offs between various embedding algorithms.
First, methods like t-SNE or UMAP are typically used to produce 2D or 3D embeddings, while spectral methods like Laplacian eigenmaps [17] produce low-dimensional embeddings that are often used with more embedding dimensions. This is less suitable for visualisation but may be better suited for downstream data analysis. Several seminar participants reported successfully applying UMAP to intermediate dimensionality too, with particular benefits for downstream density-based clustering (using HDBSCAN algorithm).
Second, all neighbour embedding algorithms operate on the kNN graph of the data but use different loss functions and different attractive/repulsive forces to arrive at the final layout. This yields various trade-offs in the quality of global/local structure preservation [18].
Third, neighbour embedding algorithms are typically run on a kNN graph constructed using pairwise Euclidean distances, but in principle any other metric can be used as well. Specifically, metric design can be useful for incorporating domain knowledge and statistical priors on the data [19, 20]. We discussed what kinds of data can profit from using non-Euclidean distance metrics, or from kNN graph post-processing, such as diffusion-based smoothing.
Fourth, more generally, neighbour embeddings are known to be related to the self-supervised learning approach known as contrastive learning [21]. However, despite substantial progress in each of these two fields, they stayed largely disconnected from each other. Seminar participants argued that both contrastive learning and neighbour embedding research can benefit from each other’s state-of-the-art approaches, and in particular can be combined to develop new algorithms for visualising textual and/or graph-based data.
Fifth, while neighbour embeddings only aim to preserve nearest neighbours, methods based on MDS aim to preserve all pairwise distances including the large ones. In Isomap [22] and PHATE [23], pairwise distances are obtained as graph distances on the kNN graph. Isomap uses short path distance, while PHATE uses diffusion-based distance called potential distance. LDLE [24] uses bottom-up manifold learning to align low-distortion local embeddings to a global embedding. We discussed to what extent these approaches can capture both the local and the global structure of the data, and what the advantages and the disadvantages of aiming to preserve global aspects of the data are.
Interactive embeddings
Another extensively discussed topic was interactive visualizations of 2D embeddings (in particular see abstracts by Benjamin M. Schmidt and B. P. F. Lelieveldt). While most often low-dimensional embeddings are depicted as static images, they can be powerful tools for interactive data explorers. NomicAI has been developing software for in-browser interactive explorers, while the group of B. P. F. Lelieveldt has been working on stand-alone software for interactive explorerd of RNA-sequencing data.
Perspective paper
During the seminar, participants decided to work together on a perspective paper, provisionally titled like the seminar: “Low-dimensional embeddings of high-dimensional data”. During the seminar, we organized several brainstorming sessions on what should the paper cover and how the material should be organized. The writing is currently underway and we hope to be able to release the work some time in summer 2024.
References
- [1] Kobak, Dmitry and Berens, Philipp The art of using t-SNE for single-cell transcriptomics, Nature Communications, 10(1): 1–14, 2019.
- [2] Belkina, Anna C and Ciccolella, Christopher O and Anno, Rina and others Automated optimized parameters for T-distributed stochastic neighbor embedding improve visualization and analysis of large datasets, Nature Communications, 10(1): 5415, 2019.
- [3] Diaz-Papkovich, Alex and Anderson-Trocmé, Luke and Ben-Eghan, Chief and Gravel, Simon UMAP reveals cryptic population structure and phenotype heterogeneity in large genomic cohorts, PLoS genetics, 15(11): e1008432, 2019.
- [4] Kollmorgen, Sepp and Hahnloser, Richard HR and Mante, Valerio Nearest neighbours reveal fast and slow components of motor learning, Nature, 577(7791): 526–530, 2020.
- [5] Schmidt, Benjamin Stable random projection: Lightweight, general-purpose dimensionality reduction for digitized libraries, Journal of Cultural Analytics, 3(1), 2018.
- [6] van der Maaten, Laurens and Hinton, Geoffrey Visualizing data using t-SNE, Journal of Machine Learning Research, 9(11), 2008.
- [7] McInnes, Leland and Healy, John and Melville, James UMAP: Uniform manifold approximation and projection for dimension reduction, arXiv preprint arXiv:1802.03426, 2018.
- [8] Yao, Zizhen and Van Velthoven, Cindy TJ and Nguyen, Thuc Nghi and others A taxonomy of transcriptomic cell types across the isocortex and hippocampal formation, Cell, 184(12): 3222–3241, 2021.
- [9] Kanton, Sabina and Boyle, Michael James and He, Zhisong and others Organoid single-cell genomic atlas uncovers human-specific features of brain development, Nature, 2019.
- [10] Triana, Sergio and Vonficht, Dominik and Jopp-Saile, Lea and others Single-cell proteo-genomic reference maps of the hematopoietic system enable the purification and massive profiling of precisely defined cell states, Nature Immunology, 22(12): 1577–1589, 2021.
- [11] Anand, Yuvanesh and Nussbaum, Zach and Treat, Adam and other GPT4All: An Ecosystem of Open Source Compressed Language Models, arXiv preprint arXiv:2311.04931, 2023.
- [12] Wattenberg, Martin and Viégas, Fernanda and Johnson, Ian How to Use t-SNE Effectively, Distill, 2016, 10.23915/distill.00002.
- [13] Chari, Tara and Pachter, Lior The specious art of single-cell genomics, PLoS Computational Biology, 19(8): e1011288, 2023.
- [14] Diaz-Papkovich, Alex and Anderson-Trocmé, Luke and Gravel, Simon A review of UMAP in population genetics, Journal of Human Genetics, 66(1): 85–91, 2021.
- [15] Hu, Yifan Efficient, high-quality force-directed graph drawing, Mathematica journal, 10(1): 37–71, 2005.
- [16] Probst, Daniel and Reymond, Jean-Louis Visualization of very large high-dimensional data sets as minimum spanning trees, Journal of Cheminformatics, 12(1): 12, 2020.
- [17] Belkin, Mikhail and Niyogi, Partha Laplacian eigenmaps for dimensionality reduction and data representation, Neural Computation, 15(6): 1373–1396, 2003.
- [18] Böhm, Jan Niklas and Berens, Philipp and Kobak, Dmitry Attraction-Repulsion Spectrum in Neighbor Embeddings, Journal of Machine Learning Research, 23(95), 2022.
- [19] Talmon, Ronen and Coifman, Ronald R Empirical intrinsic geometry for nonlinear modeling and time series filtering, Proceedings of the National Academy of Sciences, 110(31): 12535–12540, 2013.
- [20] Mishne, Gal and Talmon, Ronen and Meir, Ron and others Hierarchical coupled-geometry analysis for neuronal structure and activity pattern discovery, IEEE Journal of Selected Topics in Signal Processing, 10(7): 1238–1253, 2016.
- [21] Damrich, Sebastian and Böhm, Niklas and Hamprecht, Fred A and Kobak, Dmitry From -SNE to UMAP with contrastive learning, In The Eleventh International Conference on Learning Representations, 2023.
- [22] Tenenbaum, Joshua B and Silva, Vin de and Langford, John C A global geometric framework for nonlinear dimensionality reduction, Science, 290(5500): 2319–2323, 2000.
- [23] Moon, Kevin R and Van Dijk, David and Wang, Zheng and others Visualizing structure and transitions in high-dimensional biological data, Nature Biotechnology, 37(12): 1482–1492, 2019.
- [24] Kohli, Dhruv and Cloninger, Alexander and Mishne, Gal LDLE: Low distortion local eigenmaps, Journal of machine learning research, 22(282): 1–64, 2021.
2 Table of Contents
3 Overview of Talks
3.1 RNA Velocity Embeddings in Curved Spaces
Michael Bleher (Universität Heidelberg, DE)
License: Creative Commons BY 4.0 International license © Michael Bleher
RNA velocity data provides a snapshot of cell states and their current rate of change. It promises insights into the behaviour of individual cells and the dynamics governing cell division and differentiation processes. To explore single cell RNA-sequence data one often relies on low-dimensional visualizations, e.g. tSNE or UMAP. A priori it is not obvious how RNA velocities carry over to such representations and current methods have several drawbacks.
It was recently suggested that one should fix a biologically motivated, low-dimensional manifold and infer RNA velocities strictly in terms of an embedding of the data in that manifold. I expand on that idea and argue that low-dimensional representations of position-velocity pairs should utilize the Sasakian geometry on the tangent bundle of curved target spaces. Moreover, I propose that non-linear neighbour embeddings into low- or middle-dimensional symmetric spaces provide a geometric representation of the principal dynamical components in the data. This geometrization provides interesting future directions regarding the analysis of the dynamical processes captured in single cell data.
3.2 Dimensionality Reduction for Scientific Machine Learning – First Steps towards Task-driven Mechanistic Model Reduction
Kerstin Bunte (University of Groningen, NL)
License: Creative Commons BY 4.0 International license © Kerstin Bunte
Joint work of: Kerstin Bunte, Peter Tiňo, Elisa Oostwal, Janis Norden, Michael Chappell
Nowadays, most successful machine learning (ML) techniques for the analysis of complex interdisciplinary data use significant amounts of measurements as input to a statistical system. The domain expert knowledge is often only used in data preprocessing. The subsequently trained technique appears as a “black box”, which is difficult to interpret and rarely allows insight into the underlying natural process. Especially in critical domains such as medicine and engineering, the analysis of dynamic data in the form of sequences and time series is often difficult. Due to natural or cost limitations and ethical considerations data is often irregularly and sparsely sampled and the underlying dynamic system is complex. Therefore, domain experts currently enter a time-consuming and laborious cycle of mechanistic model construction and simulation, often without direct use of the experimental data or the task at hand. We now combine the predictive power of ML and the explanatory power of mechanistic models. Therefore we perform learning in the space of dynamic models that represent the complex underlying natural processes, with potentially very few measurements. We use principles of dimensionality reduction, such as subspace learning, to determine relevant areas in the parameter space of the underlying model as a first step to achieve task-driven model reduction.
3.3 Tree-based Dimensionality Reduction and Clustering
Miguel Á. Carreira-Perpiñán (University of California – Merced, US)
License: Creative Commons BY 4.0 International license © Miguel Á. Carreira-Perpiñán
I describe recent work about tree-structured dimensionality reduction, with applications to interpretability, fast training and inference, and scalability to large datasets. This relies on learning optimal sparse oblique decision trees, which have hyperplane splits using few features (rather than the traditional single-feature splits). I make connections to methods ranging from PCA to autoencoders to t-SNE, and extensions to clustering and other topics.
3.4 Mapping the Embedding Multiverse
Corinna Coupette (MPI für Informatik – Saarbrücken, DE)
License: Creative Commons BY 4.0 International license © Corinna Coupette
Joint work of: Jeremy Wayland, Corinna Coupette, Bastian Rieck
Main reference: Jeremy Wayland, Corinna Coupette, Bastian Rieck: “Mapping the Multiverse of Latent Representations”, CoRR, Vol. abs/2402.01514, 2024.
Echoing recent calls to counter reliability and robustness concerns in machine learning via multiverse analysis, we present PRESTO, a principled framework for mapping the multiverse of machine-learning models that rely on latent representations. Although such models enjoy widespread adoption, the variability in their embeddings remains poorly understood, resulting in unnecessary complexity and untrustworthy representations. Our framework uses persistent homology to characterize the latent spaces arising from different combinations of diverse machine-learning methods, (hyper)parameter configurations, and datasets, allowing us to measure their pairwise (dis)similarity and statistically reason about their distributions. As we demonstrate both theoretically and empirically, our pipeline preserves desirable properties of collections of latent representations, and it can be leveraged to perform sensitivity analysis, detect anomalous embeddings, or efficiently and effectively navigate hyperparameter search spaces.
3.5 Detecting the Topology of High-dimensional Data with Spectral Methods
Sebastian Damrich (Universität Tübingen, DE)
License: Creative Commons BY 4.0 International license © Sebastian Damrich
Joint work of: Sebastian Damrich, Philipp Berens, Dmitry Kobak
Persistent homology is a popular computational tool for finding the global shape (topology) of point clouds, such as the presence of loops or voids. However, many real-world datasets with low intrinsic dimensionality reside in an ambient space of much higher dimensionality. We show that in this case traditional persistent homology becomes very sensitive to noise and fails to detect the correct topology. The same holds true for existing refinements of persistent homology. As a remedy, we find that spectral distances, such as diffusion distance and effective resistance, allow persistent homology to detect the correct topology even in the presence of high-dimensional noise. Finally, we apply these methods to high-dimensional single-cell RNA-sequencing data.
3.6 Neighbor Embedding Algorithms: Missing Data, Fast Multiscale Approaches, and Interpretability
Cyril de Bodt (University of Louvain, BE)
License: Creative Commons BY 4.0 International license © Cyril de Bodt
Joint work of: Cyril de Bodt, Dounia Mulders, Michel Verleysen, Pierre Lambert, Edouard Couplet
Dimensionality reduction (DR) aims at computing relevant low-dimensional (LD) representations of high-dimensional (HD) data sets, mainly for exploratory visualization. Different paradigms have emerged to formalize mappings from HD to LD coordinates, e.g., through the reproduction of distances or neighborhoods. In the data visualization context, neighbor embedding (NE) algorithms, such as stochastic neighbor embedding (SNE) and variants (-SNE, UMAP, etc.), reach outstanding DR performance compared to older techniques.
After quickly introducing the field of dimensionality reduction for data visualization and NE algorithms in particular, this talk will summarize three lines of projects recently explored in our lab:
References
- [1] de Bodt, Cyril and Mulders, Dounia and Verleysen, Michel and Lee, John Aldo Nonlinear dimensionality reduction with missing data using parametric multiple imputations, IEEE Transactions on Neural Networks and Learning Systems, 30(4): 1166–1179, 2018. https://ieeexplore.ieee.org/abstract/document/8447227
- [2] De Bodt, Cyril and Mulders, Dounia and Verleysen, Michel and Lee, John Aldo Fast multiscale neighbor embedding, IEEE Transactions on Neural Networks and Learning Systems, 33(4): 1546–1560, 2020. https://ieeexplore.ieee.org/abstract/document/9308987
- [3] Lambert, Pierre and Marion, Rebecca and Albert, Julien and others Globally local and fast explanations of -SNE-like nonlinear embeddings, 2022. https://dial.uclouvain.be/pr/boreal/object/boreal:265533
- [4] Couplet, Edouard and Lambert, Pierre and Verleysen, Michel and others Natively Interpretable t-SNE, 2023. https://dial.uclouvain.be/pr/boreal/object/boreal:279549
3.7 What is a Population? Insights from Topological Analysis of Biobank Data
Alex Diaz-Papkovich (Brown University – Providence, US)
License: Creative Commons BY 4.0 International license © Alex Diaz-Papkovich
Joint work of: Alex Diaz-Papkovich, Shadi Zabad, Chief Ben-Eghan, Luke Anderson-Trocmé, Georgette Femerling, Vikram Nathan, Jenisha Patel, Simon Gravel
Population genetics methods necessarily rely on some definition of a population for analysis. Many methods exist, and most either model a discrete number of populations and their mixtures or define an archetype of a population and fit data to that. Alternatively, we can use density clustering after having processed the data with UMAP specifically parametrized for clustering. Using this approach, we can visualize and study biobank data from a genetic perspective, allowing us to better understand the complexity of the gene-geography-environment relationship, explore potential analyses, and ultimately learn much more about the data upon which so many analyses are based.
3.8 Compound-SNE for Comparative Alignment of Multiple t-SNEs & Eco-velo for RNA-velocity estimation
Laleh Haghverdi (Max-Delbrück-Centrum – Berlin, DE)
License: Creative Commons BY 4.0 International license © Laleh Haghverdi
One of the first steps in single-cell omics data analysis is visualization, which allows researchers to see how well-separated cell-types are from each other. In order to improve visual comparisons between large numbers of samples, we introduce Compound-SNE, which performs what we term a soft alignment of samples in embedding space. We show that Compound-SNE is able to align cell-types in embedding space across samples and data modalities, while preserving local embedding structures from when samples are embedded independently. I also talked about application of the Nostrum projection method for visualisation of RNA-velocities, as well as our cost-efficient Eco-velo approach, which skips the current unreliable gene-by gene parameter fitting approaches for velocity estimation.
3.9 Using Embeddings in the Social Sciences: Examples and Open Problems
Ágnes Horvát (Northwestern University – Evanston, US)
License: Creative Commons BY 4.0 International license © Ágnes Horvát
Joint work of: Ágnes Horvát, Daniel Romero, Hao Peng, Stasa Milojevic, Orsolya Vasarhelyi, Igor Zakhlebin, Sohyeon Hwang, Katherine O’Toole, Henry Dambanemuya, Brian Uzzi
In recent years, there has been an explosion of interest in quantitative methods that rely on low-dimensional embeddings for pattern extraction and visualization. Social scientists increasingly recognize that these techniques open up new methodological opportunities. This brief talk presented examples from our work relying on digital trace data to understand online science communication [1, 4, 3, 2], musical creativity [5], and capital allocation [6], highlighting the challenges where social science applications need further methodological development.
References
- [1] Peng, H., Romero, D. & Horvát, E. Dynamics of cross-platform attention to retracted papers. Proceedings Of The National Academy Of Sciences. 119, e2119086119 (2022)
- [2] Hwang, S., Horvát, E. & Romero, D. Information Retention in the Multi-Platform Sharing of Science. Proceedings Of The Seventeenth International AAAI Conference On Web And Social Media, ICWSM 2023, June 5-8, 2023, Limassol, Cyprus. pp. 375-386 (2023), https://doi.org/10.1609/icwsm.v17i1.22153
- [3] Vásárhelyi, O., Zakhlebin, I., Milojević, S. & Horvát, E. Gender inequities in the online dissemination of scholars’ work. Proceedings Of The National Academy Of Sciences. 118 (2021)
- [4] Zakhlebin, I. & Horvát, E. Diffusion of Scientific Articles across Online Platforms. Proc. Int. AAAI Conf. Web. Soc. Media. 14, 762-773 (2020,5), https://ojs.aaai.org/index.php/ICWSM/article/view/7341
- [5] O’Toole, K. & Horvát, E. Extending human creativity with AI. Journal Of Creativity. 34, 100080 (2024), https://www.sciencedirect.com/science/article/pii/S2713374524000062
- [6] Horvát, E., Dambanemuya, H., Uparna, J. & Uzzi, B. Hidden Indicators of Collective Intelligence in Crowdfunding. Proceedings Of The ACM Web Conference 2023, WWW 2023, Austin, TX, USA, 30 April 2023 – 4 May 2023. pp. 3806-3815 (2023), https://doi.org/10.1145/3543507.3583414
3.10 Neighbour Embeddings Meet Contrastive Learning
Dmitry Kobak (Universität Tübingen, DE)
License: Creative Commons BY 4.0 International license © Dmitry Kobak
In recent years, neighbor embedding methods like t-SNE and UMAP have become widely used across several application fields, in particular in single-cell biology. Given this attention, it is very important to understand possibilities, shortcomings, and trade-offs of neighbor embedding methods. In this talk, I present our recent work on the attraction-repulsion spectrum of neighbor embeddings and the involved trade-offs [1, 2]. I also explain how neighbor embeddings are related to contrastive learning, a popular framework for self-supervised learning of image data. This leads to our recent work on contrastive visualizations of image datasets (t-SimCNE) [3].
References
- [1] Böhm, Jan Niklas and Berens, Philipp and Kobak, Dmitry Attraction-Repulsion Spectrum in Neighbor Embeddings, Journal of Machine Learning Research, 23(95), 2022.
- [2] Damrich, Sebastian and Böhm, Niklas and Hamprecht, Fred A and Kobak, Dmitry From -SNE to UMAP with contrastive learning, In The Eleventh International Conference on Learning Representations, 2023.
- [3] Böhm, Niklas and Berens, Philipp and Kobak, Dmitry Unsupervised visualization of image datasets using contrastive learning, In The Eleventh International Conference on Learning Representations, 2023.
3.11 Tear and Repulsion Enabled Registration of Point Clouds for Manifold Learning
Dhruv Kohli (University of California – San Diego, US)
License: Creative Commons BY 4.0 International license © Dhruv Kohli
Joint work of: Dhruv Kohli, Gal Mishne, Alex Cloninger
We present a framework for aligning the local views of a possibly closed/non-orientable data manifold to produce an embedding in its intrinsic dimension through tearing. Through a spectral coloring scheme, we render the embeddings of the points across the tear with matching colors, enabling a visual recovery of the topology of the data manifold. The embedding is further equipped with a tear-aware metric that enables computation of shortest paths while accounting for the tear. To measure the quality of an embedding, we propose two Lipschitz-type notions of global distortion—a stronger and a weaker one—along with their pointwise counterparts for a finer assessment of the embedding. Subsequently, we bound them using the distortion of the local views and the alignment error between them. We show that our theoretical result on strong distortion leads to a new perspective on the need for a repulsion term in manifold learning objectives. As a result, we enhance our alignment approach by incorporating repulsion. Finally, we compare various strategies for the tear and repulsion enabled alignment, with regard to their speed of convergence and the quality of the embeddings produced.
3.12 Heat Diffusion Distances, Manifold Embeddings and Geodesics
Smita Krishnaswamy (Yale University – New Haven, US)
License: Creative Commons BY 4.0 International license © Smita Krishnaswamy
Here we explore the connection between heat diffusion on data and recovery of manifold or more intrinsic distances in data for low dimensional embeddings and dimensionality reduction. The main approach here is to view the data as a graph over which random walks or heat diffusion are conducted to discover distances “through” the data between points and then embed them in low dimensions. We introduce the idea of random walk based distance, which is a feature of diffusion maps and our PHATE method. With the latter using an M-divergence between data (discrete) diffusion probabilities. Next we introduce the heat kernel which involves exponential powers of the graph laplacian, which can be used to discover a more generalized multiscale distance and preservation options which weigh near and far distances under different schema to create a continuum between neighbor preservation embeddings (like SNE) and global embeddings like PHATE. Finally we showed how to use these distances to regularize autoencoders whose latent spaces can then be used for population flows and discovery of dynamics from static snapshot data via our Neural FIM and Mioflow frameworks.
3.13 Unsupervised Dimensionality Reduction: Multi-Scale Methods & Quality Assessment
John Aldo Lee (UC Louvain-la-Neuve, BE) and Cyril de Bodt (University of Louvain, BE)
License: Creative Commons BY 4.0 International license © John Aldo Lee and Cyril de Bodt
Joint work of: John A. Lee, Cyril de Bodt, Pierre Lambert, Edouard Couplet, Michel Verleysen
Since 2008, methods of neighbor embedding (NE) have gained much popularity and have outperformed mostly all other paradigms of dimensionality reduction DR. A method like t-SNE yields results that clearly outperform stress-based multidimensional scaling (MDS) for instance. However, NE is known to be a local method, preserving small neighborhoods, whereas MDS is more of a global method, keeping the global data arrangement. This work is interested in developing NE methods that are local and global, as well as quality criteria to evaluate them. Multi-scale NE can be achieved by using entropic affinities by browsing a range of neighborhood sizes (a.k.a. perplexities in NE) like powers of 2 up to about N/2. Then entropic affinities are averaged to get multi-scale affinities that can be matched with information-theoretic divergences.
In order to evaluate these methods, quality criteria have been developed, based on neighborhood rank preservation. As those criteria depend on the neighborhood size K, curves of neighborhood agreement with respect to K can be drawn. Rescaling the criterion to account for random embedding and having a log axis for abscissa K visually emphasizes local neighborhoods; the area under the curve yields a scalar score for each compared embedding. DR quality assessment can then be considered in a (DR – DR QA – user) loop for iterative exploratory data analysis. Some examples are discussed and a software interface for exploratory data analysis are presented. A complementary topic is a new method of MDS, working with a low-cost stochastic optmization, coined SQuaD-MDS (stochastic quartet descent). Like other flavors of MDS, SQuaD-MDS is more of a global method. However, it can be combined with accelerated local methods of NE to address their main shortcoming of overlooking the global structure.
A companion talk is given by Cyril de Bodt with recent projects and papers along that line (NE with missing data, fast multi-scale NE, interpretable NE).
3.14 Interactive Visual Analytics and Hypothesis Generation with Non-linear Similarity Embeddings
B.P.F. Lelieveldt (Leiden University Medical Center, NL)
License: Creative Commons BY 4.0 International license © B.P.F. Lelieveldt
Joint work of: B.P.F. Lelieveldt, Nicola Pezzotti, Thomas Hoellt, Anna Vilanova, Thomas Kroes, Julian Thijssen, Jeroen Eggermont, Baldur van Lew, Soumyadeep Basu, Alexander Vieth, Chang Li
Non-linear similarity embedding techniques such tSNE and UMAP have rapidly gained traction for exploratory data analysis and visualization. They have demonstrated their utility for hypothesis generation, and following from that, the formulation of highly targeted experimental setups for verification of these visualization-inspired hypotheses. Key enabling factor for this hypothesis generation is the development of high-performance tools to interact with embeddings that enable on-the-fly drill-ins, re-embedding and complementary views on the data: a visualization paradigm known as visual analytics. This presentation discussed a number of methods to enable and integrate interactivity, as well as embedding dynamics and quality control cues into the visual exploration of high-dimensional data. Departing from the scalable embedding technique Hierarchical Stochastic Neighbor Embedding (HSNE), methods such as progressive visualization of attraction force reduction during embedding, dual sample-feature views, magic lenses for localized alterations in attraction force, elastically-coupled multi-view embeddings, and strategies for “focus and context” drill-in options for multi-million datapoint datasets were discussed. Application examples were focused on life-sciences (single-cell and spatial transcriptomics) and hyperspectral image analysis (satellite imagery and paintings).
3.15 Nearest Neighbour Graphs – Edges and Weights
Leland McInnes (Tutte Institute for MathematicsComputing – Ottawa, CA)
License: Creative Commons BY 4.0 International license © Leland McInnes
I proposed an alternative method for generating weights in a nearest neighbour graph, with the intention of using the (directed, weighted) graph for clustering or dimension reduction. The approach uses per point estimates of the distribution of nearest neighbour distances in local regions of the data space; these estimates can be constructed by performing recursive Bayesian updates of estimates based on the estimates of neighbouring points. One can then generate a neighbour graph with edge weights (of affinities) given by the probability (under the points model of nearest neighbour distances) that a given candidate neighbour is a nearest neighbour. It can be shown that results in a graph where edge weights more closely align with distances in low-dimensional representations given by neighbour graph methods such as t-SNE, TriMAP, MDE and UMAP. This provides a potential approach for performing clustering directly on high dimensional data that is competitive with approaches such as UMAP+HDBCSAN.
3.16 The Case for Intermediate-dimensional Embeddings – Looking Deep into the Spectrum of the Graph Laplacian
Gal Mishne (University of California, San Diego – La Jolla, US)
License: Creative Commons BY 4.0 International license © Gal Mishne
Joint work of: Gal Mishne, Xiuyuan Cheng, Raphy Coifman, Hadas Benisty, Dhruv Kohli, Alex Cloninger, Devika Narain, Bas Nieuwenhuis
Main reference: Dhruv Kohli, Alexander Cloninger, Gal Mishne: “LDLE: Low Distortion Local Eigenmaps”, J. Mach. Learn. Res., Vol. 22, pp. 282:1–282:64, 2021.
In this talk, I introduce new unsupervised geometric approaches for extracting structure from large-scale high-dimensional data. The traditional viewpoint of spectral approaches to clustering and manifold learning is to construct a data-driven graph on the data-points and use the top eigenvectors of the graph Laplacian matrix to embed the data. However, in recent work, we have shown the benefit of looking deep within the spectrum of the graph-Laplacian to identify subsets of eigenvectors that characterize the data locally. First, I will present a new robust measure, the Spectral Embedding Norm, to separate clusters from background, and demonstrate its application to both outlier detection and image segmentation. Based on this measure we developed a greedy method for extracting overlapping clusters from a dominant background compound, which we demonstrate on calcium imaging data at different spatial scales (e.g., cellular, widefield). Finally, I will present Low Distortion Local Eigenmaps (LDLE), a “bottom-up” manifold learning technique that constructs a set of low distortion local views of a dataset in lower dimension and registers them to obtain a global embedding. In contrast to existing data visualization techniques, LDLE is more geometric and can embed manifolds without boundary as well as non-orientable manifolds into their intrinsic dimension.
3.17 Probabilistic Embedding Models
Ian Nabney (University of Bristol, GB)
License: Creative Commons BY 4.0 International license © Ian Nabney
This talk discussed briefly the importance of user involvement in method development with an example from model evaluation: how does a non-expert user know whether further work is needed on a specific model?
The main aim of the talk was to describe how latent variable models can be used for dimensionality reduction and the characteristics of the statistical probability analysis viewpoint. Principal Component Analysis was defined as a probabilistic model and it was shown how it can be generalised to a density model for the data (latent variable model exemplified by Generative Topographic Mapping – GTM). The value of this is the use of a single coherent framework: probabilities (noise and statistical viewpoint not an afterthought but inherent in the model), latent variables, inference, EM algorithm, Bayes. We then discussed how GTM can be extended to deal with missing values, discrete and mixed data types, time-dependent data, hierarchies, and feature selection. Illustrations from real applications were provided throughout.
3.18 On the Epistemic Virtues of Dimensionality Reduction
Maximilian Noichl (Utrecht University, NL)
License: Creative Commons BY 4.0 International license © Maximilian Noichl
In the present contribution, we focus on novel techniques of dimensionality-reduction. These methods can be useful both as independent analyses in there own right, as preprocessing steps for further analysis, e. g. clustering, and as visualisation techniques that translate data into two or three dimensions. Because of their undeniable power, both linear variants, like the older PCA, as well as somewhat novel non-linear variants, like t-SNE or UMAP, have become ubiquitous in scientific and commercial data analysis, including domains as varied as chemistry, linguistics, genetics and psychology. Importantly, they are also used to inspect the features learned by neural networks and to visualise their learning-process. But their adoption has not been without controversy, as the structures they produce can be highly sensitive to the choice of hyper-parameters as well as random initialisation. This has made some practitioners cautious in their interpretation and communication of their results, especially regarding settings that have some bearing on social questions. UMAP or t-SNE-visualizations of human genomic data can for example give the impression of clear separation of human groups that is not warranted by the data, a visual feature that has led them to be widely shared in racist internet-communities. In our contribution, we investigate the emergence of epistemic virtues, a notion we borrow from Lorraine Daston’s and Peter Galison’s work on the virtue of objectivity, surrounding these techniques. We base our analysis on published articles, open-sourced code, tutorials, as well as a computational analysis of social media content, and interviews with key-actors in the domain. Based on our analysis we suggest a first account of the epistemic virtues which in our view ought to surround their practical usage. We suggest that virtues like accessibility, interactivity, explorability can supersede virtues like mechanisation and process-determinacy im some cases. We further highlight how deeply non-epistemic values of software-implementation, like speed and ease of use interweave with epistemic one, and make some suggestions for how the the maintainers of open source packages can improve the environment in which end-users find themselves to contribute to a responsible and scientifically profitable practice.
3.19 VERA: Generating Visual Explanations of Two-Dimensional Embeddings via Region Annotation
Pavlin G. Poličar (University of Ljubljana, SI)
License: Creative Commons BY 4.0 International license © Pavlin G. Poličar
Joint work of: Pavlin G. Poličar, Blaž Zupan
Main reference: Pavlin G. Poličar, Blaž Zupan: “VERA: Generating Visual Explanations of Two-Dimensional Embeddings via Region Annotation”, 2024.
Two-dimensional embeddings obtained from dimensionality reduction techniques, such as MDS, t-SNE, and UMAP, are widely used across various disciplines to visualize high-dimensional data. These visualizations provide a valuable tool for exploratory data analysis, allowing researchers to visually identify clusters, outliers, and other interesting patterns in the data. However, interpreting the resulting visualizations can be challenging, as it often requires additional manual inspection to understand the differences between data points in different regions of the embedding space. To address this issue, we propose Visual Explanations via Region Annotation (VERA), an automatic embedding-annotation approach that generates visual explanations for any two-dimensional embedding. VERA produces informative explanations that characterize distinct regions in the embedding space, allowing users to gain an overview of the embedding landscape at a glance. Unlike most existing approaches, which typically require some degree of manual user intervention, VERA produces static explanations, automatically identifying and selecting the most informative visual explanations to show to the user. We illustrate the usage of VERA on a real-world data set and validate the utility of our approach with a comparative user study. Our results demonstrate that the explanations generated by VERA are as useful as fully-fledged interactive tools on typical exploratory data analysis tasks but require significantly less time and effort from the user.
3.20 No Metric to Rule Them All: Gauging the Graphicality of Graph Data
Bastian Rieck (Helmholtz Zentrum München, DE)
License: Creative Commons BY 4.0 International license © Bastian Rieck
Graphs are ubiquitous and constitute the primary data type in many application domains. Modern graph learning algorithms, like graph neural networks, permit dealing with graph data in such contexts. Recent research, however, shows that these algorithms are biased in the sense that they use the graph structure for tasks even when it unnecessary or detrimental for task performance. Thus, there is a crucial need for understanding to what extent the structure of a graph and its attributes are related. We address this by lifting the problem to a comparison of metric spaces defined by either the attributes or the structure of a graph. This defines a new measure that we refer to as graphicality. We demonstrate its utility via a suite of experiments while also proving its stability properties.
3.21 Distances and Trees
Enrique Fita Sanmartin (Universität Heidelberg, DE)
License: Creative Commons BY 4.0 International license © Enrique Fita Sanmartin
Joint work of: Sebastian Damrich, Christoph Schnörr, Fred A. Hamprecht
Main reference: Enrique Fita Sanmartín, Christoph Schnörr, Fred A. Hamprecht: “The Central Spanning Tree Problem”, CoRR, Vol. abs/2404.06447, 2024.
In the first part of the talk, we present the “log-norm” family of distances, a novel family of metrics on graphs that interpolates between the shortest path, minimax and commute cost distances. The log-norm family is based on the “algebraic path problem” framework, a generalization of the shortest path problem. In the second part, we introduce a family of robust spanning trees embedded in Euclidean space, named central spanning tree (CST), whose geometric structure is resilient against perturbations such as noise. The family of trees is defined through a parameterized NP-hard minimization problem over the edge lengths, with specific instances including the minimum spanning tree or the Euclidean Steiner tree. The minimization problem weighs the length of the edges by their tree edge-centralities, which are regulated by a parameter . Two variants of the problem are explored: one permitting the inclusion of Steiner points (referred to as branched central spanning tree or BCST), and another that does not. The effect of on tree robustness is empirically analyzed, and a heuristic for approximating the optimal solution is proposed.
3.22 Scalable Interaction in Browser-based Embedding Visualizations
Benjamin M. Schmidt (Nomic AI – New York, US)
License: Creative Commons BY 4.0 International license © Benjamin M. Schmidt
Joint work of: Brandon Duderstadt, Andriy Mulyar, Robert Lesser, Wilson Jr. Marcilio, Vincent Giardina, Aaron Miller, Richard Guo, Benjamin M. Schmidt
Practices of two-dimensional embedding representations that have emerged from the cultural heritage community offer useful models for advancing human-computer interaction techniques in dimensionality reduction. Domain experts in the fields often have extremely little investment in programming but can easily understand and read individual points given a sufficiently advanced interface. In this talk I describe the tactics used in Deepscatter, a typescript/WebGL library, that is able to progressively serve, render, and interactively animate billion-point scatterplots over the web using Apache Arrow and other technologies by storing data in a progressively-loaded quadtree format designed to allow mutations and editing through asynchronous transformations. I also describe the language of data interaction we have developed in the Nomic AI Atlas product for easing the tasks of large-scale filtering, selection, tagging, and search on data represented upstream as embeddings; the creation of selections of data and interactive repositioning of points is an important component of interaction that allows improving models and avoiding the misreadings that are easy when relying on only a single, static view that makes interrogating individual points difficult or impossible.
3.23 Using Higher-Order De Bruijn Graphs to Learn Causality-Aware Representations of Temporal Graphs
Ingo Scholtes (Universität Würzburg, DE)
License: Creative Commons BY 4.0 International license © Ingo Scholtes
Joint work of: Ingo Scholtes, Lisi Qarkaxhija, Vincenzo Perri, Franziska Heeg
Graph Neural Networks (GNNs) have become a cornerstone for the application of deep learning to data on complex networks. However, we increasingly have access to time-resolved data that not only capture which nodes are connected to each other, but also when and in which temporal order those connections occur. A number of works have shown how the timing and ordering of links shapes the causal topology of networked systems, i.e. which nodes can possibly influence each other via so-called time-respecting paths that account for the arrow of time [5]. Moreover, higher-order graph models have been developed that allow us to model patterns in the resulting causal topology [4, 3]. Building on these works, we introduce De Bruijn Graph Neural Networks (DBGNNs), a novel time-aware graph neural network architecture for time-resolved data on dynamic graphs. Our approach accounts for temporal-topological patterns that unfold via causal walks, i.e. temporally ordered sequences of links by which nodes can influence each other over time. This enables us to learn patterns in the causal topology of time series data on complex networks, which facilitates to address learning tasks in temporal graphs.
In my talk, I will show how we can use higher-order De Bruijn graph models of time-respecting paths to learn low-dimensional Euclidean representations that capture both temporal and topological patterns in data on temporal graphs. Building on a generalization of graph Laplacians to higher-order De Bruijn graph models [5], I will show how we can use a Laplacian embedding to detect temporal-topological cluster patterns in temporal graphs. I further demonstrate a neural representation learning technique that is based on the De Bruijn Graph Neural Network (DBGNN) architecture [2]. Apart from facilitating node classification it has recently been used to predict temporal node centralities in temporal graphs [1].
References
- [1] Franziska Heeg, Ingo Scholtes: Using Causality-Aware Graph Neural Networks to Predict Temporal Centralities in Dynamic Graphs. CoRR abs/2310.15865 (2023)
- [2] Lisi Qarkahija, Vincenzo Perri, Ingo Scholtes. De Bruijn goes Neural: Causality-Aware Graph Neural Networks for Time Series Data on Dynamic Graphs. Learning on Graphs Conference, LoG 2022, 9-12 December 2022, Virtual Event, Proceedings of Machine Learning Research, Vol. 198 (2022)
- [3] R Lambiotte, M Rosvall, I Scholtes: From networks to optimal higher-order models of complex systems, Nature Physics, Vol. 15, pp. 313-320 (2019)
- [4] Ingo Scholtes: When is a Network a Network?: Multi-Order Graphical Model Selection in Pathways and Temporal Networks. KDD 2017: 1037-1046 (2017)
- [5] Ingo Scholtes, Nicolas Wider, Rene Pfitzner, Antonios Garas, Claudio Tessone, Frank Schweitzer: Causality-driven slow-down and speed-up of diffusion in non-Markovian temporal networks, Nature Communications 5 (2014)
3.24 Guided Data Exploration with (Semi-)Supervised Manifold Learning
Guy Wolf (University of Montreal, CA MILA – Montreal, CA)
License: Creative Commons BY 4.0 International license © Guy Wolf
Modern challenges in exploratory data analysis, especially in biomedical applications involving single cell data, give rise to representation learning techniques that aim to capture intrinsic data geometry (e.g., patterns and structures), while separating it from data distribution that is typically biased by data availability and collection artifacts, thus allowing discovery of rare subpopulations and sparse transitions between meta-stable states. A common approach in this area, which I discuss in this talk, is the construction of a data-driven diffusion geometry that both captures intrinsic structure in data and provides a generalization of Fourier harmonics on it, combining tools and perspectives from a range of fields including manifold learning, graph signal processing, and harmonic analysis. However, most methods following this paradigm rely on unsupervised learning, under the assumption that the target phenomena of interest will form the dominant emergent patterns in the data, uncovered by the extracted representation. While this is the case in certain controlled experiment conditions, such property cannot be guaranteed in many observational services settings. As an alternative, here we discuss semi-supervised approaches that leverage annotations and meta information that often accompanies collected data, in order to guide the data geometry to accentuate task-informed structures in the learned representation. This approach is demonstrated in data exploration tasks including visualization and multimodal data fusion.
4 Participants
-
Michael Bleher – Universität Heidelberg, DE
-
Kerstin Bunte – University of Groningen, NL
-
Corinna Coupette – MPI für Informatik – Saarbrücken, DE
-
Sebastian Damrich – Universität Tübingen, DE
-
Cyril de Bodt – University of Louvain, BE
-
Alex Diaz-Papkovich – Brown University – Providence, US
-
Laleh Haghverdi – Max-Delbrück-Centrum – Berlin, DE
-
Fred Hamprecht – Universität Heidelberg, DE
-
Ágnes Horvát – Northwestern University – Evanston, US
-
Dmitry Kobak – Universität Tübingen, DE
-
Dhruv Kohli – University of California – San Diego, US
-
Smita Krishnaswamy – Yale University – New Haven, US
-
John Aldo Lee – UC Louvain-la-Neuve, BE
-
B.P.F. Lelieveldt – Leiden University Medical Center, NL
-
Leland McInnes – Tutte Institute for Mathematics & Computing – Ottawa, CA
-
Gal Mishne – University of California, San Diego – La Jolla, US
-
Ian Nabney – University of Bristol, GB
-
Maximilian Noichl – Utrecht University, NL
-
Pavlin Poličar – University of Ljubljana, SI
-
Bastian Rieck – Helmholtz Zentrum München, DE
-
Enrique Fita Sanmartin – Universität Heidelberg, DE
-
Benjamin M. Schmidt – Nomic AI – New York, US
-
Ingo Scholtes – Universität Würzburg, DE
-
Guy Wolf – University of Montreal, CA & MILA – Montreal, CA
5 Remote Participants
-
Miguel Á. Carreira-Perpiñán – University of California – Merced, US
![[Uncaptioned image]](x3.jpg)