Multi-Faceted Visual Process Mining and Analytics
Abstract
This report documents the program and the outcomes of Dagstuhl Seminar 25152 “Multi-Faceted Visual Process Mining and Analytics”. The seminar brought together experts from the process mining (PM) community and the visual analytics (VA) community to strengthen the identified synergies of both fields and identify further novel and promising research directions. A particular focus of the seminar was on the challenges arising from the multi-faceted nature of processes and the multi-faceted data to be investigated. The relevant facets include time (when do processes happen), space (where do processes happen), topology (how are processes connected), object centricity (how are processes characterized), uncertainty (what are we unsure about), analytic provenance (how did we obtain our knowledge), and more. This report deals with challenges related to these different data facets, individually and in combination. As a general principle, VA methods are advocated to be an integral part of all phases of the PM process to facilitate a comprehensive multi-faceted data exploration, hypothesis generation, and presentation of results. More concretely, the discussions revolve around several aspects at the crossroads of the two disciplines workflows, including the data facets under analysis, the human factors at play, the catalog of aided tasks, novel combinations of visual, interactive, and computational methods, as well as integration, scalability, and general applicability of the devised solutions.
Keywords and phrases:
human in the loop, process mining, visual analyticsSeminar:
April 6–11, 2025 – https://www.dagstuhl.de/251522012 ACM Subject Classification:
Applied computing Business process management ; Human-centered computing VisualizationCopyright and License:
1 Executive Summary
Claudio Di Ciccio (Utrecht University, NL)
Pnina Soffer (University of Haifa, IL)
Christian Tominski (Universität Rostock, DE)
Katerina Vrotsou (Linköping University, SE)
License: ![]() Creative Commons BY 4.0 International license © Claudio Di Ciccio, Pnina Soffer, Christian Tominski, and Katerina Vrotsou
Creative Commons BY 4.0 International license © Claudio Di Ciccio, Pnina Soffer, Christian Tominski, and Katerina Vrotsou
This Dagstuhl Seminar “Multi-Faceted Visual Process Mining and Analytics” (25152) brought together 27 experts from the Process Mining (PM) and Visual Analytics (VA) communities to Schloss Dagstuhl to work on the challenges arising from the multi-faceted nature of processes and corresponding event log data. The seminar was held from April 6 to 11, 2025 as a follow-up seminar to Dagstuhl Seminar 23271, “Humans in the (Process) Mines” (https://www.dagstuhl.de/23271).
PM is a rapidly growing discipline blending machine learning and data mining concepts with ideas taken from the field of business process management. PM studies event log data to support business process execution for a variety of tasks, from the automated discovery of graphical process models to operational support. VA is a multidisciplinary approach that combines interactive, visual, and analytical methods to make complex data comprehensible, facilitate new insights, and enable knowledge discovery. VA research happens at the intersection of data mining and knowledge discovery, information visualization, human-computer interaction, and cognitive science.
The focus of this seminar was on discussing and investigating the challenges of multi-faceted visual process mining and analytics. The relevant facets include time (when do processes happen?), space (where do processes happen?), topology (how are processes connected?), object centricity (how are processes characterized?), uncertainty (what are we unsure about?), analytic provenance (how did we obtain our knowledge?), and more. The seminar discussed approaches to deal with and gain insight into these different data facets, individually and in combination, and outlined novel ideas and promising directions for future research to further strengthen the synergies of PM and VA.
The seminar started with a general introduction by the seminar organizers. In addition to presenting the general goals of the seminar, the organizers also reflected on the impressive outcomes of the previous seminar, which initiated the collaboration between PM and VA. The general introduction was followed by the introduction of the seminar participants, who briefly stated their background, expertise, and expectations in the seminar.
The first day of the seminar featured a series of expert presentations, mainly introducing the participants to key concepts and methods related to the different data facets. Gennady Andrienko gave an overview of VA for spatio-temporal data, highlighting the need for dedicated visual representations and the aspect of spatial and temporal scale. Hans-Jörg Schulz focused on the topology facet by introducing VA methods for visually analyzing graph structures (or networks). He introduced fundamental network visualization principles and also showcased examples of how the data facets of space and time can be combined with network visualization. The important issues of data quality and uncertainty were presented in the talk by Silvia Miksch. She emphasized different types of uncertainty and data quality problems for temporal, spatial, and network data. She also introduced basic strategies for visually representing uncertainty and discussed insights from user experiments. Claudio Di Ciccio turned the participants’ attention towards an object-centric perspective of processes, where processes are defined through multi-valued entities and relations among them. He introduced the object-centric event data (OCED) meta model as a means to describe processes in an object-centric manner. Finally, Francesca Zerbato gave a detailed introduction to the actual process of PM, which involves various iterative steps, each generating different results and artifacts. She also highlighted the importance of integrating provenance and corresponding analytical tools into the PM process for informed decision-making.
The theoretical aspects conveyed by the talks were supplemented with practical hands-on challenges based on two multi-faceted data sets. The organizers presented a data set from the VAST challenge series addressing a fictitious scenario related to involving people in urban planning and shaping social communities. A second data set was concerned with processes from truck shipment logistics. Both data sets illustrated the richness of multi-faceted processes and the event logs that they create, and indicated the challenges involved in exploring, analyzing, and understanding such processes.

Talks and hands-on challenges were followed by discussions and ideation toward working group formation. The seminar participants brainstormed potential ideas and collected them on the whiteboard (see Figure 1). From a list of about twenty ideas for working groups, five promising topics were merged and crystallized based on relevance, potential impact, and participant preferences. Eventually, the five groups worked on the following topics.
- Group A:
-
Towards Improving Processes Using Multi-Faceted Visual Analysis
- Group B:
-
Progressive Visual Analytics for Streaming Process Mining – VESPA
- Group C:
-
Interactivity: Visual Feedback and Feedforward for Process Exploration
- Group D:
-
Coordinated Projections: A New Approach to Multi-Faceted Process Exploration
- Group E:
-
Towards Visual Process Analytics for Process Ecosystems
Overall, the working groups had about six sessions to work on their topics. During intermediate group reports, all participants had the opportunity to provide feedback and contribute their expertise to all working groups. Moreover, lightning talks were given on specific aspects that arose during the seminar. Natalia Andrienko provided an overview of storyline visualizations for the analysis of event logs, highlighting their use to track the unfolding of processes based on the business objects evolution over time. Philipp Koytek held a demonstration of the object-centric process mining functionalities in the Celonis suite, with a special focus on visualization and user-guided exploration. Iris Beerepoot presented a novel dataset for the seminar attendees to explore pertaining to personal information management, with three years worth of data records tracking and categorizing knowledge workers’ tasks at their workstation.
The final day of the seminar included the presentation of the results of the working groups and set the stage for the official closing of the seminar. The results of the working groups can be read on the following pages of this report. Although the seminar was held in a smaller format with fewer participants (compared to the previous seminars in the series), the reports from the working groups present an impressive amount of creative new ideas for combining PM and VA approaches. Given the success of the collaboration of PM and VA experts, also beyond Dagstuhl, the participants suggested and agreed to submit a proposal for continuing the series of Dagstuhl seminars on combining PM and VA. The planned follow-up seminar shall reflect the fruitful collaboration by merging PM and VA to a new unified research area of Visual Process Analytics (VPA).
2 Table of Contents
3 Overview of Talks
3.1 Visual Analytics of Spatio-Temporal Data
Gennady Andrienko (Fraunhofer IAIS – Sankt Augustin, DE)
License: ![]() Creative Commons BY 4.0 International license © Gennady Andrienko
Creative Commons BY 4.0 International license © Gennady Andrienko
In my presentation entitled “Visual analytics of spatio-temporal data”, I’ve discussed the specifics of space and time and their implication on data analysis. Further on, I presented the main types of spatio-temporal data (events, time series, trajectories) and possible transformations between these representations. I presented major approaches to analysis of spatio-temporal data, including topic modelling, and proposed ideas for adapting these methods for process mining tasks.
3.2 A Primer on Network Visualization
Hans-Jörg Schulz (Aarhus University, DK)
License: ![]() Creative Commons BY 4.0 International license © Hans-Jörg Schulz
Creative Commons BY 4.0 International license © Hans-Jörg Schulz
Network visualizations form an important pillar of visual process analytics, as on one hand many processes can be directly captured in a graph representation (e.g., biological processes as pathways or software processes as UML diagrams), but also indirectly by their effects (e.g., migration flows indicating underlying socio-economic and geopolitical processes). This short primer on network visualization will give an overview of the various ways in which networks can be diagrammatically depicted – including networks with additional attributes and facets, such as geospatial networks or dynamic networks. A collection of the most important overview articles and surveys on the topic rounds off this short presentation.
3.3 Visual Analytics: Data Uncertainty & Quality
Silvia Miksch (TU Wien, AT)
License: ![]() Creative Commons BY 4.0 International license © Silvia Miksch
Creative Commons BY 4.0 International license © Silvia Miksch
Data uncertainty and quality are critical components of visual process analytics, directly influencing the validity, interpretability, trustworthiness, and reliability of analytical processes and outcomes. In this presentation, I will present a conceptual and methodological overview of data uncertainty and quality focusing on sources, taxonomies, visual encoding, temporal and spatial dimensions, models and model comparison, parameter space exploration as well as network visualization. A discussion will conclude with an examination of the challenges and opportunities associated with these approaches.
References
- [1] Wolfgang Aigner, Silvia Miksch, Heidrun Schumann, and Christian Tominski. Visualization of Time-Oriented Data, Second Edition. Springer, 2023.
- [2] Velitchko Filipov, Alessio Arleo, and Silvia Miksch. Are We There Yet? A Roadmap of Network Visualization from Surveys to Task Taxonomies. Computer Graphics Forum, 42(6), 2023.
- [3] Theresia Gschwandtnei, Markus Bögl, Paolo Federico, and Silvia Miksch. Visual Encodings of Temporal Uncertainty: A Comparative User Study. IEEE Transactions On Visualization And Computer Graphics. 22(1): 539-548, 2016.
3.4 Object-Centric Event Data
Claudio Di Ciccio (Utrecht University, NL)
License: ![]() Creative Commons BY 4.0 International license © Claudio Di Ciccio
Creative Commons BY 4.0 International license © Claudio Di Ciccio
Recent trends in process mining research are evidencing a paradigm shift from the classical activity-centric approach, wherein the spotlight is on conducted tasks and events reporting their execution. Lately, the community has recognised the need to give prominence to objects that those activities create, observe, or alter. Hence the name of the new stream: Object-centric process mining. Accordingly, the IEEE Task Force on Process Mining has begun a procedure to establish a new structure and format to record event logs’ information, namely Object Centric Event Data (OCED, https://www.tf-pm.org/resources/oced-standard) standard [1]. The talk revisits the steps that led to the current OCED meta-model, illustrates its rationale, and concludes with a call to action for visual analytics research to join the challenge of making sense of this inherently multi-faceted information source for process mining.
References
- [1] Dirk Fahland, Marco Montali, Julian Lebherz, Wil M. P. van der Aalst, Maarten van Asseldonk, Peter Blank, Lien Bosmans, Marcus Brenscheidt, Claudio Di Ciccio, Andrea Delgado, Daniel Calegari, Jari Peeperkorn, Eric Verbeek, Lotte Vugs, Moe Thandar Wynn. Towards a Simple and Extensible Standard for Object-Centric Event Data (OCED) – Core Model, Design Space, and Lessons Learned. CoRR abs/2410.14495, 2024
3.5 The Process of Process Mining and Provenance
Francesca Zerbato (TU Eindhoven, NL)
License: ![]() Creative Commons BY 4.0 International license © Francesca Zerbato
Creative Commons BY 4.0 International license © Francesca Zerbato
Joint work of: Francesca Zerbato, Andrea Burattin, Hagen Völzer, Paul Nelson Becker, Elia Boscaini, Barbara Weber
The process of process mining is emergent, insight-driven, and knowledge-intensive. Process analysts engage in iterative steps, generating diverse results and artifacts that must be validated and reproduced for purposes such as storytelling and auditing. However, current process mining methods and tools offer limited support for managing these evolving workflows. In this talk, we explore how integrated provenance and data views can support analysts by enabling reflection in action, informed decision-making, and traceability of results back to raw data. We conclude with a call to the process mining and visual analytics communities to advance this area by addressing key questions: What types of provenance are most useful for process analysts? How can we make provenance information accessible and actionable? And how should it be effectively visualized?
References
- [1] Francesca Zerbato, Andrea Burattin, Hagen Völzer, Paul Nelson Becker, Elia Boscaini, and Barbara Weber. Supporting provenance and data awareness in exploratory process mining. In International Conference on Advanced Information Systems Engineering, pages 454–470. Springer, 2023.
3.6 Storyline Visualizations for Object-Oriented Process Analysis
Natalia V. Andrienko (Fraunhofer IAIS – Sankt Augustin, DE)
License: ![]() Creative Commons BY 4.0 International license © Natalia V. Andrienko
Creative Commons BY 4.0 International license © Natalia V. Andrienko
In my lightning talk, I addressed the challenge of object-oriented process analysis, which requires not only tracing process flows but also understanding the roles and interactions of the objects involved. I proposed that storyline visualizations, which are commonly used to depict evolving relationships between entities over time, could possibly serve for this purpose. To illustrate this, I presented examples of storyline visualizations from recent research papers. Additionally, I mentioned the potential of the Marey chart, originally developed for visualizing train timetables, as another suitable approach for representing object lifelines and their involvement in process events. These visual approaches may support better comprehension of complex, multi-object process dynamics.
4 Working groups
4.1 Towards Improving Processes Using Multi-Faceted Visual Analysis
Zhicheng Liu (University of Maryland – College Park, US), Wolfgang Aigner (FH – St. Pölten, AT), Lena Cibulski (Universität Rostock, DE), Marie-Christin Häge (Universität Mannheim, DE), and Pnina Soffer (University of Haifa, IL)
License: ![]() Creative Commons BY 4.0 International license © Zhicheng Liu, Wolfgang Aigner, Lena Cibulski, Marie-Christin Häge, and Pnina Soffer
Creative Commons BY 4.0 International license © Zhicheng Liu, Wolfgang Aigner, Lena Cibulski, Marie-Christin Häge, and Pnina Soffer
Motivation
Improving processes has for long been one of the aims of process mining analysis [3]. In this report, we explore the ways by which multi-faceted visual analysis of process data can contribute to process improvement. To design meaningful visualizations that solve real-world problems such as process improvement, we need to characterize the goals and tasks that are to be accomplished and thus frame the visualization use [2].
Description of Method and Dataset
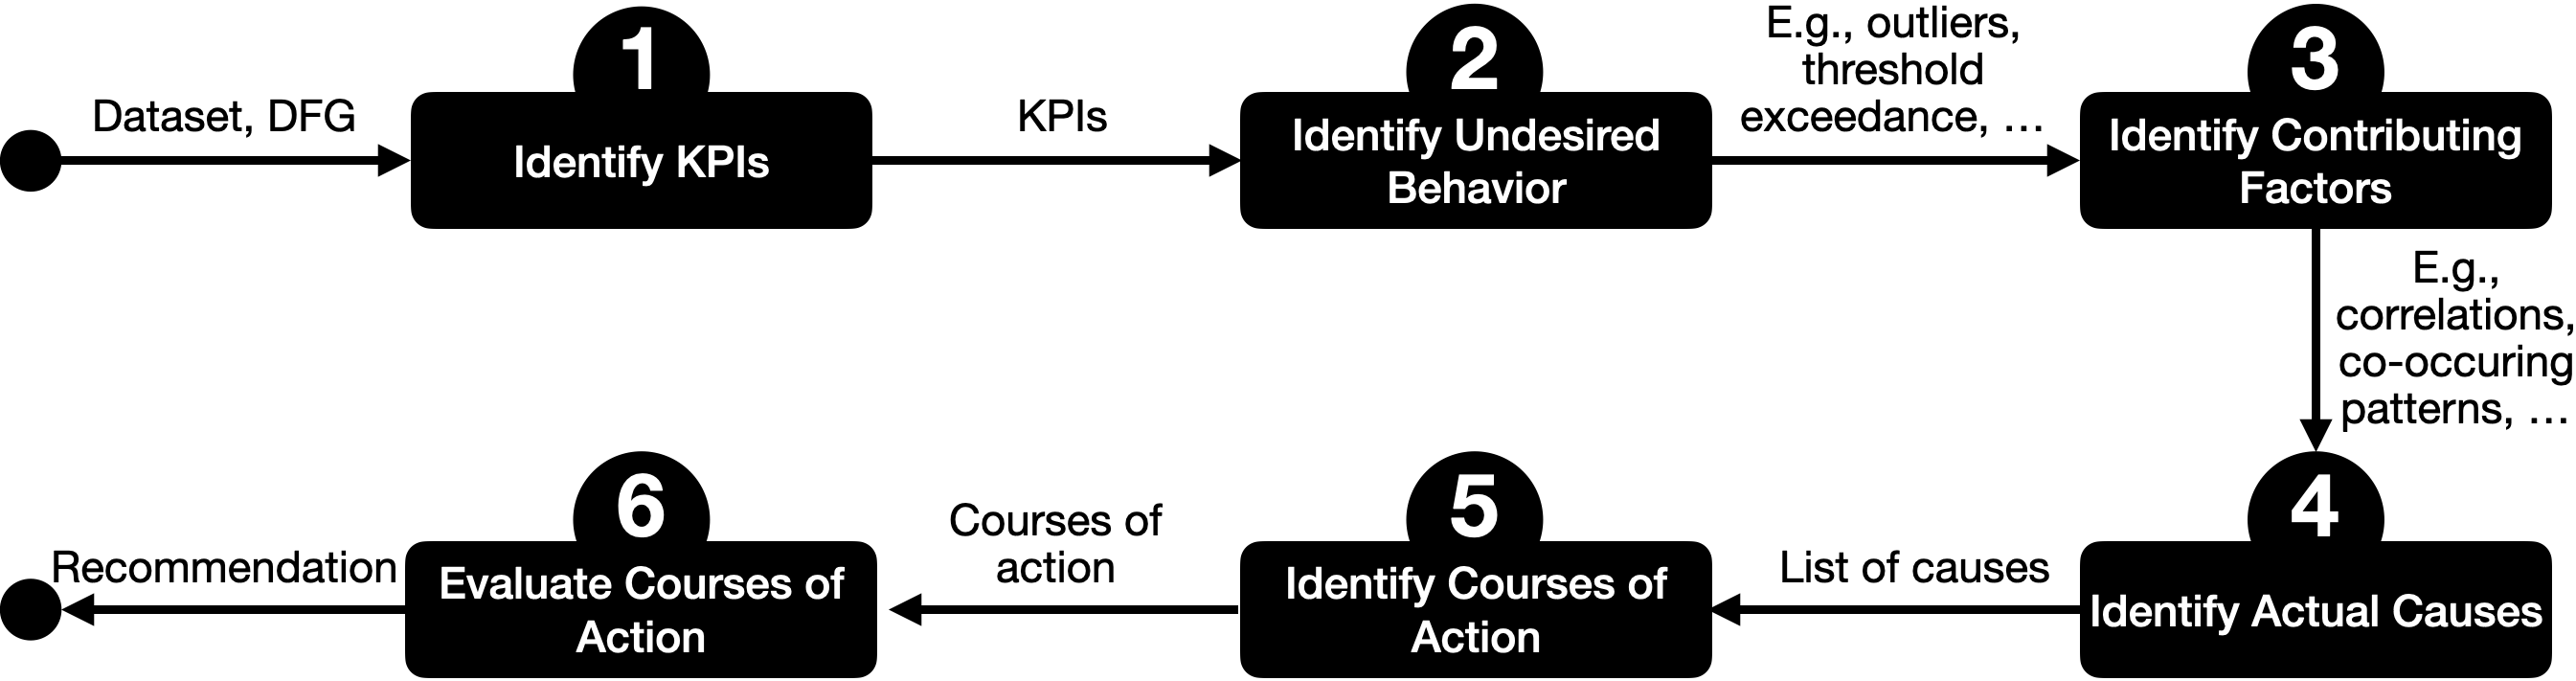
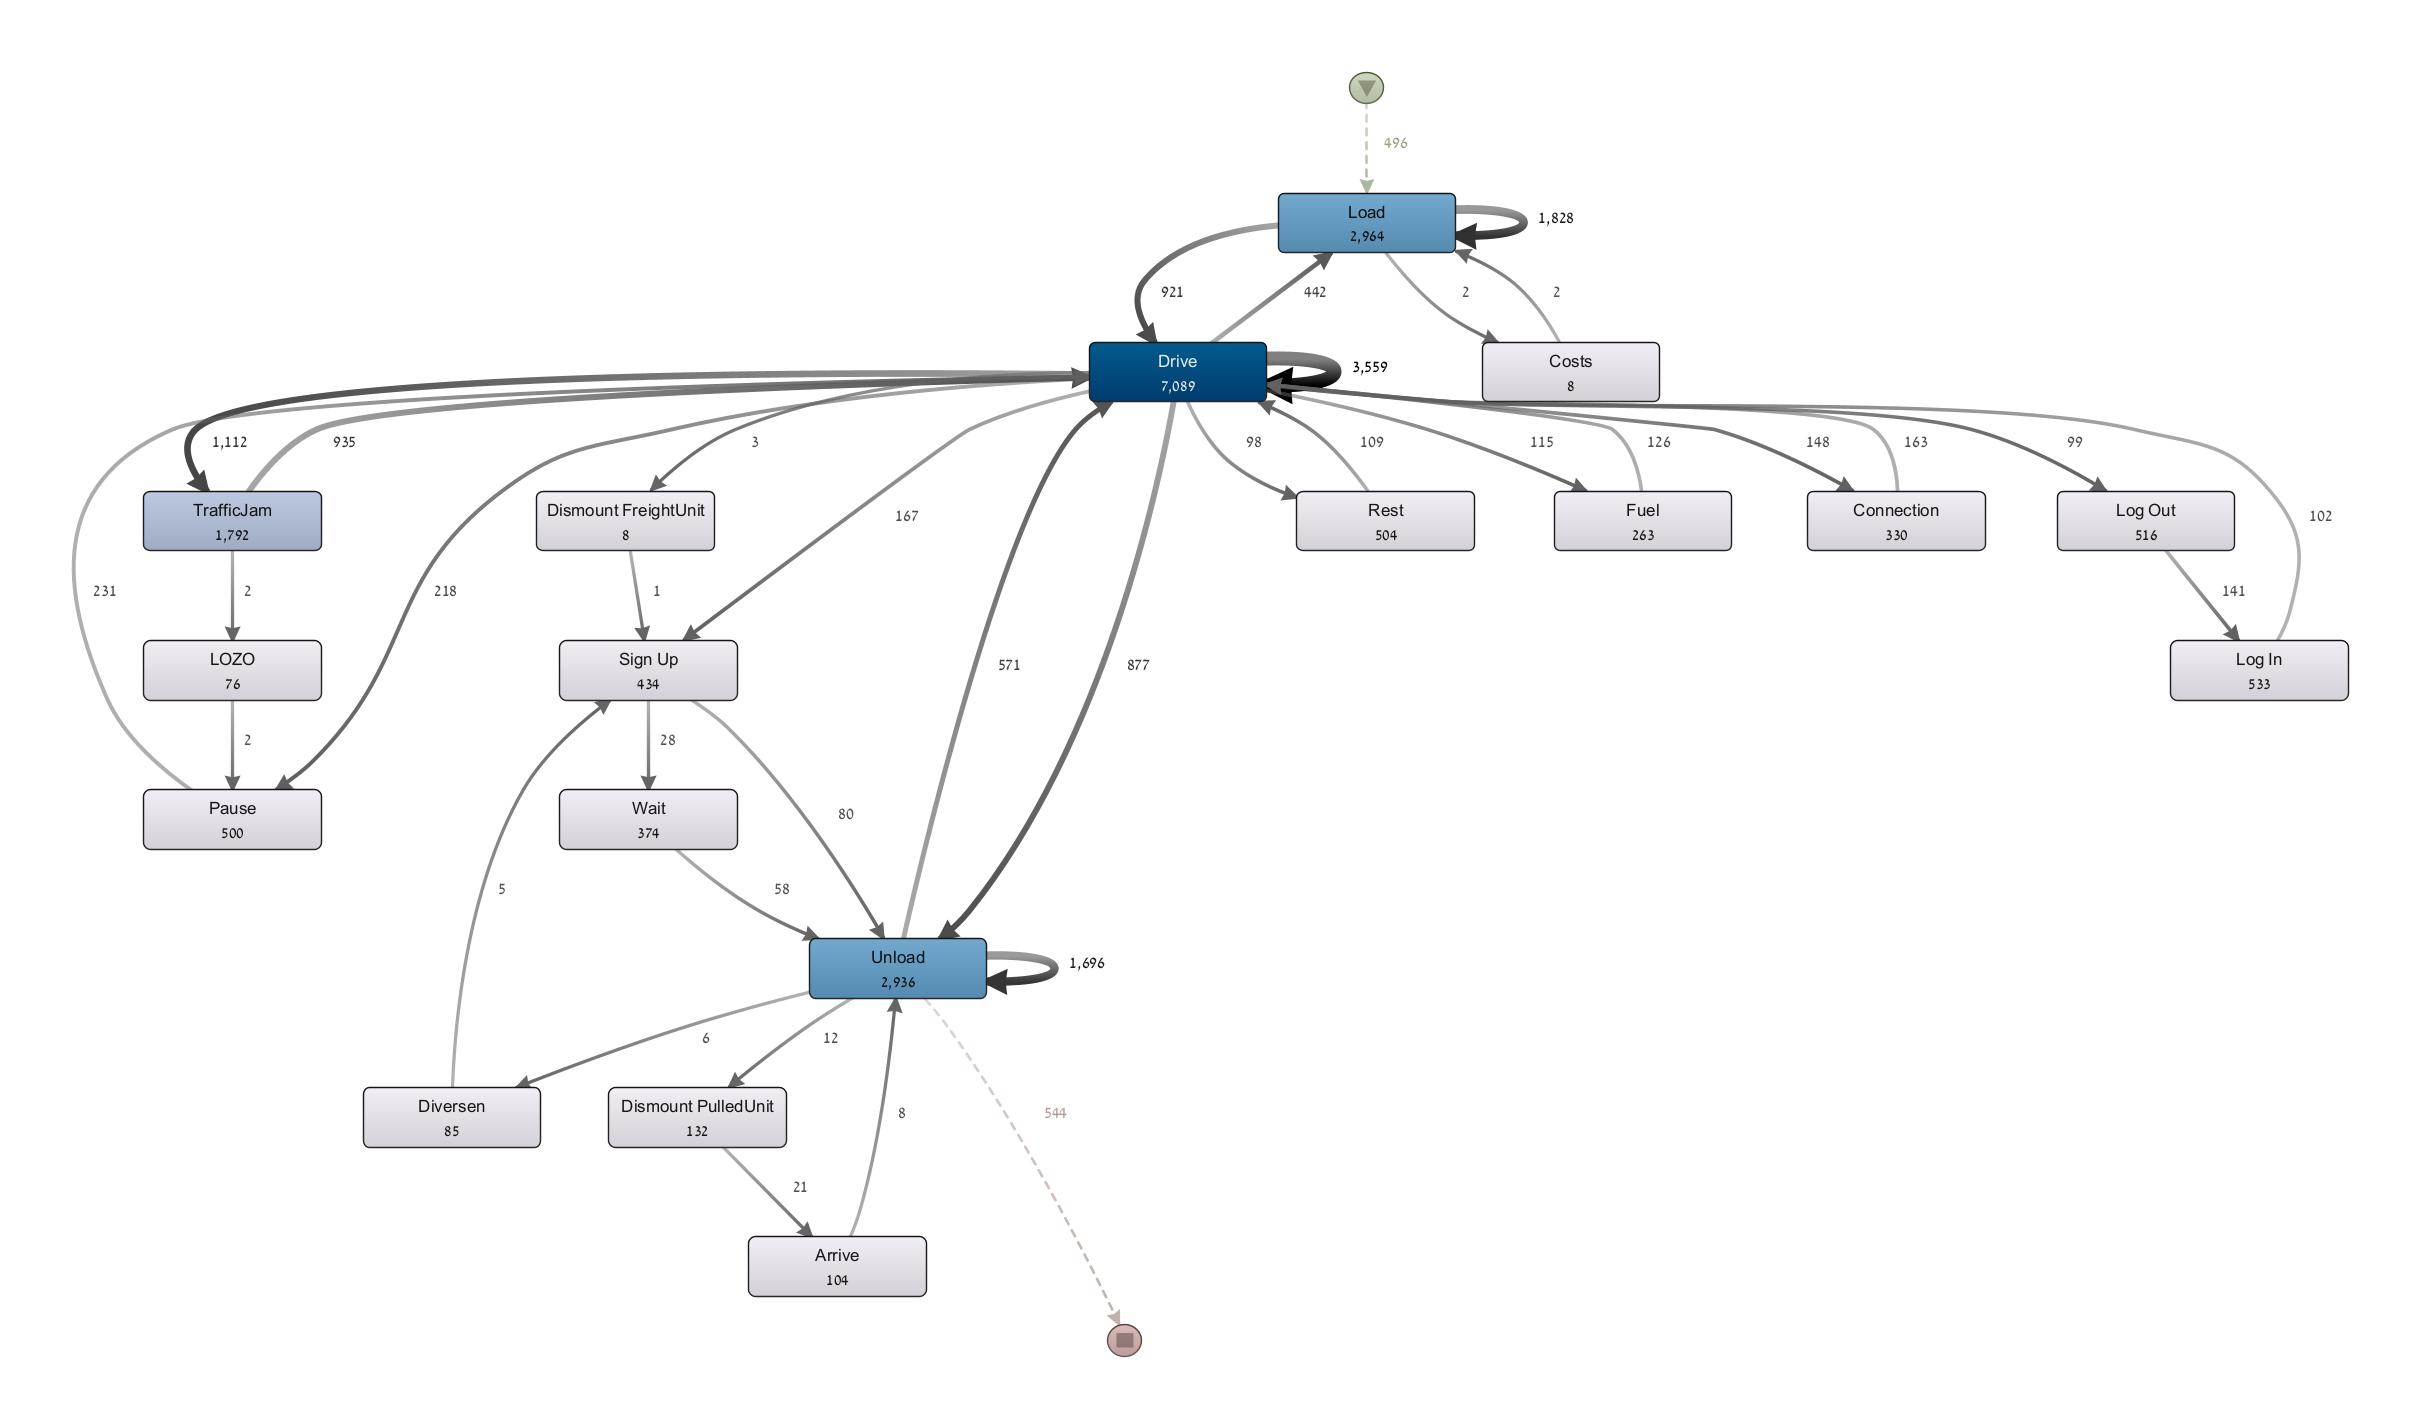
We approach this by breaking down the task of process improvement into six sub-tasks (see Figure 2). Following the task abstraction by Tominski and Schumann [1], we then characterize each sub-task by describing four key aspects: goals (i.e., the overarching intent), analytical questions (i.e., what is to be investigated), targets (i.e., which specific data we need to look at to complete that sub-task), and means (i.e., how a sub-task might be performed). We demonstrate exemplary instantiations of the six sub-tasks by providing a case study of the Logistic dataset 2014666https://drive.google.com/drive/folders/17F94erxk4KveMpKbnXCEOwBbhnUQkRzI?usp=sharing. The data set includes information about trucks delivering shipments across Europe between 23.03.2014 and 30.03.2014. Besides basic event information (event type and timestamps) it also includes spatial (latitude, longitude, and mileage) and speed information, which can be utilized for a multi-faceted analysis. We extracted the process flow from the data using Disco777https://fluxicon.com/disco/ and depicted it using a process map (see Figure 3), but the insights that can be drawn from it are very limited.
In what follows, we describe a case study based on the Logistics data set to demonstrate each of our identified sub-tasks and its outcomes.
Case Study: Truck Shipment Log
-
1.
Identify KPIs
While different KPIs can be identified for this process, we note that these apply to three main facets:
-
Time (as an absolute measure, with respect to the distance passed, or considering an agreed upon delivery time)
-
Distance (as an approximation of fuel consumption)
-
Compliance (with respect to defined company policies or external regulations)
-
-
2.
Identify undesirable behavior with respect to identified KPIs
-
Compliance. Shipments exceeding reference values as dictated by regulations, e.g., driving times longer than allowed (see Figure 4).
-
Time and Distance. (Statistical) outliers with respect to distance and duration (see Figure 5).
-
Compliance. Routes crossing regions in a certain time period, e.g., routes should go through Paris on Sundays (see Figure 6).
-
Time. Shipments that arrive at the destination after the estimated time of arrival.

Figure 4: This plot depicts the durations of each driving section that a truck’s shipment route is composed of. The red line reflects the regulation that drivers are not allowed to drive more than four hours (i.e., 240 min.) non-stop. Durations to the right of this line thus represent sections of a shipment route that violate the regulations. 
Figure 5: This scatter plot depicts driving sections (not entire shipment routes) over distance driven and duration. Most driving sections follow a linear relationship. However, five driving sections deviate from that in being rather short in terms of distance but still exhibiting significant driving time. Similarly, one driving section (in the upper right corner) deviates in showing exceptional distance as well as duration. 
Figure 6: This map depicts all shipments ending in Paris. Routes that enter Paris during prohibited time periods according to heavy traffic bans (i.e., on Sundays) are highlighted in red. -
-
3.
Identify contributing factors, i.e., potential explanations for identified undesired behavior
-
(a)
What activities are associated with cases that exhibit long driving hours, i.e., occur in the same shipment? Answer: we find that cases with long driving hours contain time periods of low to zero speed Possible explanation: lower speed due to traffic jam(s) needs to be compensated by longer driving hours to still arrive at the destination on time
-
(b)
What activities are associated with cases that exhibit long driving hours, i.e., occur in the same shipment? Answer: we find that low speeds occur more frequently shortly before a break is due in cases with long driving hours than with other cases Possible explanation: being stuck in a traffic jam does not allow drivers to take a break
-
(c)
What activities are associated with cases that exhibit delayed shipment? Answer: we find that delayed shipments are associated with time periods exhibiting zero to low speed Possible explanations: 1) traffic jam or 2) serious breakdown of the truck
-
1): Traffic jams can occur multiple times along the shipment route
-
2): A serious breakdown is unlikely to occur multiple times along the same shipment route
-
-
(d)
What activities are associated with cases that exhibit delayed shipment? Answer: we find that delayed shipments are associated with exceptionally large distances Possible explanations: driver took a detour to 1) avoid closed roads, 2) avoid steep roads during a snow storm, or 3) avoid forbidden roads (regulations)
shipment route numbers with large distances: 100001081854, 100001081380, 100001084371
-
(a)
-
4.
Identify actual causes
-
3a and 3b: Do the time periods exhibiting low speeds correspond to external reports of traffic jams?
-
3c:
-
–
1) Does the data show multiple time periods with low speed? If yes, this hints at traffic jam being the root cause, if not, this hints at a potential breakdown
-
–
2) Is there a bill documentation available that reports a repair during the shipment?
-
–
-
3d:
-
–
1) Look up official information about road closings during the respective time periods
-
–
2) Collect external data about the slope of roads as well as weather (temperature or snow falling). Was the shipment route passing steep road sections during snowfall (see Figure 7)?
-
–
3) Collect information about which regions cannot be passed during certain time frames, e.g., Paris on Sundays between 10pm and midnight or Mondays between 6am and 10am.
-
–

Figure 7: This line graph shows the original route as well as the detour considering time (x-axis) and elevation (y-axis). It highlights with the color how the temperature changes during the delivery. 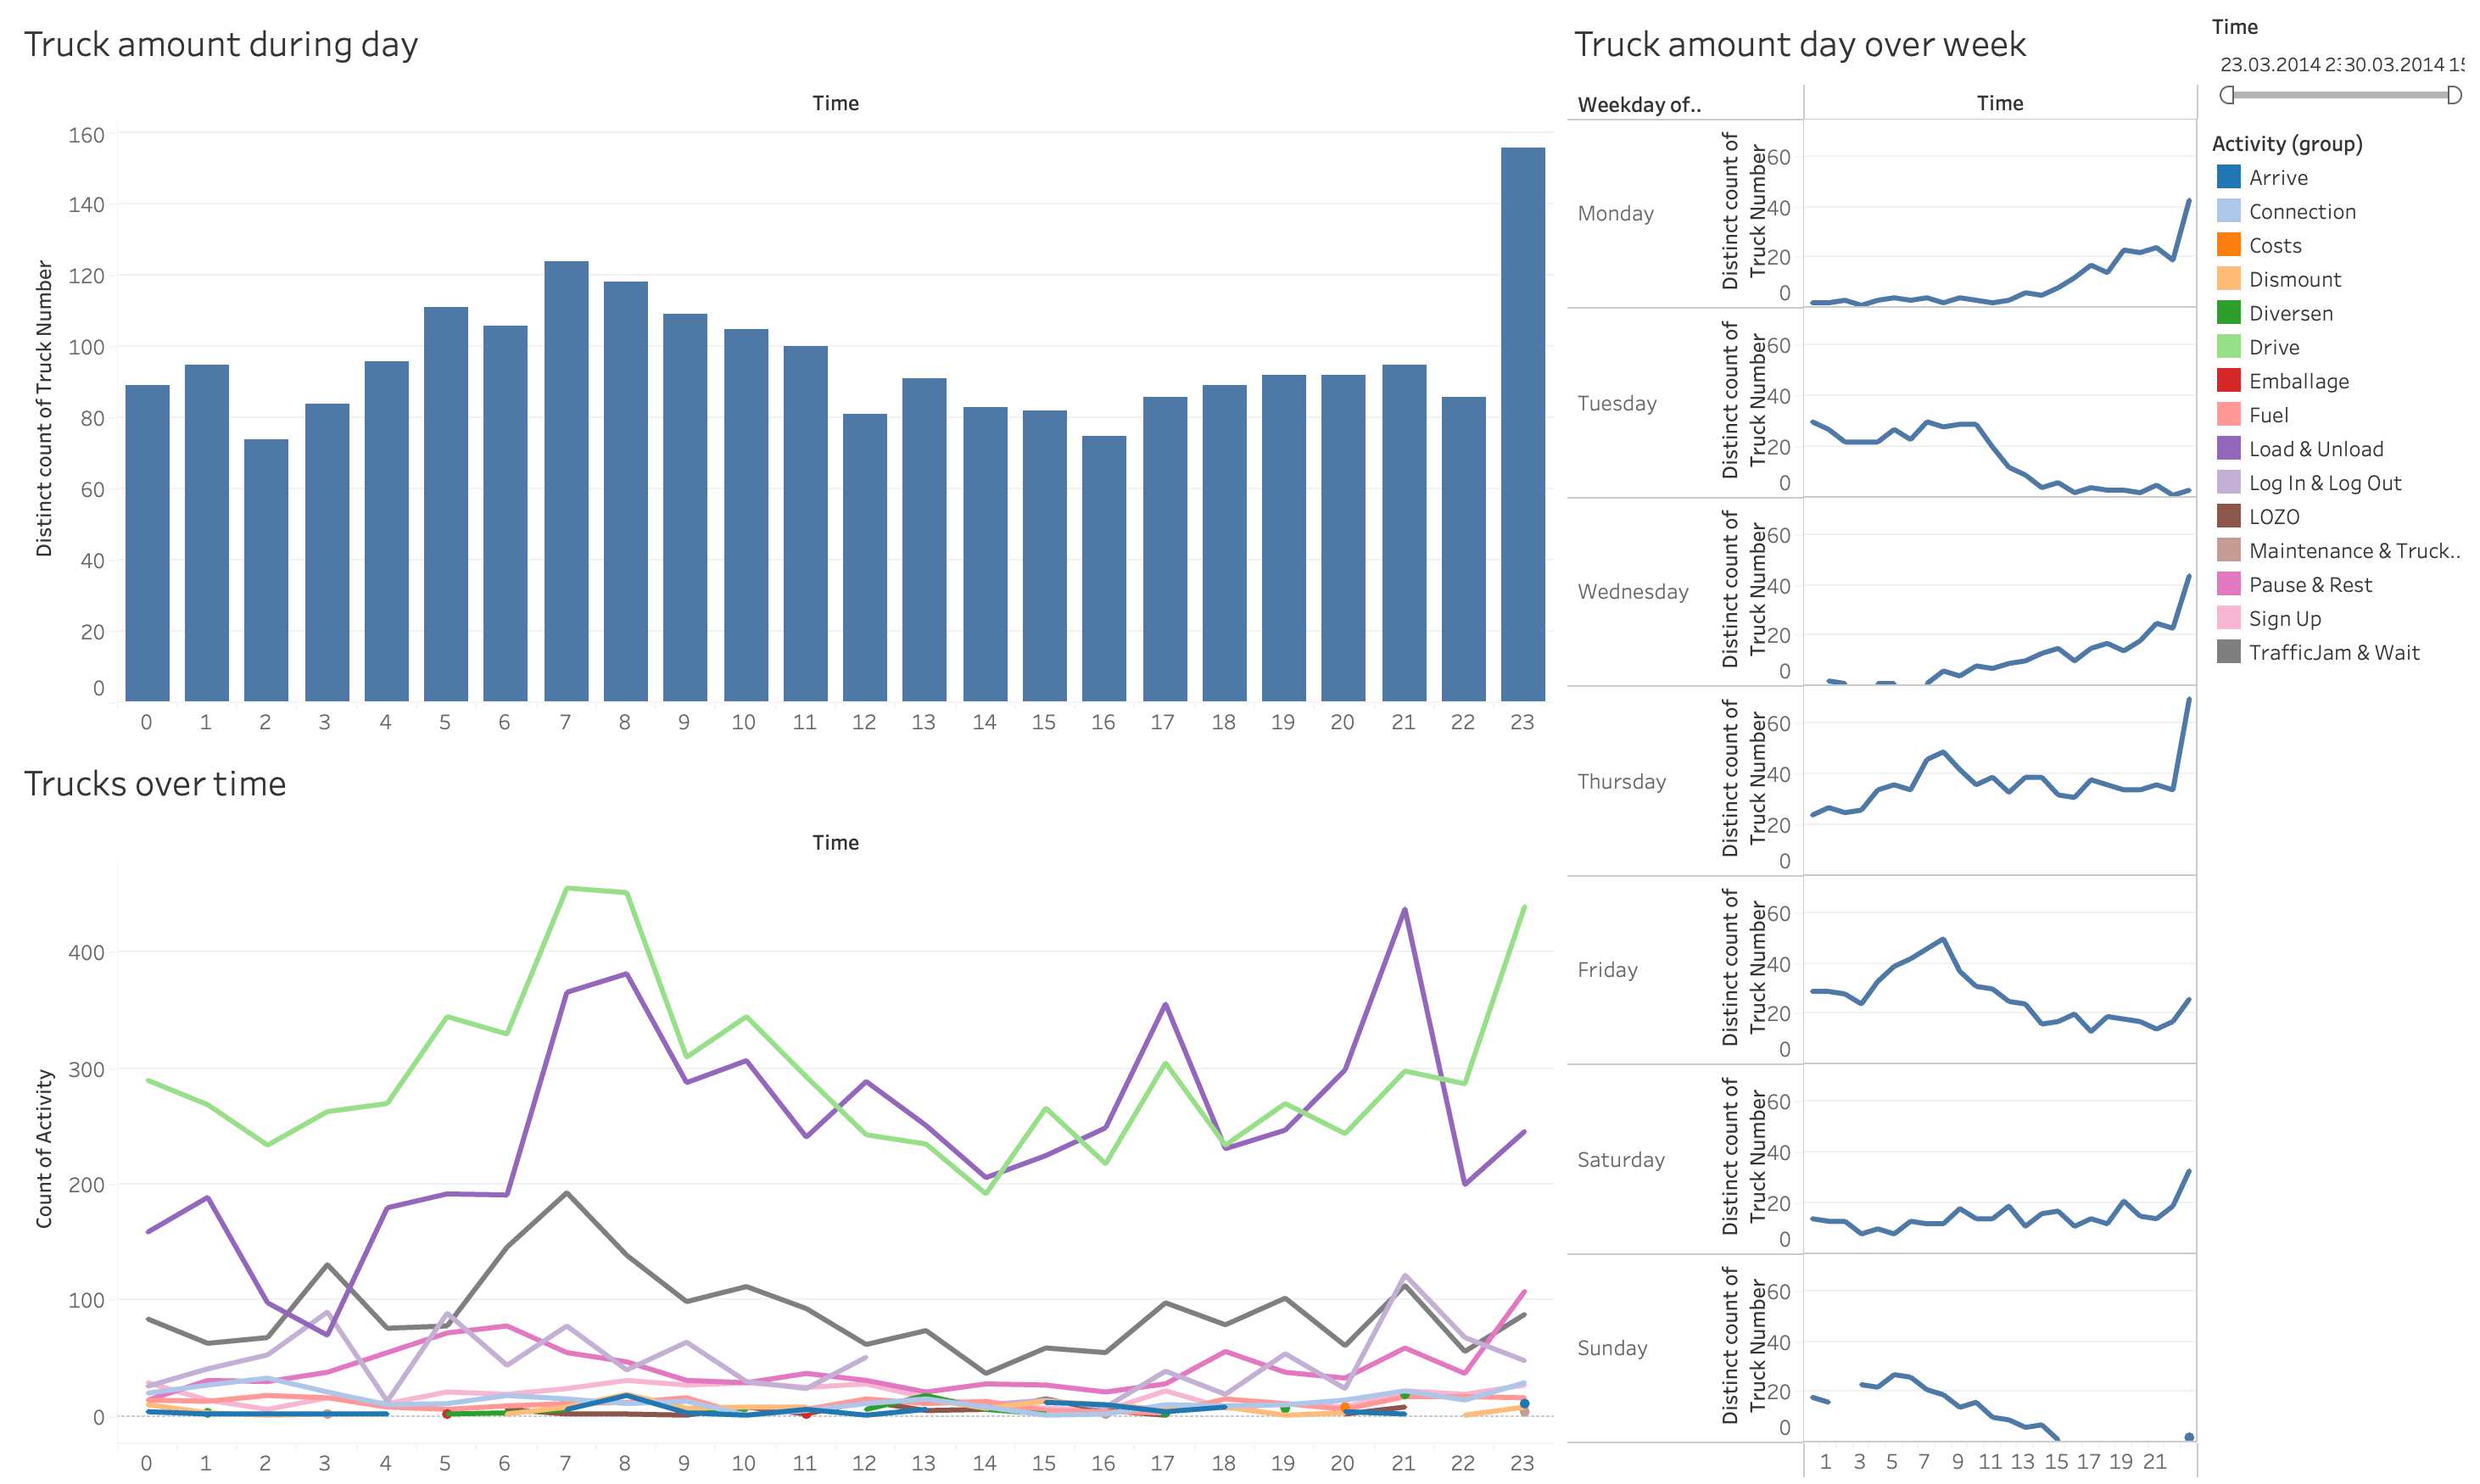
Figure 8: Top left: bar chart showing the number of trucks in operation across the time of day. The peak at midnight is clearly distinguishable. We also see a slight peak around 7am. Bottom left: The distribution of operating trucks across time of day broken down by activity type. The drive (green), load/unload (purple), and traffic jam activities (dark grey) show behavior similar to the bar chart. Right: distribution of recorded activities for each week day. Interestingly, the distribution on Tuesday does not follow the common pattern that shows a peak towards midnight. -
-
5.
Generate possible courses of actions that help eliminate the identified causes
In order to mitigate unwanted behavior in the processes under consideration, several approaches can be considered. In our case study of truck shipment data, the following aspects are relevant:-
3c Traffic Jam:
-
–
Reschedule departures or deliveries to off-peak hours, such as early morning or late night, when traffic is typically lighter (see Figure 8). This helps to avoid congestion and ensures faster transit times.
-
–
Pre-plan multiple route options for high-traffic corridors to provide flexibility in case of unexpected delays. Having alternative routes ready can significantly reduce delivery time during peak traffic hours.
-
–
-
3c Breakdown:
-
–
Implement a Preventive Maintenance Program and schedule regular inspections to ensure vehicles remain in optimal working condition. This reduces the likelihood of breakdowns during operations.
-
–
Equip trucks with diagnostic sensors that monitor real-time engine health, tire pressure, battery condition, and fluid levels. These sensors provide early warnings for potential issues, allowing for proactive maintenance.
-
–
Train drivers on basic maintenance techniques and how to detect early signs of mechanical problems. This training empowers drivers to address minor issues on the road and report major concerns promptly.
-
–
-
3d Road Closing:
-
–
Subscribe to local transportation authority alerts to stay informed about planned or emergency road closures. This ensures that dispatchers are aware of disruptions as they occur.
-
–
Train dispatchers to respond quickly to road closures by adjusting delivery plans in real time. This includes rerouting vehicles and communicating changes effectively to drivers.
-
–
Provide drivers with tools, such as GPS systems or mobile apps, and the authority to reroute themselves when necessary. Drivers should base their decisions on verified guidance to avoid further delays or complications.
-
–
-
3d Inclement Weather (e.g., Snowfall):
-
–
Equip vehicles for winter driving by installing snow tires, chains, or other necessary equipment. Perform seasonal maintenance checks before winter begins to ensure vehicles are prepared for adverse weather conditions.
-
–
Include buffer time in delivery schedules during winter months to account for potential delays caused by snowfall or icy roads. This ensures that delivery commitments can still be met despite challenging weather conditions.
-
–
-
3d Regulations on Forbidden Roads:
-
–
Use regulation-aware routing software that accounts for various restrictions, including truck-specific limitations such as height, weight, and HAZMAT routes; time-based restrictions like no deliveries during school hours; and restricted access zones such as pedestrian areas or Low Emission Zones (LEZs). This ensures compliance with local regulations while optimizing delivery routes.
-
–
Apply for permits or exceptions where available to gain access to restricted areas when necessary. This is particularly useful for special deliveries that cannot avoid these zones.
-
–
Pre-plan delivery schedules and routes that avoid restricted areas or times whenever possible. Use geofencing technology to flag or block dispatch routes that intersect forbidden roads, ensuring drivers follow compliant paths at all times.
-
–
-
-
6.
Evaluate courses of action As a final step, possible courses of action need to be critically evaluated and reflected. These considerations include aspects like:
-
Cost-Benefit Ratios and Conflicting KPIs: Taking a detour to not cross prohibited regions might avoid fines but involves increased cost for fuel and longer driving times. Similarly, a detour that avoids a traffic jam or closed road to still deliver the goods on time involves increased cost for fuel.
-
Infeasible Actions: Measures requiring additional resource allocation, such as increasing the number of trucks and drivers, might not be feasible due to budget constraints.
-
Trade-off: As conflicting KPIs prevent the existence of an obvious optimal course of action, decision-makers are required to find compromises. When facing a traffic jam, for example, a longer duration when staying on the road needs to be carefully balanced with the increased distance and risk of other issues when leaving the road to bypass the traffic jam.
-
Reflections
Through the systematic case study on the logistics dataset, we identify sub-tasks of process improvement that highlight the need for multi-faceted visual analysis support. Interactive visualizations can support the identification of process improvement opportunities from event logs as well as external factors including domain knowledge and experience. Identifying the relevant KPIs provides an initial indication of the relevant data facets to be explored. While our characterization revealed sub-tasks not relying on visualization, we give examples of visual representations that depict the relevant data facets and their combinations for the identification of undesired behavior, its potential explanations, and actual causes. We note that traditional process mining analysis typically focuses on the temporal dimension, activity ordering (i.e., the control flow), and resources. Our characterization reveals additional facets and their combinations that, coupled with an interactive visual analysis, enable a more comprehensive analysis for the purpose of process improvement.
References
- [1] Christian Tominski and Heidrun Schumann. Interactive Visual Data Analysis. AK Peters Visualization Series. CRC Press, 2020.
- [2] Michael Sedlmair, Miriah D. Meyer, and Tamara Munzner. Design Study Methodology: Reflections From the Trenches and the Stacks. In IEEE Trans. Vis. Comput. Graph. 18(12): 2431-2440, 2012.
- [3] Kateryna Kubrak, Fredrik Milani, and Alexander Nolte. A visual approach to support process analysts in working with process improvement opportunities. In Bus. Process. Manag. J. 29(8): 101-132, 2023.
4.2 Progressive Visual Analytics for Streaming Process Mining – VESPA
Andrea Burattin (Technical University of Denmark – Lyngby, DK), Silvia Miksch (TU Wien, AT), Shazia Sadiq (University of Queensland – Brisbane, AU), Hans-Jörg Schulz (Aarhus University, DK), and Katerina Vrotsou (Linköping University, SE)
License: ![]() Creative Commons BY 4.0 International license © Andrea Burattin, Silvia Miksch, Shazia Sadiq, Hans-Jörg Schulz, and Katerina Vrotsou
Creative Commons BY 4.0 International license © Andrea Burattin, Silvia Miksch, Shazia Sadiq, Hans-Jörg Schulz, and Katerina Vrotsou
4.2.1 Introduction and Motivation
Consider the real-time decision-making needed when managing a busy emergency response (ER) department. Patients are coming in and undergo a particular sequence of diagnosis and possibly also treatment steps that can be conceptually captured as a process model, which may change depending on the time of day (working hours vs. after hours) and case load (business as usual vs. state of emergency). The head of the department needs to monitor the current intake, throughput, and related KPIs, like the length of stay (LOS) or ward load (WL) to decide in real time whether to allocate additional resources (activate on-call doctors), to fast-track certain patients (increase their urgency levels), explicitly switch from the usual procedures to the streamlined emergency procedures or back, etc.
To support time-critical decisions, like these in real-time scenarios, we propose to combine streaming process mining with progressive Visual Analytics (VA).
Streaming Process Mining (SPM).
To tackle the scenario above-mentioned, an “offline” process mining approach would not be suitable, as it is not capable of delivering real-time results. Streaming process mining [4] techniques, on the other hand, have emerged to handle these situations. In a streaming setting, events are processed, immediately after they are generated, by a streaming process mining pipeline and the corresponding (intermediate) results are made available.
Streaming process mining algorithms can be used to handle the control-flow discovery, where the control-flow is expected to represent the process currently being executed [6]. Another problem that can be tackled is streaming conformance checking [7], where the conformity of each event is verified against a corresponding reference model.
Progressive Visual Analytics (PVA).
This concept is a flavor of VA that is tailored to sensemaking using partial intermediate computational results and visualizations [2, 9]. While these partial results are usually the outcome of some technical process (e.g., a running computation that refines its output over time or a complex data query that yields more and more matching data over time) – partial results can also be the result of a natural or organizational process.
In the given example, the progressive nature of the data stems from the fact that none of the currently treated patients in the ER have yet completed the process, being at some intermediate stage of it. If they complete the process and are either discharged or administered to a ward, we would have all their information in full, but that information is no longer relevant as they are not at the ER anymore. This means that the head of the ER department must make organizational decisions based on these incomplete patient trajectories, which yields a unique PVA scenario akin to Transient Visual Analytics – i.e., PVA with regression, which is a “forgetting” of data after a while [17].
Coupling Guidance and Progressiveness in VA Model.
Guidance in VA is characterized as an active process addressing “knowledge gaps” of the users that hinder their analytical progress by identifying them and providing orienting, directing, and prescriptive guidance [8]. In Figure 9, we present a systematic view of how guidance and progressiveness can be coupled (for more detail, see [16]).
4.2.2 Our Approach: VESPA
In developing our approach VESPA (Visual Event-Stream Pro[gressive|cess] Analytics), we considered the characteristics of our problem space, which includes SPM, PVA, and expectation of a multi-faceted problem. Our discussion revealed the dimensions of the problem space as provided below. We observed a natural connection between the streaming nature of the process and the value of progressiveness toward providing intermediate (partial) results. The dimensions further allowed us to articulate two research questions relating to timing and appropriateness of the visualization (and interaction).
Dimensions of the Problem Space
-
1.
Context, i.e Business Process
-
2.
Task, e.g conformance checking or process enhancement
-
3.
Data space assumes at least an event log but it could be augmented with other facets relevant to the problem
-
4.
Algorithm space, i.e. the specific algorithm relevant to the task
-
5.
Guards/ Rules [11] that signal potential attention trigger for users
- 6.
- 7.
Research Questions.
We defined two research questions (RQs) relating to the timing and the effectiveness, efficiency, and appropriateness of progressive visual analytics. The questions are posed in the context of an SPM setting, and hence, there is an expectation of a continuous flow of events.
-
RQ1. What are the required time points for progressive visualization for streaming process mining?
Identification of time points is related to the needs of the analytical intention of the user. We identified three needs which may arise at different time points and refer to them as scheduled, triggered and on demand as explained below:
-
–
Scheduled (e.g., results are ready)
-
–
Triggered (e.g., a guard/rule fires when a conformance score is falling below threshold)
-
–
On demand (e.g., an explorer wants to probe on a particular facet such as the trend in urgency levels)
The time points in turn will influence the suitability of the visualization and interaction which leads us to our second research question.
-
–
-
RQ2. What are the effective, efficient, and appropriate progressive visualizations and interactions for streaming process mining?
Expressiveness refers to the requirement of showing exactly the information contained in the data; nothing more and nothing less must be visualized [12]. Effectiveness primarily considers the degree to which visualization addresses the cognitive capabilities of the human visual system, but also the task at hand, the application background, and other context-related information, to obtain intuitively recognizable and interpretable visual representations [12]. Finally, appropriateness involves a cost-value ratio in order to assess the benefit of the visualization process with respect to achieving a given task [19].

VESPA’s Architecture.
The overall approach is proposed to be embedded in a software architecture as provided in Figure 11. The continuous event stream is a key feature of the problem space. Depending on the velocity of the event stream, there may or may not be a persistent storage and hence the system architecture presents it as a ’transient’ event log. A process mining tool is selected based on the task e.g. conformance checking. In addition to the discovered process, the proposed system architecture also produces a process mining results dataset. This includes details such as conformance scores and multi-facted event data. When needed, the transient event log may also be used to produce some basic aggregations such as patient load over a period of time. Together the aggregations and the process mining results constitute a curated dataset that forms the input to the visualization component. The results from the visualization component are expected to empower users to perform a range of tasks from monitoring all the way to interactive exploration to support timely (or even real-time) decision making.
4.2.3 Preliminary Results
We outline a user story expressed in two levels of detail to frame and guide our VESPA approach.
-
Patient-centric: As an ER administrator, I want to know if the LOS (length of stay) for one ER patient is too high so that I can prioritize them in the waiting queue.
-
Ward-centric: As an ER administrator, I want to know if the overall LOS for a cohort of (or all) ER patients is too high or too low so I can adjust the allocation of resources.
This user story manifests in the problem dimensions as below:
-
1.
Context: Healthcare
-
2.
Task: Primarily we will focus on conformance checking, but this is intended to be augmented with relevant facets
-
3.
Data space: A synthetic purpose-built event log has been generated using ChatGPT 4.0 (see Figure 12 and further explanation below)
-
4.
Algorithm space: We use behavioral conformance checking (BCC) [7]
-
5.
Guards/Rules: Three rules are considered: conformance falling below threshold; a load of an urgent category (critical/high) increasing over a threshold; and the LOS of a given patient increasing over a threshold
-
6.
Users: Interchangeable roles of Observers, Searchers, Explorers
-
7.
Visualization and Interaction space is aligned with the two user stories of patient-centric and ward-centric with more details provided below
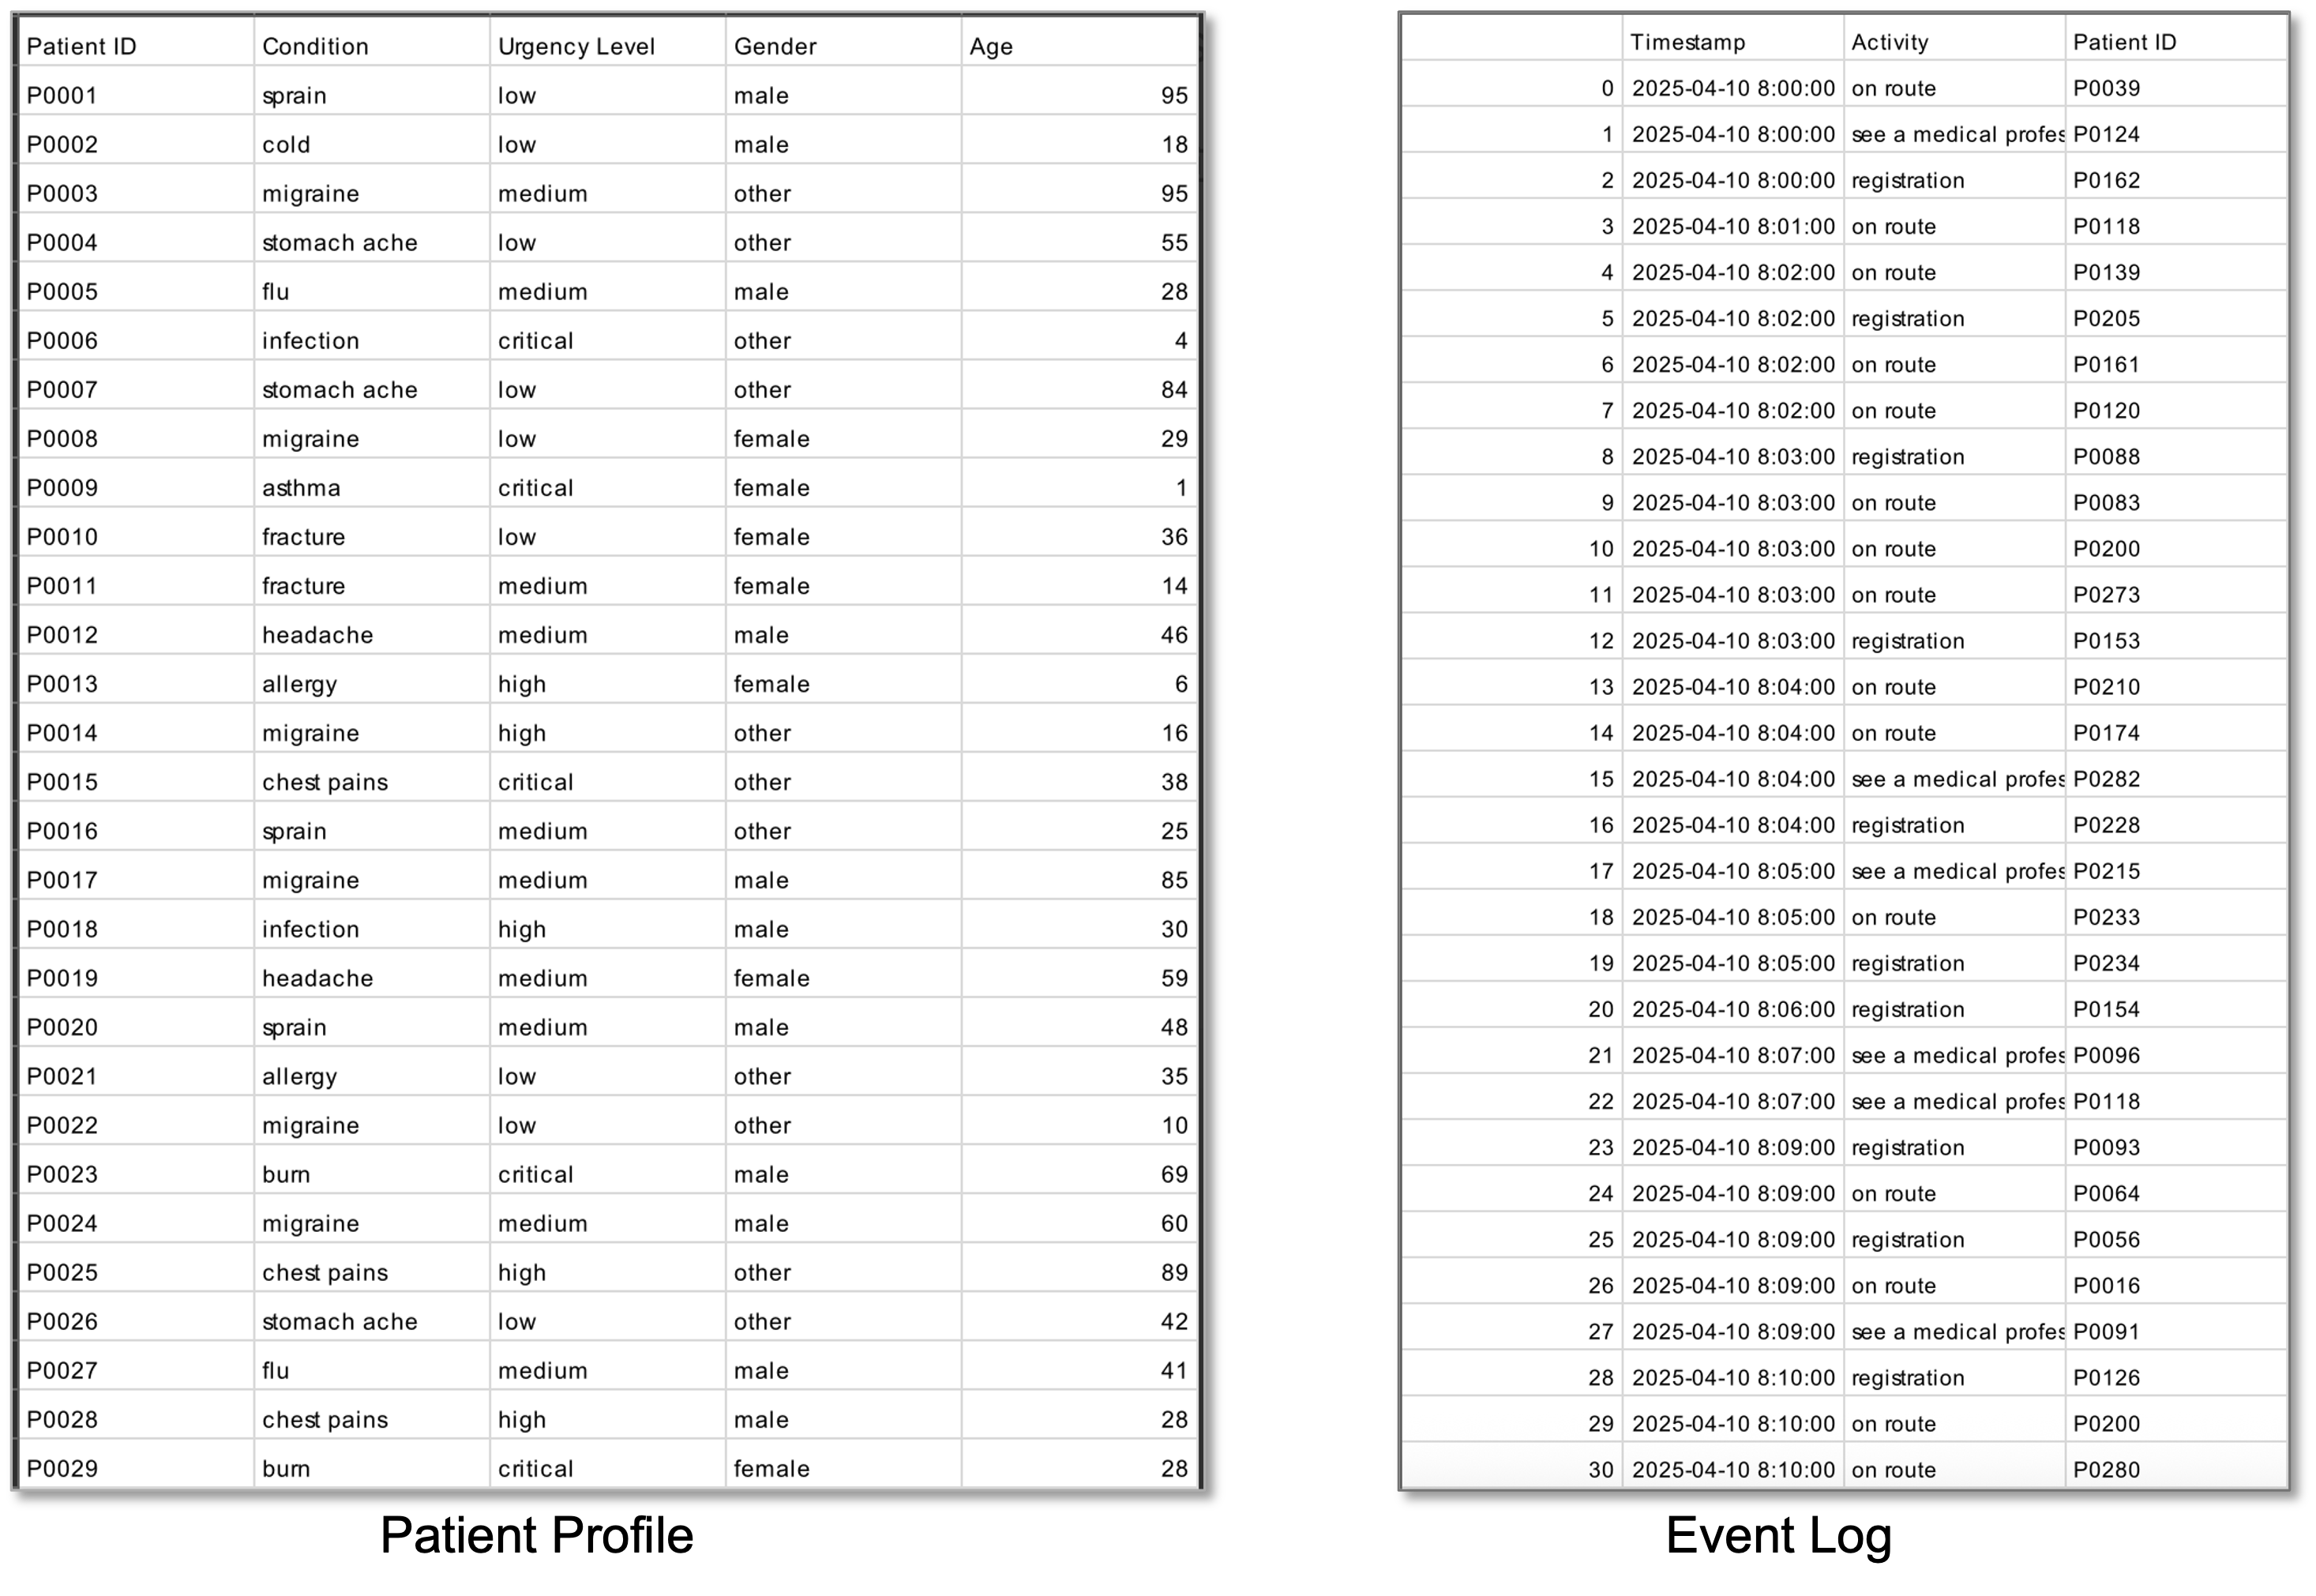
To generate the synthetic dataset ChatGPT has been iteratively queried. The first datasets contains a collection of patient visits to the ER. Specifically, we asked to generate 300 patients according to the following schema: patient ID, condition, urgency level, gender, and age.888The exact prompt for the generation of the patients is: can you create a dataset of 300 patients with the following attributes: Patient id, condition, urgency level, gender, age . conditions include things like flue, headache, fracture, infection, cold, allergy, chest pains, asthma etc. Aim for about 10-12 conditions. Urgency level includes critical, high, medium and low and should make sense for the condition of the patient. Sometimes the same condition can have a different urgency level for example a fracture can be low or critical. Try to generate a variety The distribution of the data resulting from the generation is represented in Figure 13.
Starting from the set of patients, we asked the system to generate sequences of emergency room activities, hinting at the type of activities we are interested in.999The exact prompt for the generation of the activities is: for this patient set, can you generate a log of activities relating to an emergency department. The log contains a timestamp, an activity name and a patient id from the previous dataset. Activities in the beginning can include on route, registration and see a medical professional, activities in the middle can include triage, X-ray, blood test, see a medical professional, and activities at the end can include admission, discharge or leave without being seen. The obtained dataset contained 1,512 events for the 300 patients referring to 268 case variants (so most of the patients followed a unique sequence of activities). On this dataset, some traces were manually removed to avoid particularly meaningless situations and the resulting event log had 770 instances and 142 variants. In the rest of this text, we call this log L1.
Starting from L1, we derived two additional logs, L2 and L3, by applying additional filtering to mimic an off-peak (L2) and an intense scenario (L3). L1, L2, and L3 have also been used to mine the corresponding 3 process models (i.e., M1, M2, and M3) using the approach described in [7]. A picture of the three models built using Fluxicon Disco101010See: https://www.fluxicon.com/disco/. is in Figure 14.
Finally, L1, L2, and L3 have been transformed into three lists of events by sorting each event according to its execution time. With these lists, we constructed our synthetic event stream by concatenating the following lists: L1, L2, L1, and L3 with the intention of simulating a regular daytime period, followed by off-peak (i.e., night), then back to daytime and eventually an intense scenario.
To analyze the data, a streaming process mining pipeline has been implemented using pyBeamline [5]. The pipeline processes each event and computes the following:
-
The behavioral conformance value [7] of the stream against model M1/M2/M3.
All these values represent the “Process Mining Results Data” in Figure 11, and are combined with the actual raw event, which can be used to compute basic statistics, to form the “Curated Data” (see Figure 11) that is provided as input to the “Visualization and Interaction component”.
VESPA-VIS’s Prototypical Mock-Up
Based on the use case, synthetic data and the outlined problem dimensions, we started designing a prototype mock-up. The prototype, named VESPA-VIS, accordingly comprises two main views, the Ward view (see Figure 15) and the Patient view (see Figure 16). Each one is designed to address the two outlined levels of detail of our use case: ward-centric vs. patient-centric level.
The Ward view is split into a Patient Flow representation (see Figure 15A) and a view showing temporal overviews of the relevant facets (see Figure 15B). The Patient Flow displays the event streams flowing into the ER ward. A node-link diagram representing the currently active reference model (e.g., M1) is drawn as a backdrop in the view. As the events stream into the ward model the current patient load is mapped on the size of the nodes and weight of the edges. If deviations to the model appear (i.e., “unexpected” events not included in the reference model), these are drawn dashed with node and edge size following the same conventions. The Patient Flow displays the flow of patients over a given expert-user defined time-interval preceding the current time point (e.g., 10 minutes). A time slider allows exploration of past intervals. Hovering over a node or edge pops up a tool-tip displaying the number of patients belonging to the corresponding event or transition over time.

On the right side of the view, a selection of graphs showing the temporal distribution of relevant facets is displayed (see Figure 15B). These facet graphs complement the main Patient Flow view and allow an expert to inspect surrounding factors and reason about the processing state of the ward. On the top, the conformance score over time is displayed. Conformance w.r.t. the currently explored model over time is displayed by default (e.g., M1), and on hover, the view is complemented with conformance w.r.t. to complementary model variations (e.g., M2, M3). This graph allows the expert to monitor the conformance of the process over time, detect fluctuations from the expected behavior, and assess whether the correct model is used as a reference or whether another model should be used. If the conformance score reduces below a certain threshold over a certain period of time, a guard is triggered, calling for the attention of the expert. The second graph displays the ward load over time, i.e. the total number of patients being processed, allowing the expert to monitor the overall stress on the ward over time. Third, the average Length of Stay (LOS) of patients being processed is displayed over time, providing an additional cue to the stress of the ward. The fourth graph gives a summary overview of the urgency of the patients being processed over time. The distribution of the urgency classes (e.g. low, medium, high) is displayed as a layered area graph, allowing an expert to reason about the characteristics of the patients currently putting load on the ward. Additional facets could be displayed in a similar manner in the view, if deemed appropriate for the task at hand.
The Patient Flow view and facets graphs are updated according to three timing strategies: (1) at regular pre-defined intervals (e.g. every 10 minutes or 100 events) by default (scheduled), (2) if a guard/trigger is activated (triggered), (3) upon request of the user (on-demand). The Ward view is displayed for all of the available reference models in different tabs. A user can switch between exploring the event-streams against these at any time.
The Patient View (see Figure 16) is designed to allow an expert to drill down into the individual patient event-streams when a need arises. This can, for example, be in anticipation of a forthcoming increase of load, or can occur after a guard has called attention to the need for intervention. In the Patient View the individual patient streams are displayed as sequences of events. Time is displayed on the horizontal axis and the user can toggle relative and absolute time. Patient sequences are sorted along the vertical axis by an urgency score. If the computed urgency score of a patient exceeds a pre-define threshold, an alarm is triggered to call attention to the need of prioritizing individual patients. The urgency score is computed as a distance from a benchmark sequence. Three alternative benchmark sequences are considered in VESPA-VIS:
-
1.
“Ideal behavior”. An expert pre-defined ideal path through the process both in terms of sequence of events and timing. Different ideal sequences can be defined for different times of day or days of the week.
-
2.
“Current average”. An average patient sequence reflecting the current ordering and average duration of events.
-
3.
“User adjusted”. A user-adjustable patient sequence where an expert (e.g. ER manager) can make on-line decisions regarding the target duration of events.
The ability to choose between benchmarks to compare against allows the expert user of VESPA-VIS (e.g. ER manager) to flexibly adjust the notion of urgency and control prioritization of patients according to the current situation, their domain knowledge and previous experience.
Together the Ward and Patient views allow a user to move smoothly between user roles from observer to explorer, monitor the current situation, react on evolving changes, reason about possible explanations of these, and potentially anticipate outcomes.

4.2.4 Next Steps
The presented VESPA-VIS’s mockups provide an initial illustration of our research questions. That is, when (monitoring or scheduled to more active exploration) and how (views appropriate to patient-centric and ward-centric requirements), progressive visual analytics can best support real-time decision-making in a streaming process mining context. However, there remains a number of further considerations for the proposed approach to be fully realized.
The illustration of the approach through the usecase indicates fertile ground for further developing the approach and robust evaluation to assess the effectiveness of progressive visual analytics for the (real-time) decision support. We anticipate that such an evaluation would require carefully planned user studies with representative participant groups.
Given the continuous nature of the event stream, it is natural to expect a need to “forget” previous event streams when they are no longer relevant for the current decision making. So far, we have considered a rather straightforward way of simply ‘forgetting’ patients who have exited the ER through discharge or transferal to another ward. Yet this prevents the head of the ER department from comparing the currently observed situation with previously observed situations – for example, the processes occurring on a current New Years holiday day to the processes on the same day in previous years – to identify best practices or simply “what has worked in the past”. Identification of ‘forgetfulness’ thresholds is in itself a complex and multi-faceted problem that requires further work, although prior literature gives hints (see for example [15]).
Although the focus of the approach is to support real-time decision making, the insights gained from the proposed approach present an opportunity to inform process enhancement. Exploring this opportunity requires further consideration.
References
- [1] Wolfgang Aigner, Silvia Miksch, Heidrun Schumann, and Christian Tominski. Visualization of Time-Oriented Data, Second Edition. Springer, 2023.
- [2] Marco Angelini, Giuseppe Santucci, Heidrun Schumann, and Hans-Jörg Schulz. A review and characterization of progressive visual analytics. Informatics, 5(3):31:1–31:27, 2018.
- [3] Fabian Beck, Michael Burch, Stephan Diehl, and Daniel Weiskopf. A Taxonomy and Survey of Dynamic Graph Visualization. Computer Graphics Forum, 36(1):133–159, 2017.
- [4] Andrea Burattin. Streaming process mining. In Wil M. P. van der Aalst and Josep Carmona, editors, Process Mining Handbook, volume 448 of Lecture Notes in Business Information Processing, pages 349–372. Springer, 2022.
- [5] Andrea Burattin. Beamline: A comprehensive toolkit for research and development of streaming process mining. Softw. Impacts, 17:100551, 2023.
- [6] Andrea Burattin, Alessandro Sperduti, and Wil M. P. van der Aalst. Control-flow discovery from event streams. In Proceedings of the IEEE Congress on Evolutionary Computation, CEC 2014, Beijing, China, July 6-11, 2014, pages 2420–2427. IEEE, 2014.
- [7] Andrea Burattin, Sebastiaan J. van Zelst, Abel Armas-Cervantes, Boudewijn F. van Dongen, and Josep Carmona. Online conformance checking using behavioural patterns. In Mathias Weske, Marco Montali, Ingo Weber, and Jan vom Brocke, editors, Business Process Management – 16th International Conference, BPM 2018, Sydney, NSW, Australia, September 9-14, 2018, Proceedings, volume 11080 of Lecture Notes in Computer Science, pages 250–267. Springer, 2018.
- [8] Davide Ceneda, Theresia Gschwandtner, Thorsten May, Silvia Miksch, Hans-Jörg Schulz, Marc Streit, and Christian Tominski. Characterizing Guidance in Visual Analytics. IEEE Transactions on Visualization and Computer Graphics, 23(1):111–120, 2017.
- [9] Jean-Daniel Fekete, Danyel Fisher, and Michael Sedlmair, editors. Progressive Data Analysis – Roadmap and Research Agenda. Eurographics Press, 2024.
- [10] Steffen Hadlak, Heidrun Schumann, and Hans-Jörg Schulz. A Survey of Multi-faceted Graph Visualization. In Eurographics Conference on Visualization. The Eurographics Association, 2015.
- [11] Jaemin Jo, Sehi L’Yi, Bongshin Lee, and Jinwook Seo. ProReveal: Progressive visual analytics with safeguards. IEEE Transactions on Visualization and Computer Graphics, 27(7):3109–3122, 2021.
- [12] Jock Mackinlay. Automating the design of graphical presentations of relational information. ACM Transactions on Graphics, 5(2):110–141, 1986.
- [13] Luana Micallef, Hans-Jörg Schulz, Marco Angelini, Michaël Aupetit, Remco Chang, Jörn Kohlhammer, Adam Perer, and Giuseppe Santucci. The human user in progressive visual analytics. In Jimmy Johannson, Filip Sadlo, and G. Elisabeta Marai, editors, Short Paper Proceedings of EuroVis’19, pages 19–23. Eurographics Association, 2019.
- [14] Tamara Munzner. Visualization Analysis and Design. AK Peters Visualization Series. CRC Press, 2015.
- [15] A. Pavan, Sourav Chakraborty, N. V. Vinodchandran, and Kuldeep S Meel. On the feasibility of forgetting in data streams. Proceedings of the ACM on Management of Data, 2(2), 2024.
- [16] Ignacio Pérez-Messina, Marco Angelini, Davide Ceneda, Christian Tominski, and Silvia Miksch. Coupling guidance and progressiveness in visual analytics. Computer Graphics Forum, (forthcoming), 2025.
- [17] Hans-Jörg Schulz and Chris Weaver. Transient visual analytics. In Mennatallah El-Assady and Hans-Jörg Schulz, editors, Proceedings of the 15th International EuroVis Workshop on Visual Analytics (EuroVA’24). Eurographics Association, 2024.
- [18] Wil M. P. van der Aalst. Process Mining – Data Science in Action, Second Edition. Springer, 2016.
- [19] Jarke J Van Wijk. Views on visualization. IEEE Transactions on Visualization and Computer Graphics, 12(4):421–432, 2006.
4.3 Interactivity: Visual Feedback and Feedforward for Process Exploration
Francesca Zerbato (TU Eindhoven, NL), Irit Hadar (University of Haifa, IL), Philipp Koytek (Celonis Labs GmbH – München, DE), Christian Tominski (Universität Rostock, DE), and Maria-Cruz Villa-Uriol (University of Sheffield, GB)
License: ![]() Creative Commons BY 4.0 International license © Francesca Zerbato, Irit Hadar, Philipp Koytek, Christian Tominski, and Maria-Cruz Villa-Uriol
Creative Commons BY 4.0 International license © Francesca Zerbato, Irit Hadar, Philipp Koytek, Christian Tominski, and Maria-Cruz Villa-Uriol
This working group focused on the role that interactivity plays in supporting the exploration of processes in process mining (PM). The group first analyzed the current PM practice and its limitations. Then existing works related to interactive visual data exploration were collected from the Visual Analytics (VA) literature. Based on that, preliminary formalizations were sythesized and initial design ideas sketched. In particular, the focus was on enhancing PM with informative visual feedback and feedforward techniques from the VA realm.
4.3.1 The Problem of (Un)Informed Process Exploration
Like interactive visual data analysis in general [19], process mining in particular is exploratory and human-driven. Process analysts typically have to engage in iterative exploration cycles of process visualizations (see Figure 17) to build an understanding of the process, examine different scenarios, and generate hypotheses [26]. Hypotheses are then tested, refined, or discarded based on intermediate insights, which, in turn, guide analysts in choosing what to explore next [18] and lead to the crystallization of knowledge [21].
Many process mining tools support this interactive exploration through components such as filter masks or sliders that allow analysts to create views and isolate data subsets of interest. However, these interactions often lack transparency and context, making it difficult for users to anticipate the effects of their actions before executing them (What should I usefully do?) and understand the effect once an action has been executed (Have I achieved the desired outcome?).
As an example, consider a process mining analyst, let’s name him Bob, who is in charge of analyzing a Road Fine Management process [7] visualized as a directly-follows graphs (DFG). His goal is to investigate cases where offenders do not pay their fines. Bob’s analysis steps are sketched in Figure 18.
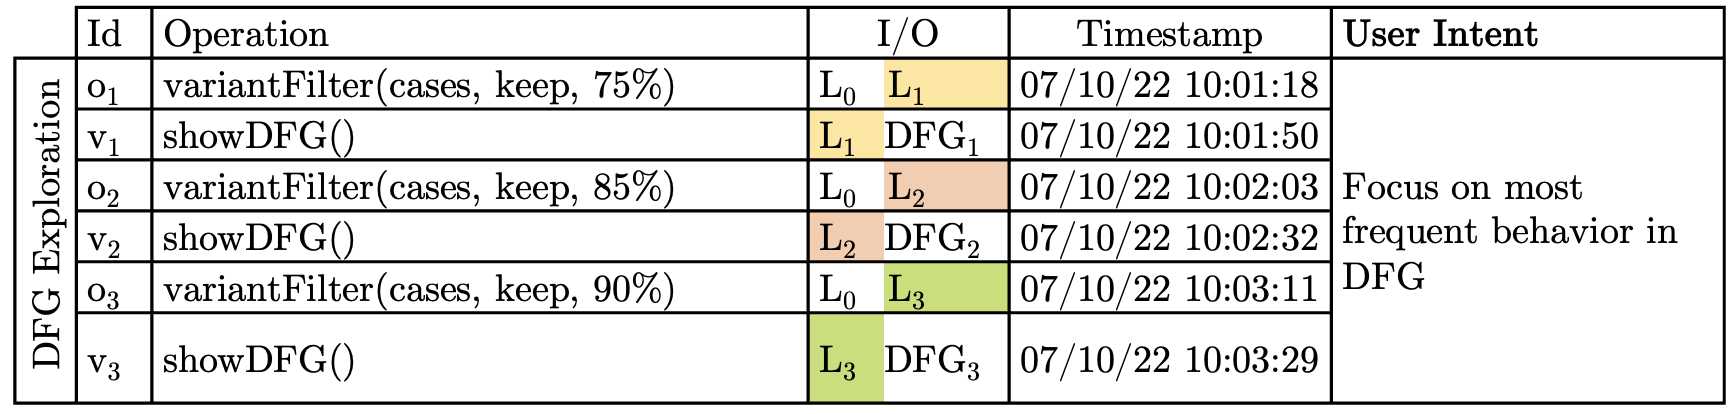
As a first step, Bob loads the raw data provided by the police () into a process mining tool. His goal is to get an initial understanding of the structure of the process. To achieve this goal, he intents to focus on the most common behavior using a variant filter to remove infrequent cases. However, to find a suitable abstraction level for his analysis, Bob has to go through the costly procedure of applying the filter three times (). He selects different filtering thresholds of 75%, 85%, and 90% of the cases in the log, and each time he inspects the resulting DFG () to assess visually the effects of the filters. While the first two filter configurations remove too many cases, he settles for .
This interactive selection of most frequent cases is a common first step of many process mining analyses. However, during this process, Bob runs into several limitations:
-
There is no preview mechanism to support the decision for a suitable filter threshold: Bob must fully apply each filter to see what the result looks like;
-
Comparisons across multiple visualizations resulting from the filtering are lost: Since each filter operation completely replaces the DFG with a new one, Bob is forced to take screenshots or compare from short-term memory;
-
The DFG shows the impact of his filter on the control-flow only: Bob would need to create different views of the data to see how his filtering impacts other facets of the process.
The difficulties Bob faces demonstrate some of the challenges that stem from limitations of interaction functionalities currently being used in PM practice. These limitations introduce constraints to the process of process mining (PPM) [18] and potentially hinder performance when making sense of event log data. The objective of our working group is to investigate these challenges and outline the opportunity of enhancing the process exploration based on established concepts, methods, and techniques from the realm of VA.
With our working group, we aim to improve the overall process of making sense during the PPM. To this end, we compiled relevant previous work from the PM and VA communities, both to understand some of the cognitive challenges during process exploration and to bring together models and approaches that can inform the design of advanced process exploration techniques to overcome these challenges.
4.3.2 Relevant Works Related to Interactivity in Process Exploration
During the group discussion, we considered several works from PM and VA. These works are concerned with the cognitive, processing, and interactive mechanisms that are relevant during visual process exploration.
Related work on Process Mining
The process of process mining (PPM) is a recent stream of research studying the sequence of activities – both from behavioral and cognitive points of view [18, 26, 27]. Such studies are important for informing efforts toward providing support to the cognitive processes underlying the PPM. The PPM starts based on a general goal (e.g., identifying obstacles in the process), building on available event datasets, and continues to additional operations, such as filtering the data to explore it from different angles, interpreting the data, and trying to make sense of them in order to find insights relevant to the goal at hand.
Looking at the PPM from a cognitive perspective, during process mining, the data serve as input signals coming from the ‘external world’. The sense-making process entails an iterative cycle, where attention is focused according to a set goal, leading to the generation of hypotheses about the process, which are then tested and reconsidered against the data for minimizing the prediction error [18]. This process not only aligns with general knowledge generation processes in VA [21, 15], but also with the post-cognitivism principle of prediction error minimization (PEM) [6, 11] in particular.
PEM conceives the brain as a probabilistic inference system, which attempts to predict the input it receives by constructing models of the possible causes of this input. While aiming to minimize the prediction error (i.e., the gap between the predicted and the actual input), it either introduces small refinements to the model or substantial revisions (or even a complete replacement of the model), depending on the size of the error. This process is iteratively performed until the prediction error is satisfactorily small.
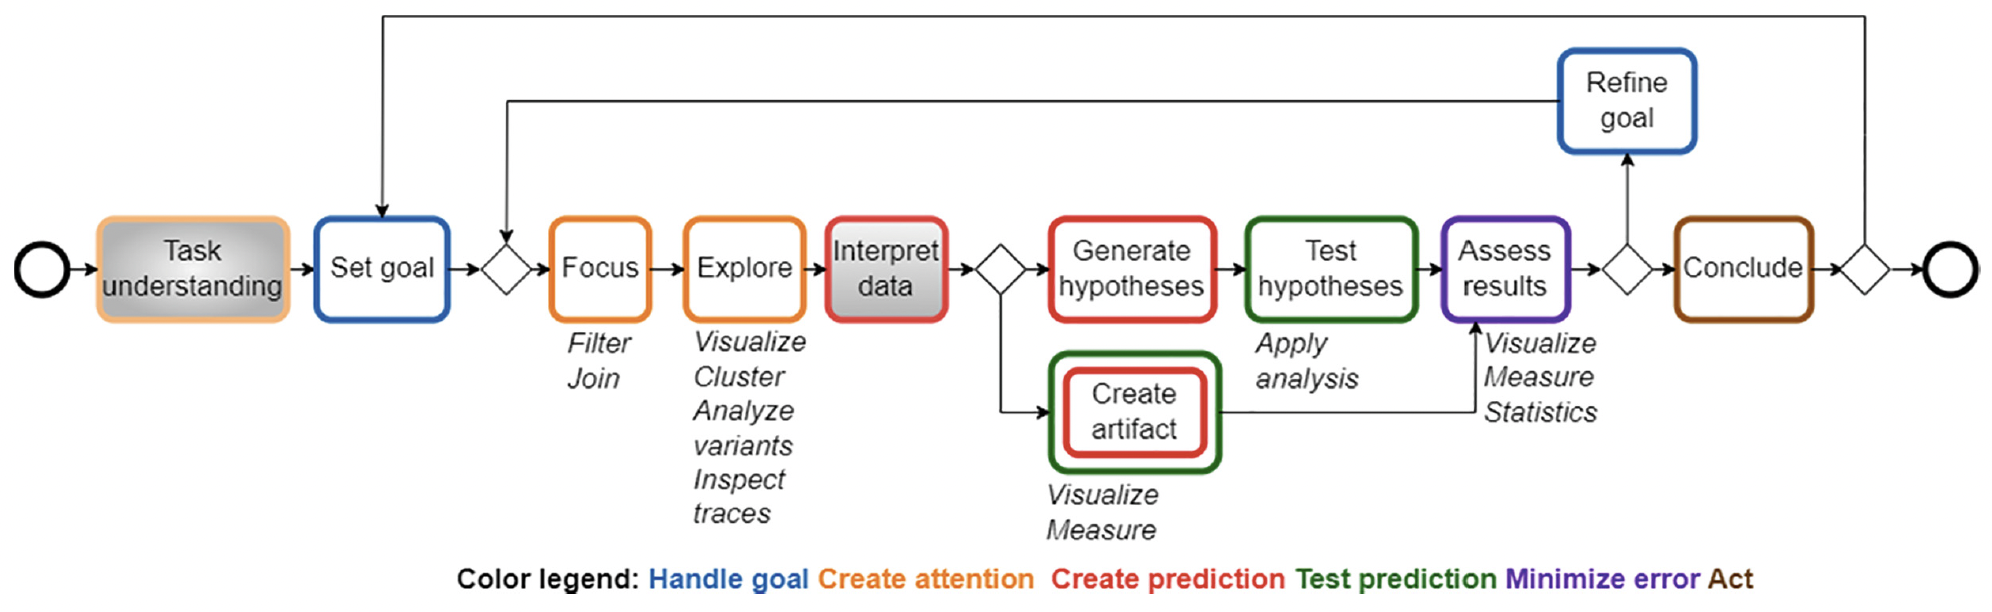
Figure 19 illustrates the adapted model proposed by Sorokina et al. [18] named PEM4PPM. The model captures the sequence of PM steps and their corresponding cognitive operations. It begins with high-level business goals that can be decomposed or refined into more specific ones as needed. The refinement process iterates until the goals are concrete enough to be achieved through available PM operations. To focus attention on studied aspects of the input data, a relevant subset of the data is filtered and organized, enabling subsequent exploration of the data to identify behavioral patterns that are of interest. Data exploration is conducted to uncover behavior patterns that may be relevant to the set goals. Based on the exploration results, concrete predictions are generated, in the form of hypotheses or artifacts (e.g., process models) and then tested. The results obtained from these steps are assessed against the original goal or hypothesis to evaluate prediction errors and take actions for their minimization. This assessment serves as a basis for determining whether the goal has been achieved, thus leading to a conclusion, or if further refinement is needed, in which case the process continues in another iteration [18].
Related Works from Visual Analytics
The VA community has worked extensively on interactive visual data exploration. There are several important related works that are relevant in this regard, underpinning effective user interaction and data exploration:
-
On a more abstract level than the PEM4PPM, Norman’s action cycle [14] provides a crucial framework for understanding the stages users go through when interacting with a system, emphasizing the gulfs of execution and evaluation that interactive visualization interfaces should aim to bridge in order to minimize interaction costs [13].
-
Shneiderman’s visual information seeking mantra [17] characterizes the general process of interactive data exploration as: Overview first, zoom and filter, then details on demand. This mantra has been expanded to the Visual Analytics Mantra [12]: Analyze first, show the important, zoom and filter, and analyze further, details on demand.
-
Brushing & linking [2] and dynamic queries [16] provide techniques that enable simultaneous highlighting and filtering of related data in different views. They offer users immediate and continuous visual feedback as they manipulate query parameters, fostering an iterative and exploratory analysis process across multiple perspectives.
-
Fluid interaction [8] has been conceived to create seamless and responsive visualization interfaces that minimize the cognitive load of interaction, allowing users to stay in the analysis flow and focus on data insights.
-
Visual Feedback and Feedforward [22] are essential principles for designing intuitive interactive systems. Commonly, visual feedback informs users about the results of their actions. However, only rarely is visual feedforward applied to provide users with cues suggesting available options and potential interaction outcomes.
These interconnected concepts collectively contribute to the design of powerful and user-friendly VA tools. This working group particularly focused on visual feedback and feedforward as promising, yet so far under-explored mechanisms to enhance process exploration in PM. By dynamically adding information to existing visual process representations, they can support the understanding of interaction effects and the decisions of the user about their next activity.
4.3.3 Conceptualization of Feedback and Feedforward
In an attempt to pinpoint the fundamental conceptual aspects of the desired process exploration support, we came up with the following (incomplete) list of notations inspired by the section on interactive selection and accentuation in [19]:
-
, the data to be visualized, explored, and understood
-
, the currently relevant focus data, subject to change frequently during process exploration
-
, the data currently not being of relevance for the process exploration
-
, a state capturing the data underlying the visualization
-
, the “current” state
-
, the “old” state
-
, a set of possible (useful) “alternative” states that can be entered through alternative interactions
-
, the explicit difference(s) between two states
-
…
Based on these notations, we defined exploration as the repeated refinement and change of (and respectively), which usually involves numerous state changes (e.g., the three different filtering states in Bob’s exploration example). Moreover, it seems that understanding state changes is crucial for effective exploration. Possible options for supporting the understanding of state changes can be based on Gleicher et al.’s [10] strategies for visual comparison:
-
Juxtaposition: Visualize and side by side
-
Superposition: Superimpose the visualization of over the visualization of
-
Explicit encodingg: Visualize directly
So far, these strategies are not sufficiently integrated into existing process exploration practice!
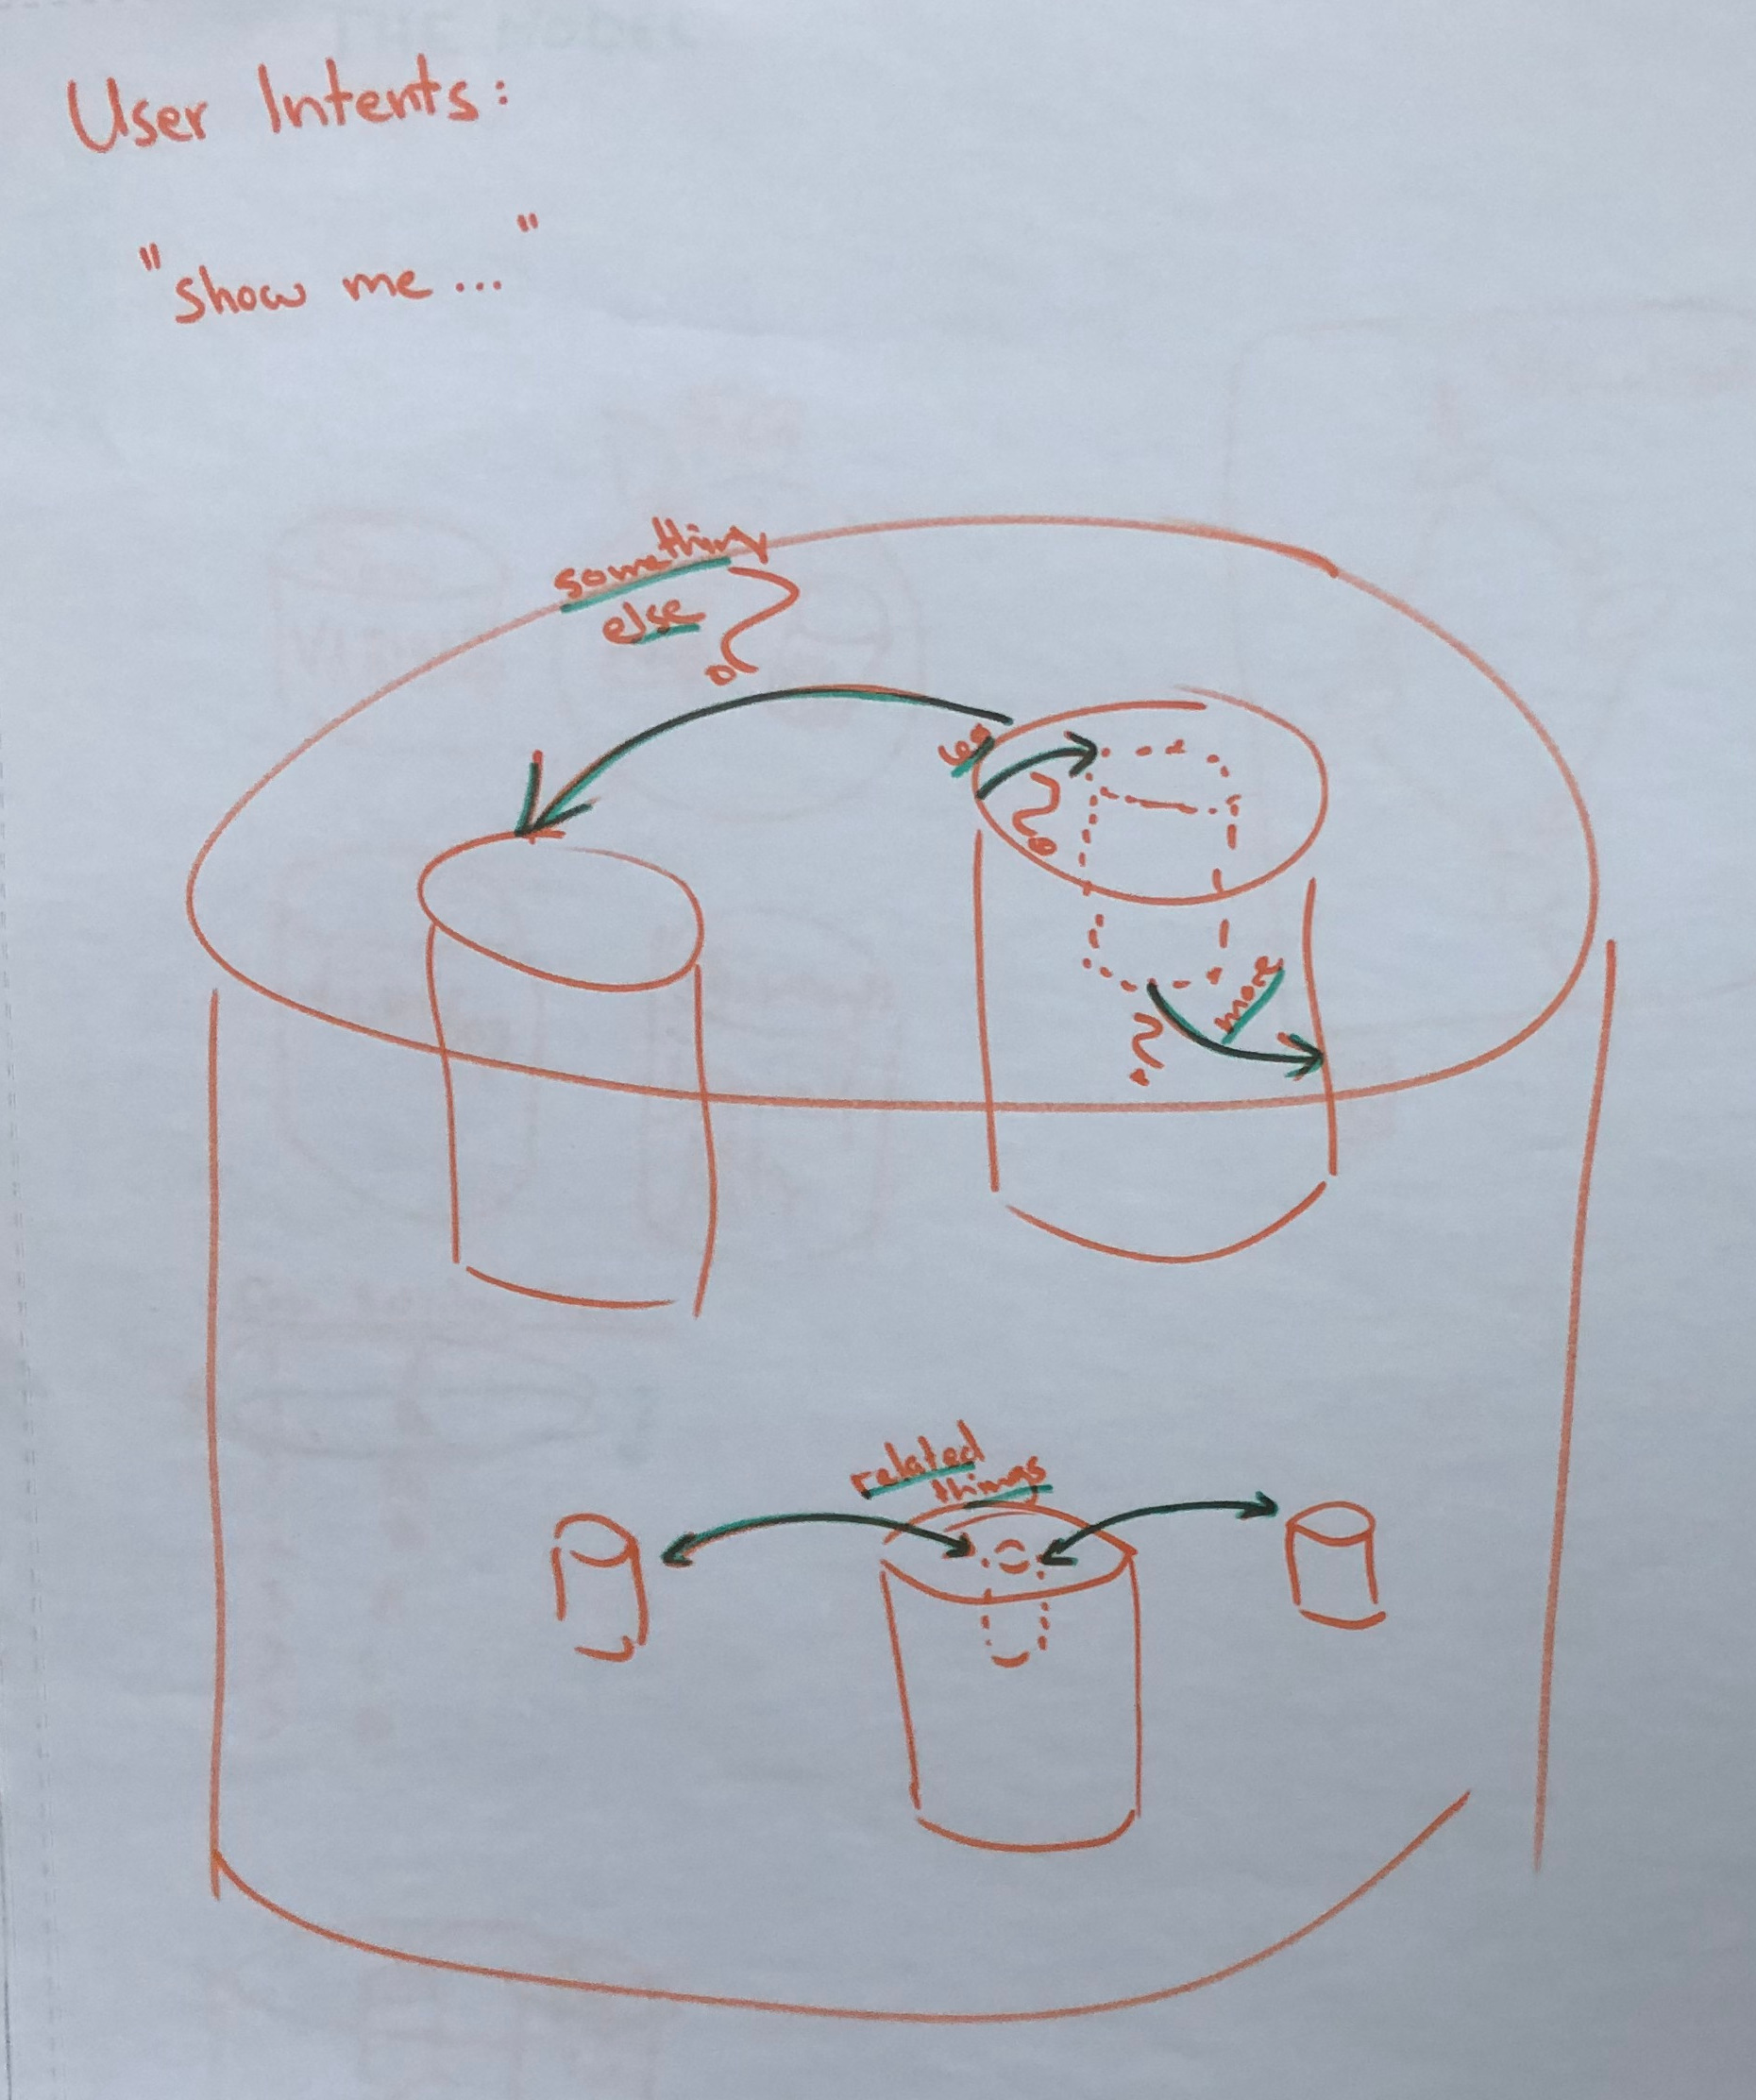
To understand the users’ needs better, we further conceptualized a cycle of interaction for a seamless analysis that is based on feedback and feedforward. Generally, in interactive exploration/analysis, the analyst interacts with the visualizations for dicing, slicing and relating different parts of the data. So, the exploration cycle starts with the analyst expressing an intent to change the visual representation. Yi et al. [24] identified several different categories of interaction intents called “Show me…”, of which we focus on the intents related to changing the focused subset of the data exploration:
-
Show me something else: A different subset of the data (e.g., navigate in time) will be visualized; .
-
Show me more/less: A subset of different size or level of aggregation (e.g., reduce number of nodes in DFG) will be visualized; .
-
Show me something conditionally: A subset that fulfills certain (filter) condition(s) (e.g., filter for frequent variants) will be visualized; .
-
Show me related things: A subset that is (in some way) related to the currently shown subset (e.g., brushing and linking across multiple faceted views) will be visualized; , typically .
These intents lead to interactions to which the system responds by providing visual feedback, and what we would like to emphasize, also visual feedforward. We envisioned the following scenario in which a user executes an interaction and receives the corresponding visual feedback and feedforward.
-
1.
The user’s intention is typically communicated to the system through different ways of interaction (e.g., hovering a visual mark in the visualization or clicking a button or slider in the user interface).
-
2.
The system interprets the user’s action and then provides relevant context and suggests possible next steps with previews of their impact. Here we can explore a large design space of different useful visual feedback and feedforward, which generally are dependent on the semantics of the interaction and will incorporate different facets of the data. The additional context and possible next steps help the analyst to decide if the intended interaction outcome has been obtained, and if not, how to execute their alternative more fruitful interactions.
-
3.
Based on the visual feedback and feedforward, the analyst can now better understand interaction effects and can more easily decide what to do next. The cycle starts again as the analyst continues the exploration and expresses their new intents through new interactions.
With this general scenario now being clear, the question that remains is how to design the visual feedforward and feedback concretely. However, given the huge design space, this is quite a challenging task.
4.3.4 Preliminary Design Examples
For our design sketches, we drew inspiration from previous work on enhancing interaction with visual feedback and feedforward. In particular, we considered:
-
Small multiples and large singles [20] is a concept to preview thumbnails of alternative parameterizations of visual representations.
-
Guidance visual cues [9] can be embedded into visualization views to indicate potentially interesting next navigation targets.
-
Octopocus [1] is an interaction technique that provides feedforward as an interactive gesture is performed to indicate possible interaction outcomes.
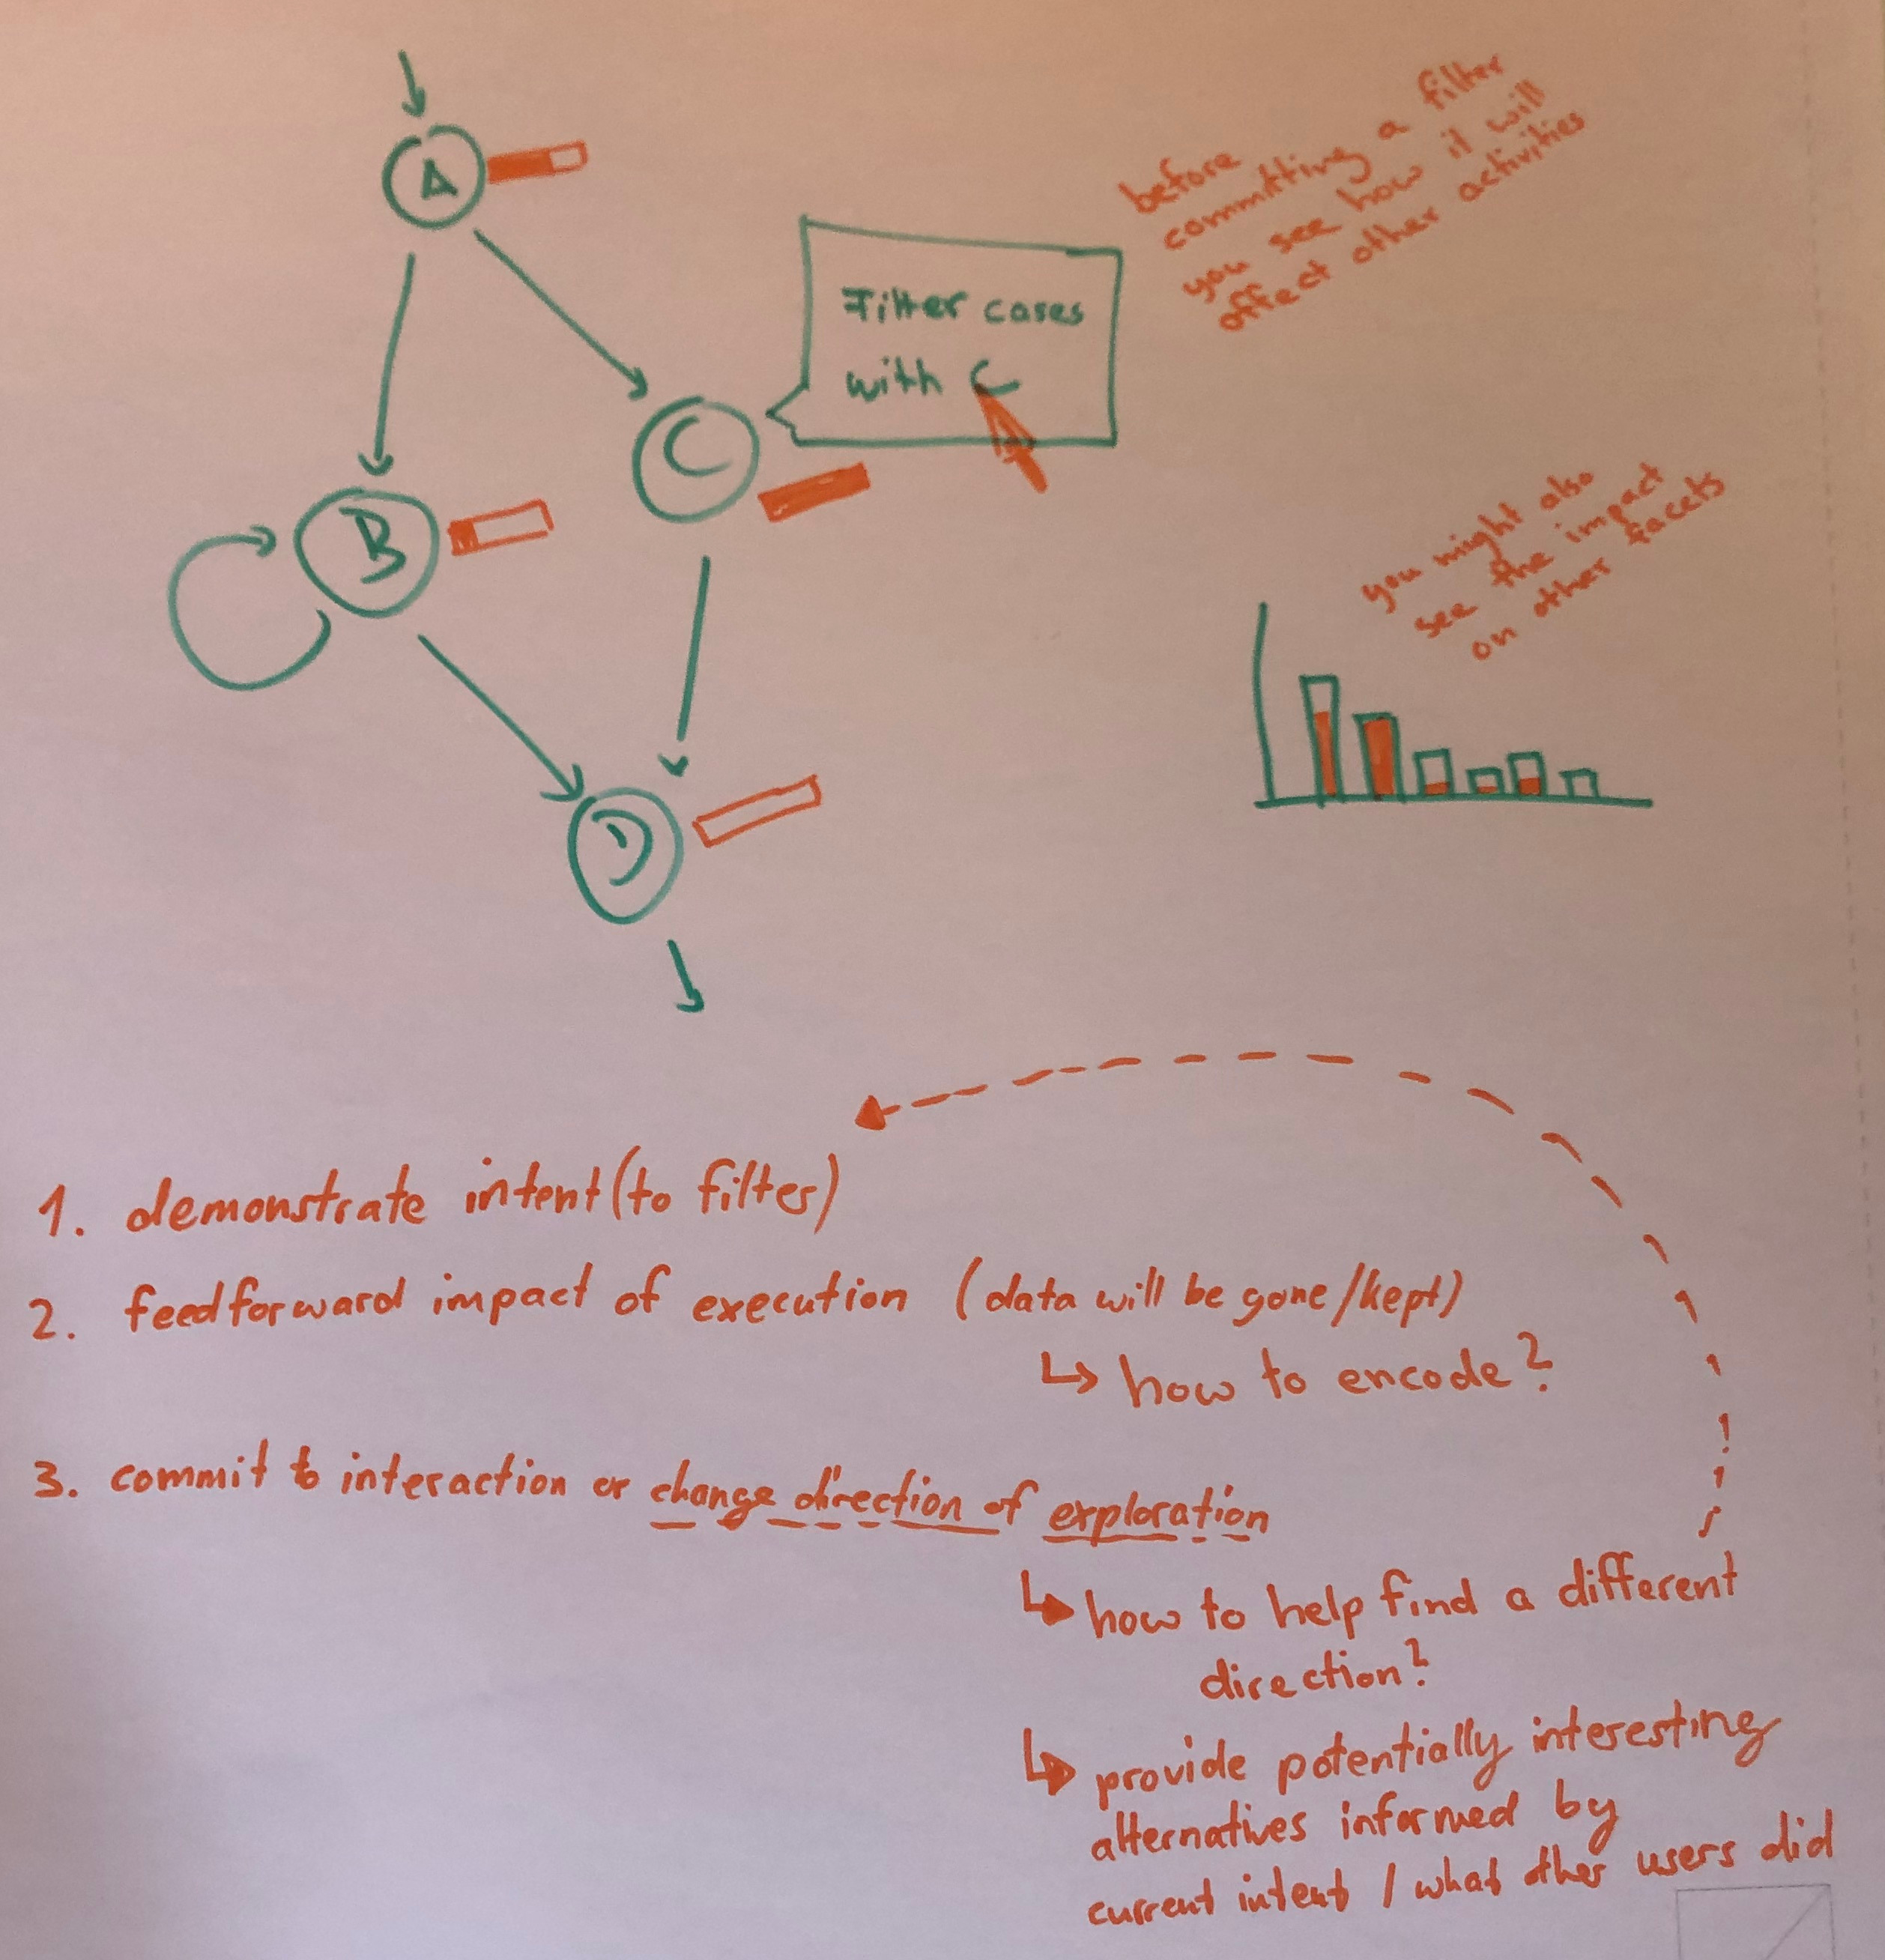
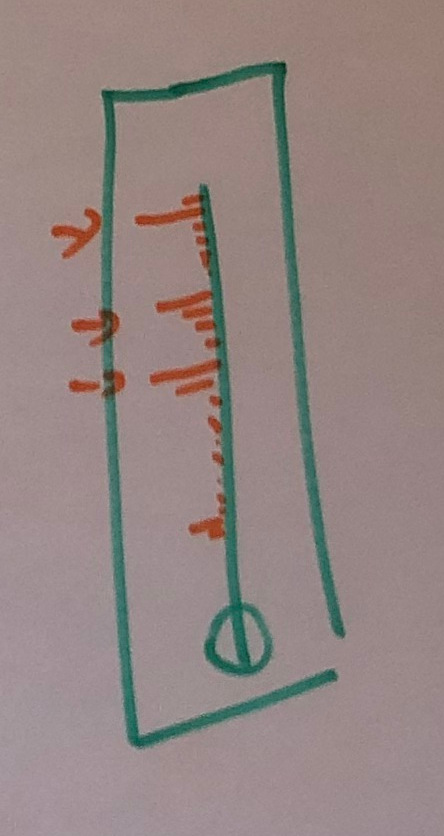
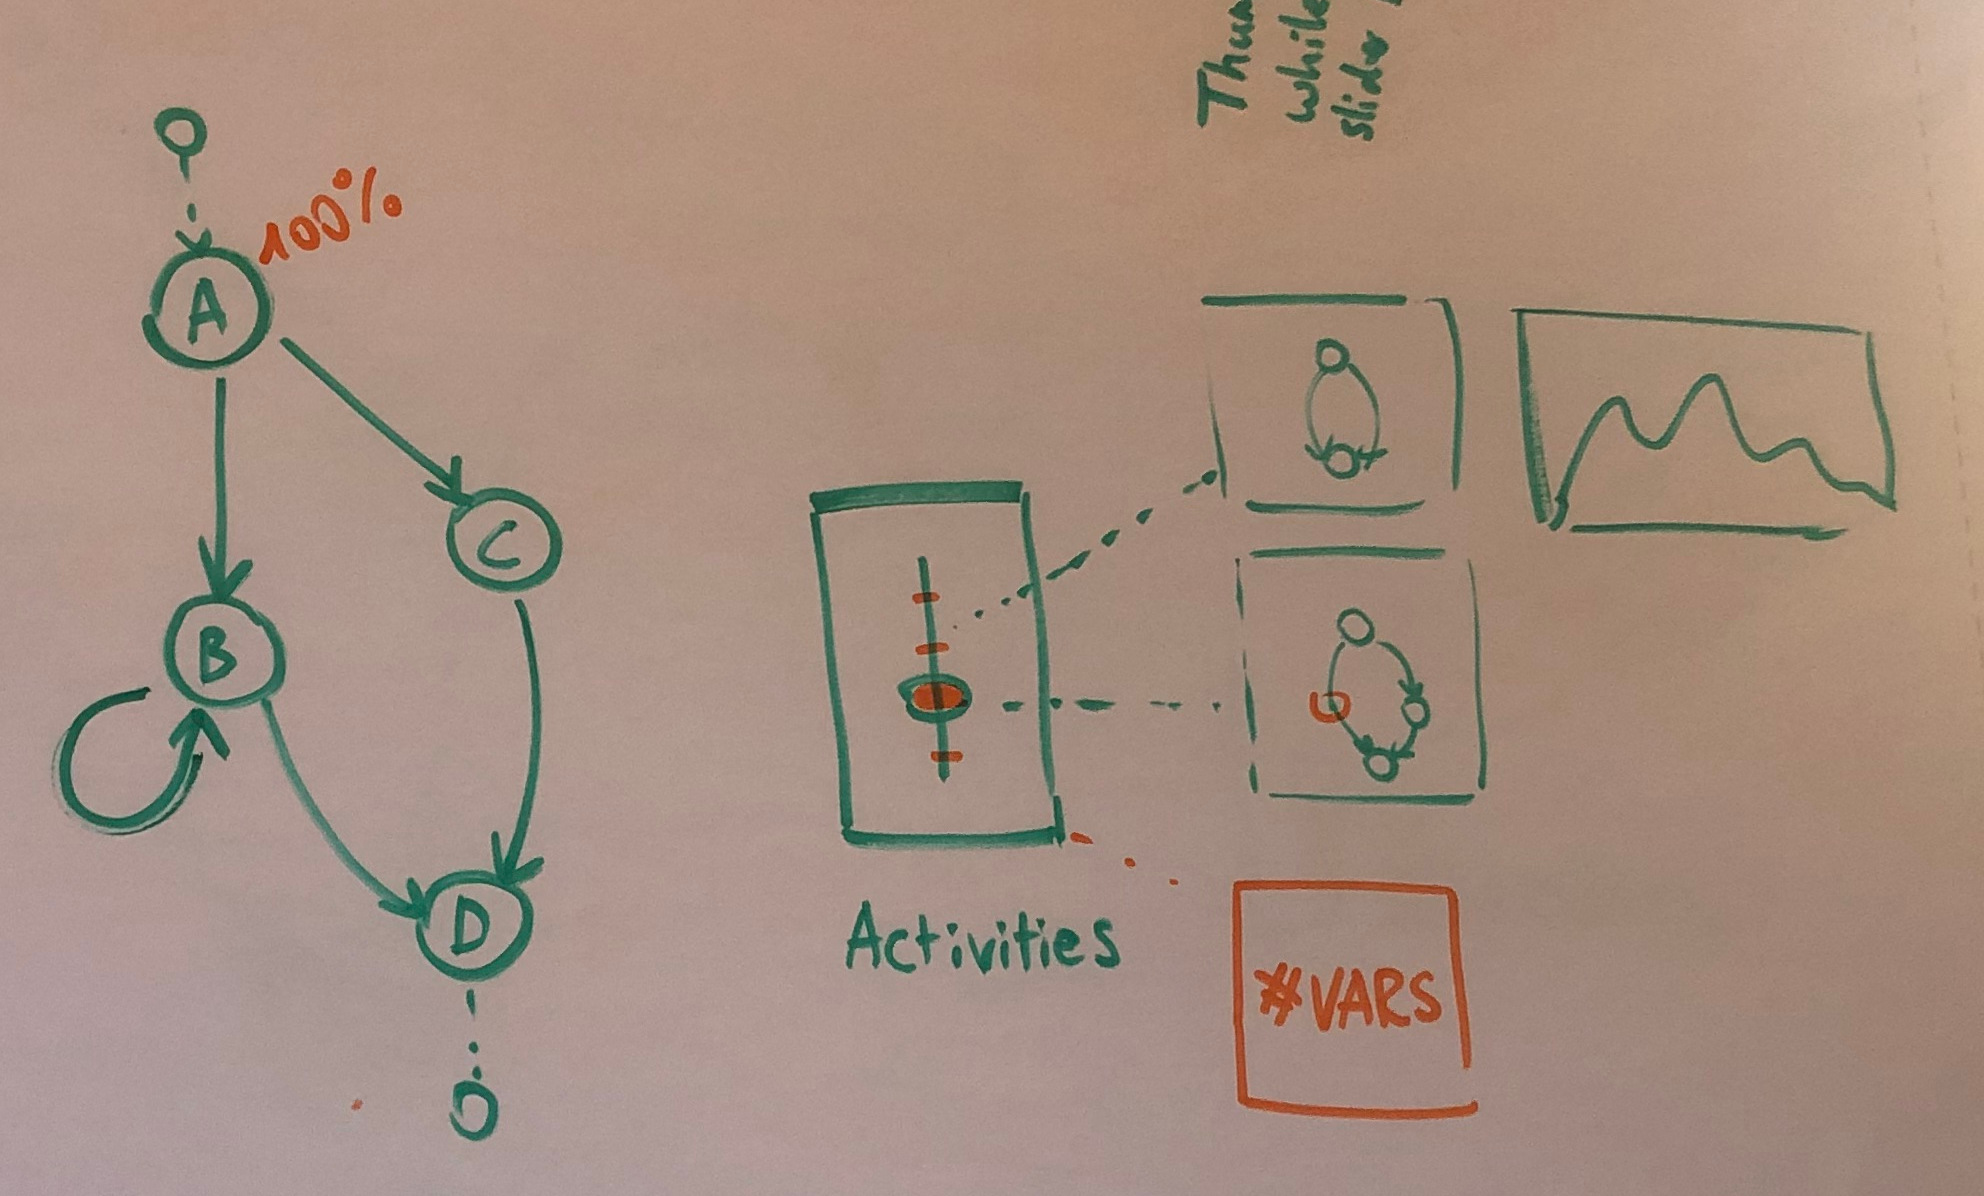
The sketches used these inspirational techniques to outline possible solutions for informative visual feedback and feedforward for process exploration. Figure 20 shows a selection of our sketches, including conceptualization of interaction intents, general interface ideas, scented slider widgets, and preview thumbnails. From these and further similar sketches, we abstracted the following design dimensions that can play a role when implementing enhanced process exploration mechanisms:
- Interaction control:
-
What type of control is used to carry out the interaction? Slider, button, hover area, spoken command, etc.
- Interaction integration:
-
Where is the interaction control located? Integrated in the visualization vs. external to the visualization in a separate user interface.
- Visual feedback/feedforward integration:
-
Where is the visual feedback/feedforward shown? Visualization enhancement integrated into the visualization vs. Interface enhancement integrated into the interaction control.
Summary
In summary, the working group made some preliminary first steps toward overcoming the current PM limitations by integrating VA approaches. It became clear that completely solving the problem remains a formidable challenge for future work. Not only would it be necessary to more comprehensively map the design space of visual feedback and feedforward, but one would also need to implement the new designs into PM tools, which may just not be ready for handling the multiple states, visual feedbacks and feedforwards in their underlying architecture. Therefore, we suggest putting more research and development efforts into interactivity to support process exploration.
![[Uncaptioned image]](group_picture_cropped.jpeg)
References
- [1] Olivier Bau and Wendy E. Mackay. Octopocus: a dynamic guide for learning gesture-based command sets. In Proceedings of the 21st Annual ACM Symposium on User Interface Software and Technology, UIST ’08, page 37–46, New York, NY, USA, 2008. Association for Computing Machinery.
- [2] Richard A. Becker and William S. Cleveland. Brushing Scatterplots. Technometrics, 29(2):127–142, 1987.
- [3] Davide Ceneda, Natalia Andrienko, Gennady Andrienko, Theresia Gschwandtner, Silvia Miksch, Nikolaus Piccolotto, Tobias Schreck, Marc Streit, Josef Suschnigg, and Christian Tominski. Guide me in analysis: A framework for guidance designers. Computer Graphics Forum, 39(6):269–288, 2020.
- [4] Davide Ceneda, Theresia Gschwandtner, Thorsten May, Silvia Miksch, Hans-Jörg Schulz, Marc Streit, and Christian Tominski. Characterizing guidance in visual analytics. IEEE Transactions on Visualization and Computer Graphics, 23(1):111–120, 2017.
- [5] Vasile Ciorna, Nicolas Médoc, Guy Melançon, Frank Petry, and Mohammad Ghoniem. A tour through the zoo of scented widgets. In Christina Gillmann, Michael Krone, and Simone Lenti, editors, 25th Eurographics Conference on Visualization, EuroVis 2023 – Posters, Leipzig, Germany, June 12-16, 2023, pages 9–11. Eurographics Association, 2023.
- [6] Andy Clark. Busting out: Predictive brains, embodied minds, and the puzzle of the evidentiary veil. Noûs, 51(4):727–753, 2017.
- [7] Massimiliano De Leoni and Felix Mannhardt. Road traffic fine management process. Eindhoven University of Technology, Dataset, 2015.
- [8] Niklas Elmqvist, Andrew Vande Moere, Hans-Christian Jetter, Daniel Cernea, Harald Reiterer, and TJ Jankun-Kelly. Fluid interaction for information visualization. Information Visualization, 10(4):327–340, 2011.
- [9] Stefan Gladisch, Heidrun Schumann, and Christian Tominski. Navigation Recommendations for Exploring Hierarchical Graphs. In George Bebis, Richard Boyle, Bahram Parvin, Darko Koracin, Baoxin Li, Fatih Porikli, Victor Zordan, James Klosowski, Sabine Coquillart, Xun Luo, Min Chen, and David Gotz, editors, Advances in Visual Computing: Proceedings of the International Symposium on Visual Computing (ISVC), volume 8034 of Lecture Notes in Computer Science, pages 36–47. Springer, 2013.
- [10] Michael Gleicher, Danielle Albers, Rick Walker, Ilir Jusufi, Charles D. Hansen, and Jonathan C. Roberts. Visual Comparison for Information Visualization. Information Visualization, 10(4):289–309, 2011.
- [11] Jakob Hohwy. The self-evidencing brain. Noûs, 50(2):259–285, 2016.
- [12] Daniel A. Keim, Florian Mansmann, Jörn Schneidewind, and Hartmut Ziegler. Challenges in Visual Data Analysis. In International Conference Information Visualisation (IV), pages 9–16. IEEE Computer Society, 2006.
- [13] Heidi Lam. A Framework of Interaction Costs in Information Visualization. IEEE Transactions on Visualization and Computer Graphics, 14(6):1149–1156, 2008.
- [14] Donald A. Norman. The Design of Everyday Things, Revised and Expanded Edition. Basic Books, 2013.
- [15] Dominik Sacha, Andreas Stoffel, Bum Chul Kwon, Geoffrey Ellis, and Daniel A. Keim. Knowledge Generation Model for Visual Analytics. IEEE Transactions on Visualization and Computer Graphics, 20(12):1604–1613, 2014.
- [16] Ben Shneiderman. Dynamic Queries for Visual Information Seeking. IEEE Software, 11(6):70–77, 1994.
- [17] Ben Shneiderman. The Eyes Have It: A Task by Data Type Taxonomy for Information Visualizations. In IEEE Symposium on Visual Languages (VL), pages 336–343. IEEE Computer Society, 1996.
- [18] Elizaveta Sorokina, Pnina Soffer, Irit Hadar, Uri Leron, Francesca Zerbato, and Barbara Weber. PEM4PPM: A cognitive perspective on the process of process mining. In International Conference on Business Process Management, pages 465–481. Springer, 2023.
- [19] Christian Tominski and Heidrun Schumann. Interactive Visual Data Analysis. AK Peters Visualization Series. CRC Press, 2020.
- [20] Stef van den Elzen and Jarke J. van Wijk. Small Multiples, Large Singles: A New Approach for Visual Data Exploration. Computer Graphics Forum, 32(3):191–200, 2013.
- [21] Jarke J. van Wijk. Views on Visualization. IEEE Transactions on Visualization and Computer Graphics, 12(4):421–433, 2006.
- [22] Jo Vermeulen, Kris Luyten, Elise van den Hoven, and Karin Coninx. Crossing the bridge over norman’s gulf of execution: revealing feedforward’s true identity. In Conference on Human Factors in Computing Systems, pages 1931–1940. ACM, 2013.
- [23] Wesley Willett, Jeffrey Heer, and Maneesh Agrawala. Scented widgets: Improving navigation cues with embedded visualizations. IEEE Trans. Vis. Comput. Graph., 13(6):1129–1136, 2007.
- [24] Ji Soo Yi, Youn ah Kang, John T. Stasko, and Julie A. Jacko. Toward a Deeper Understanding of the Role of Interaction in Information Visualization. IEEE Transactions on Visualization and Computer Graphics, 13(6):1224–1231, 2007.
- [25] Francesca Zerbato, Andrea Burattin, Hagen Völzer, Paul Nelson Becker, Elia Boscaini, and Barbara Weber. Supporting provenance and data awareness in exploratory process mining. In International Conference on Advanced Information Systems Engineering, pages 454–470. Springer, 2023.
- [26] Francesca Zerbato, Pnina Soffer, and Barbara Weber. Initial insights into exploratory process mining practices. In Business Process Management Forum: BPM Forum 2021, Rome, Italy, September 06–10, 2021, Proceedings 19, pages 145–161. Springer, 2021.
- [27] Francesca Zerbato, Pnina Soffer, and Barbara Weber. Process mining practices: Evidence from interviews. In Int. Conf. on Business Process Management (BPM), LNCS, pages 268–285. Springer, 2022.
4.4 Coordinated Projections: A New Approach to Multi-Faceted Process Exploration
Barbara Weber (Universität St. Gallen, CH), Gennady Andrienko (Fraunhofer IAIS – Sankt Augustin, DE), Andreas Kerren (Linköping University, SE), Manuel Resinas (University of Sevilla, ES), Stef Van den Elzen (TU Eindhoven, NL), and Peilin Yu (Linköping University, SE)
License: ![]() Creative Commons BY 4.0 International license © Barbara Weber, Gennady Andrienko, Andreas Kerren, Manuel Resinas, Stef Van den Elzen, and Peilin Yu
Creative Commons BY 4.0 International license © Barbara Weber, Gennady Andrienko, Andreas Kerren, Manuel Resinas, Stef Van den Elzen, and Peilin Yu
Working group D (see Figure 21) focused on new visual representations for multi-faceted process exploration.

4.4.1 Motivation
Process exploration constitutes a fundamental task in process mining, primarily aimed at facilitating the exploration and generation of hypotheses about the underlying process behavior captured in event data. In particular, during the initial phases of process mining projects, analysts engage in various exploratory activities – they dedicate time to familiarize themselves with the data, develop a preliminary understanding of the process, formulate or refine analytical questions, and uncover unexpected patterns or insights [6]. This iterative exploration plays a crucial role in shaping the direction of subsequent hypothesis testing [5].
The way process exploration is currently performed typically involves the use of discovered Process Maps, such as the Directly-Follows Graphs (DFGs) [27, 9, 17], where nodes represent activities and edges indicate direct successions based on event log timestamps. Using the DFG as a visual representation to enable exploration generally implies that the primary facet (i.e., the first-class citizen of our analytical workflow) is the temporal order of activities [16].
More detailed insights are often introduced through additional visual channels, such as projecting performance metrics (e.g., activity duration, waiting time) or frequency information (e.g., how often transitions occur) on top of the DFG structure. These additional visual cues enrich the visualization but do not alter the primary facet. This allows the analyst to gain insight on different aspects of the process, such as identifying activities (e.g., activities with high duration, infrequent activities, endpoint activities), fragments (e.g., the most frequent fragment), transitions (e.g., transitions with high durations), or bottlenecks [10].
Less commonly, the DFG can be restructured entirely by using resources as the primary facet [11]. In resource-centric DFGs, nodes represent individuals, roles, or organizational units, and the edges reflect handovers or collaborative interactions. This shift enables analysis of organizational dynamics, revealing patterns such as teamwork structures, silos, or handover inefficiencies.
Despite the value of these perspectives, a major limitation is that the primary facet is typically fixed, constraining the flexibility of exploration. Real-world analytical tasks often require users to continuously shift between facets [17] – from case-centric to activity-centric, from control flow to resource flow, or from process variants to attribute analysis in order to discover inter- and intra-dependencies. Fixing the facet can obscure relevant patterns, reduce user agency, and lead to a cognitive mismatch when visualizations do not align with the user’s current task or mental model [13].
To truly support hypothesis generation and sense-making, process exploration tools must support flexible transitions between facets, allowing analysts to dynamically reframe the data perspective depending on their line of inquiry [17]. Typically, users are interested in exploring similarities and differences between (combinations of) facets, i.e., the visual analysis approach should support more complex comparison tasks. To support this, dimensionality reduction might help here; it is flexible in what facets are considered and helps to reveal similarities (local neighborhoods) in the high-dimensional space.
4.4.2 Approaches
We investigated methods for analyzing event logs from multiple, complementary facets [2], with the goal of decomposing them into smaller, more interpretable subsets. These event log subsets can then be explored in greater detail using compact and more readable representations such as DFGs. To this end, we experimented with both topic modeling [12] and embedding-based techniques [1]111111https://va-embeddings-browser.ivis.itn.liu.se, applying various strategies to represent event logs either as textual documents (for topic modeling) or as structured feature vectors (for embedding). In particular, we started exploring representations that capture both the composition of logs as collections of activities and as sequences of transitions between activities. These representations have potential to account not only for the temporal order in which activities occur, but also incorporate quantitative time aspects such as activity durations and additional contextual attributes. Finally, we explored the possibilities that multiple coordinated views can provide as a way to enhance the analysis process.
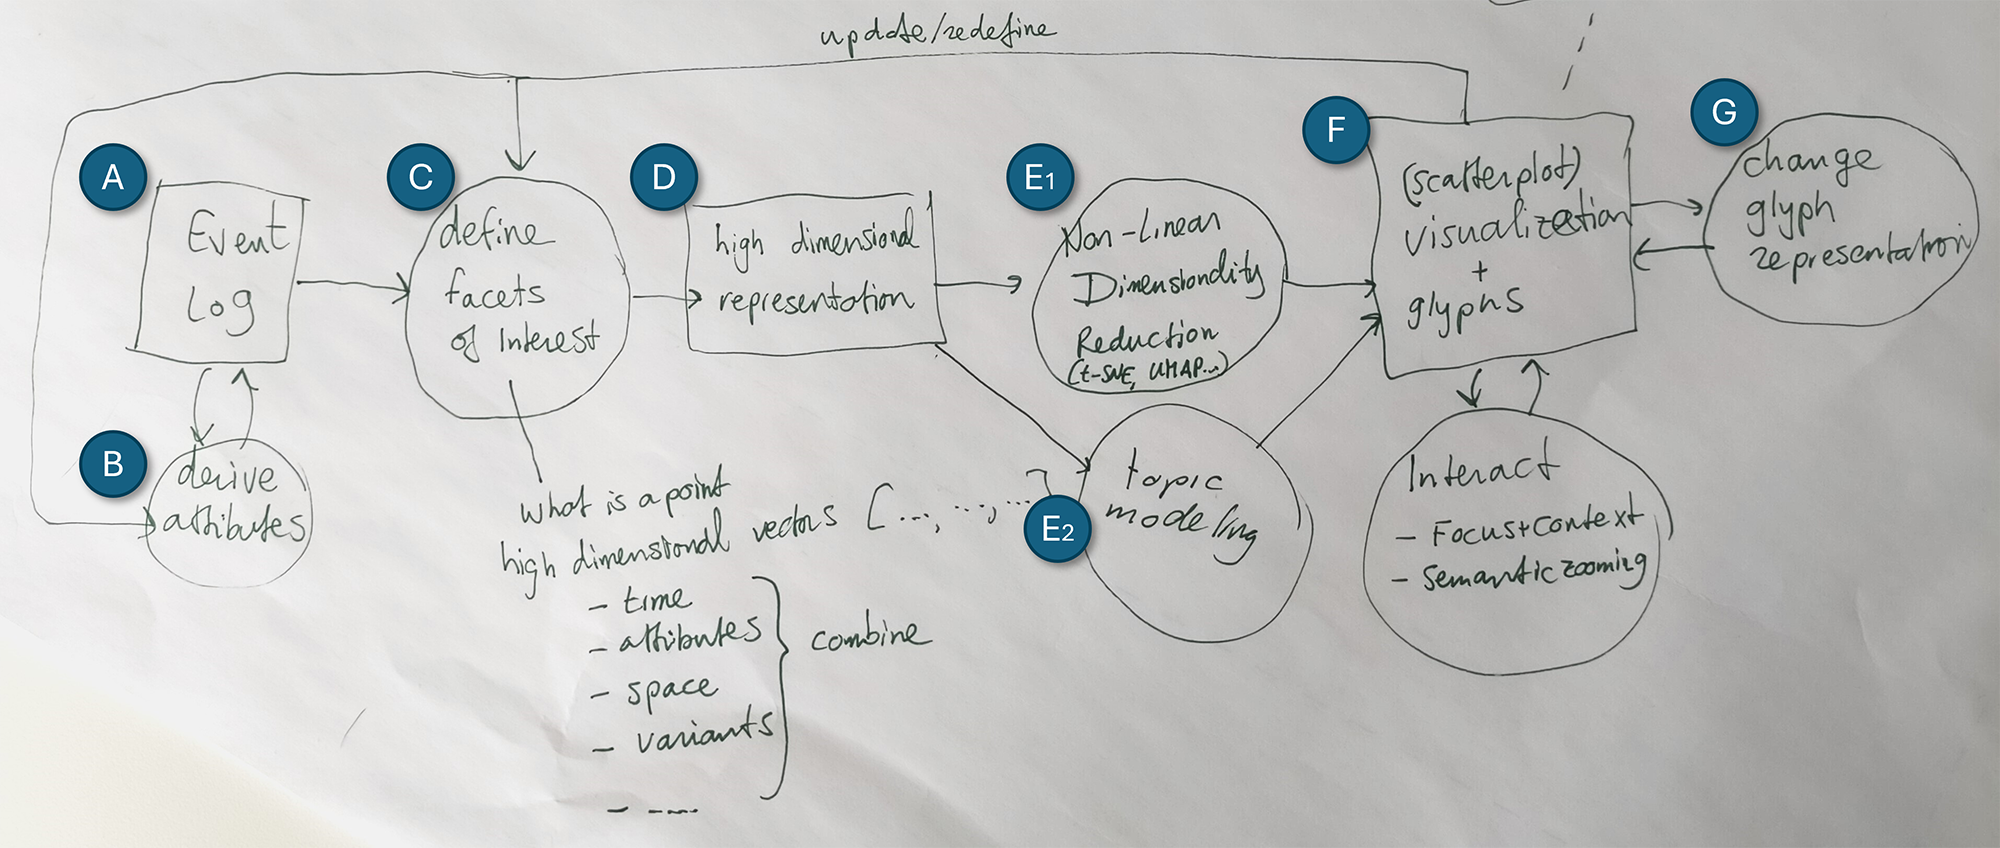
The result of these investigations is summarized in the workflow presented in Figure 22. In the following, we describe each of the steps involved in the workflow.
A. Original Data Set.
We used the publicly available Road Traffic Fine event log as example [4]. The Road Traffic Fines event log documents the handling of traffic fines by a local police force in Italy. It contains approximately 561,470 events across 150,370 cases, recorded between January 2000 and June 2013. The process involves 11 activities and 12 data attributes.
Each case starts with a Create Fine event, which includes the fine amount next to other attributes. The offender can pay the fine at any time via a Payment event. The amount paid is recorded in the attribute paymentAmount. If not paid, a Send Fine action sends a letter, possibly incurring additional charges (expenses). This is followed by Insert Fine Notification and, if necessary, Add Penalty, which increases the amount due. If the fine remains unpaid, an event Send for Credit Collection indicates an escalation to a collection agency. Offenders may also appeal to the prefecture or a judge, triggering events such as Insert Appeal and Notify Result Appeal to Offender. If an appeal is successful, the fine is marked as dismissed via the dismissal attribute.
We selected this dataset because it supports exploration across multiple meaningful facets. It includes a rich combination of control-flow, temporal, and data perspectives. Events are timestamped, enabling the discovery of relevant temporal constraints (e.g., the fine notification must be sent within 90 days of the fine creation; otherwise, there is no obligation to pay). In addition, the event log captures a variety of attributes, such as amount, expense, totalPaymentAmount, and appeal results (attribute dismissal containing a flag whether and by whom the fine is dismissed). These attributes enable the identification of patterns within specific subpopulations of cases and help correlate behavioral differences with underlying data characteristics. This multidimensionality makes the dataset particularly well-suited for studying the need for flexible faceting and for supporting dynamic transitions between different analytical perspectives during process exploration.
B. From Event Log to Enriched Case Log.
We then transformed the event log into a case log and enriched it using case predicates as suggested in [7]. More specifically, we enriched the case log with process outcomes. For this, each case was assigned a specific outcome of the process (that is, fully paid, dismissed, credit collected, and unresolved) according to [7]. Fully paid cases are cases where the last outstanding balance is to 0. Dismissed cases are cases with the dismissal code . Cases are assigned the label credit collected if activity Send for Credit Collection is present in the trace. The remaining cases were then classified as unresolved. Moreover, we added to the enriched case log the value of the dismissal attribute of the last activity of the case, as well as a derived attribute outstandingBalance, which is calculated as the sum of amounts plus the sum of expenses minus totalPaymentAmount.
C. Define Facets of Interest.
To explore the facets of interest within the process data, we employ dimensionality reduction or topic modeling techniques to project high-dimensional attribute representations into a two-dimensional space suitable for visualization. This allows us to generate scatterplots in which each point corresponds to a specific process element, such as a case, activity, variant, or resource, depending on the analytical perspective adopted (e.g., similar to earlier work on dynamic network exploration [26]).
The goal of this step is therefore to determine which process elements will be represented as individual points and which attributes will define their position in the projection space. These attributes are selected based on the analytical goal and may capture various process dimensions. These include control-flow characteristics (e.g., activity sequences, frequency patterns), outcome-related indicators (e.g., outstanding balance, dismissal codes), contextual attributes (e.g., vehicle class, notification type), temporal aspects (e.g., activity duration, case throughput time), or process variants (e.g., distinct execution paths).
In this work, we focus exclusively on representing cases as points in the scatterplot, using attributes related to control flow and outcome indicators to construct the projections.
D. Multi-faceted Trace Encoding.
Based on the selected facets of interest, we used the the original and the enriched case log to implement several different alternative encodings in a high-dimensional space. These encodings will then be used as input for the topic modeling and dimensionality reduction step.
For topic modeling, we considered representing traces as sets of activities and as sets of direct transitions between the activities. For example, having trace of consecutive activities A, B, and C, we represent either as a string A B C or as a string A_B B_C, reflecting activities and their transitions, accordingly. The third variant combines both representations, uniting two alternative viewpoints A B C A_B B_C.
For DR, we constructed two different encodings that covered different facets of the dataset. The first encoding focused on attributes deemed relevant to the outcome of each case [7]. Specifically, we included two attributes to represent whether the outstandingBalance and the totalPaymentAmount are greater than zero. We also included the dismissal code from the enriched case log and the last activity recorded in each case, since it helps to determine the outcome of the case if it goes to credit collection. Since both the dismissal code and the last activity are categorical attributes, we applied one-hot encoding to allow the application of a DR algorithm in the next step.
The second encoding was designed to capture the sequence of activities performed within each case. For this purpose, we extracted the sequence of activities for every case, preserving their order of execution. Since cases can vary in the number of activities, we padded shorter sequences with a special padding token to ensure all sequences had the same length, matching the case with the highest number of activities. This preprocessing step resulted in an matrix, where is the total number of cases, and represents the length of the longest case. Finally, we applied one-hot encoding to each column of the matrix, expanding the matrix into a higher-dimensional format where categorical activity labels are represented in a numerical form.
E. Non-Linear Dimensionality Reduction and Topic Modeling.
We then applied dimensionality reduction techniques as well as topic modeling using the multi-faceted trace encodings described above. Here we opted for a non-linear dimensionality reduction techniques to support the exploration of similarities such as UMAP or t-SNE [14].
F. Visualization and Interaction.
To support the exploration of the DR results we use a coordinated multiple view approach [3] in which two or more visualizations are connected through linking and brushing (see Figure 23), i.e., if items in one visualization are highlighted or selected, the corresponding items in the other visualization are also highlighted or selected.
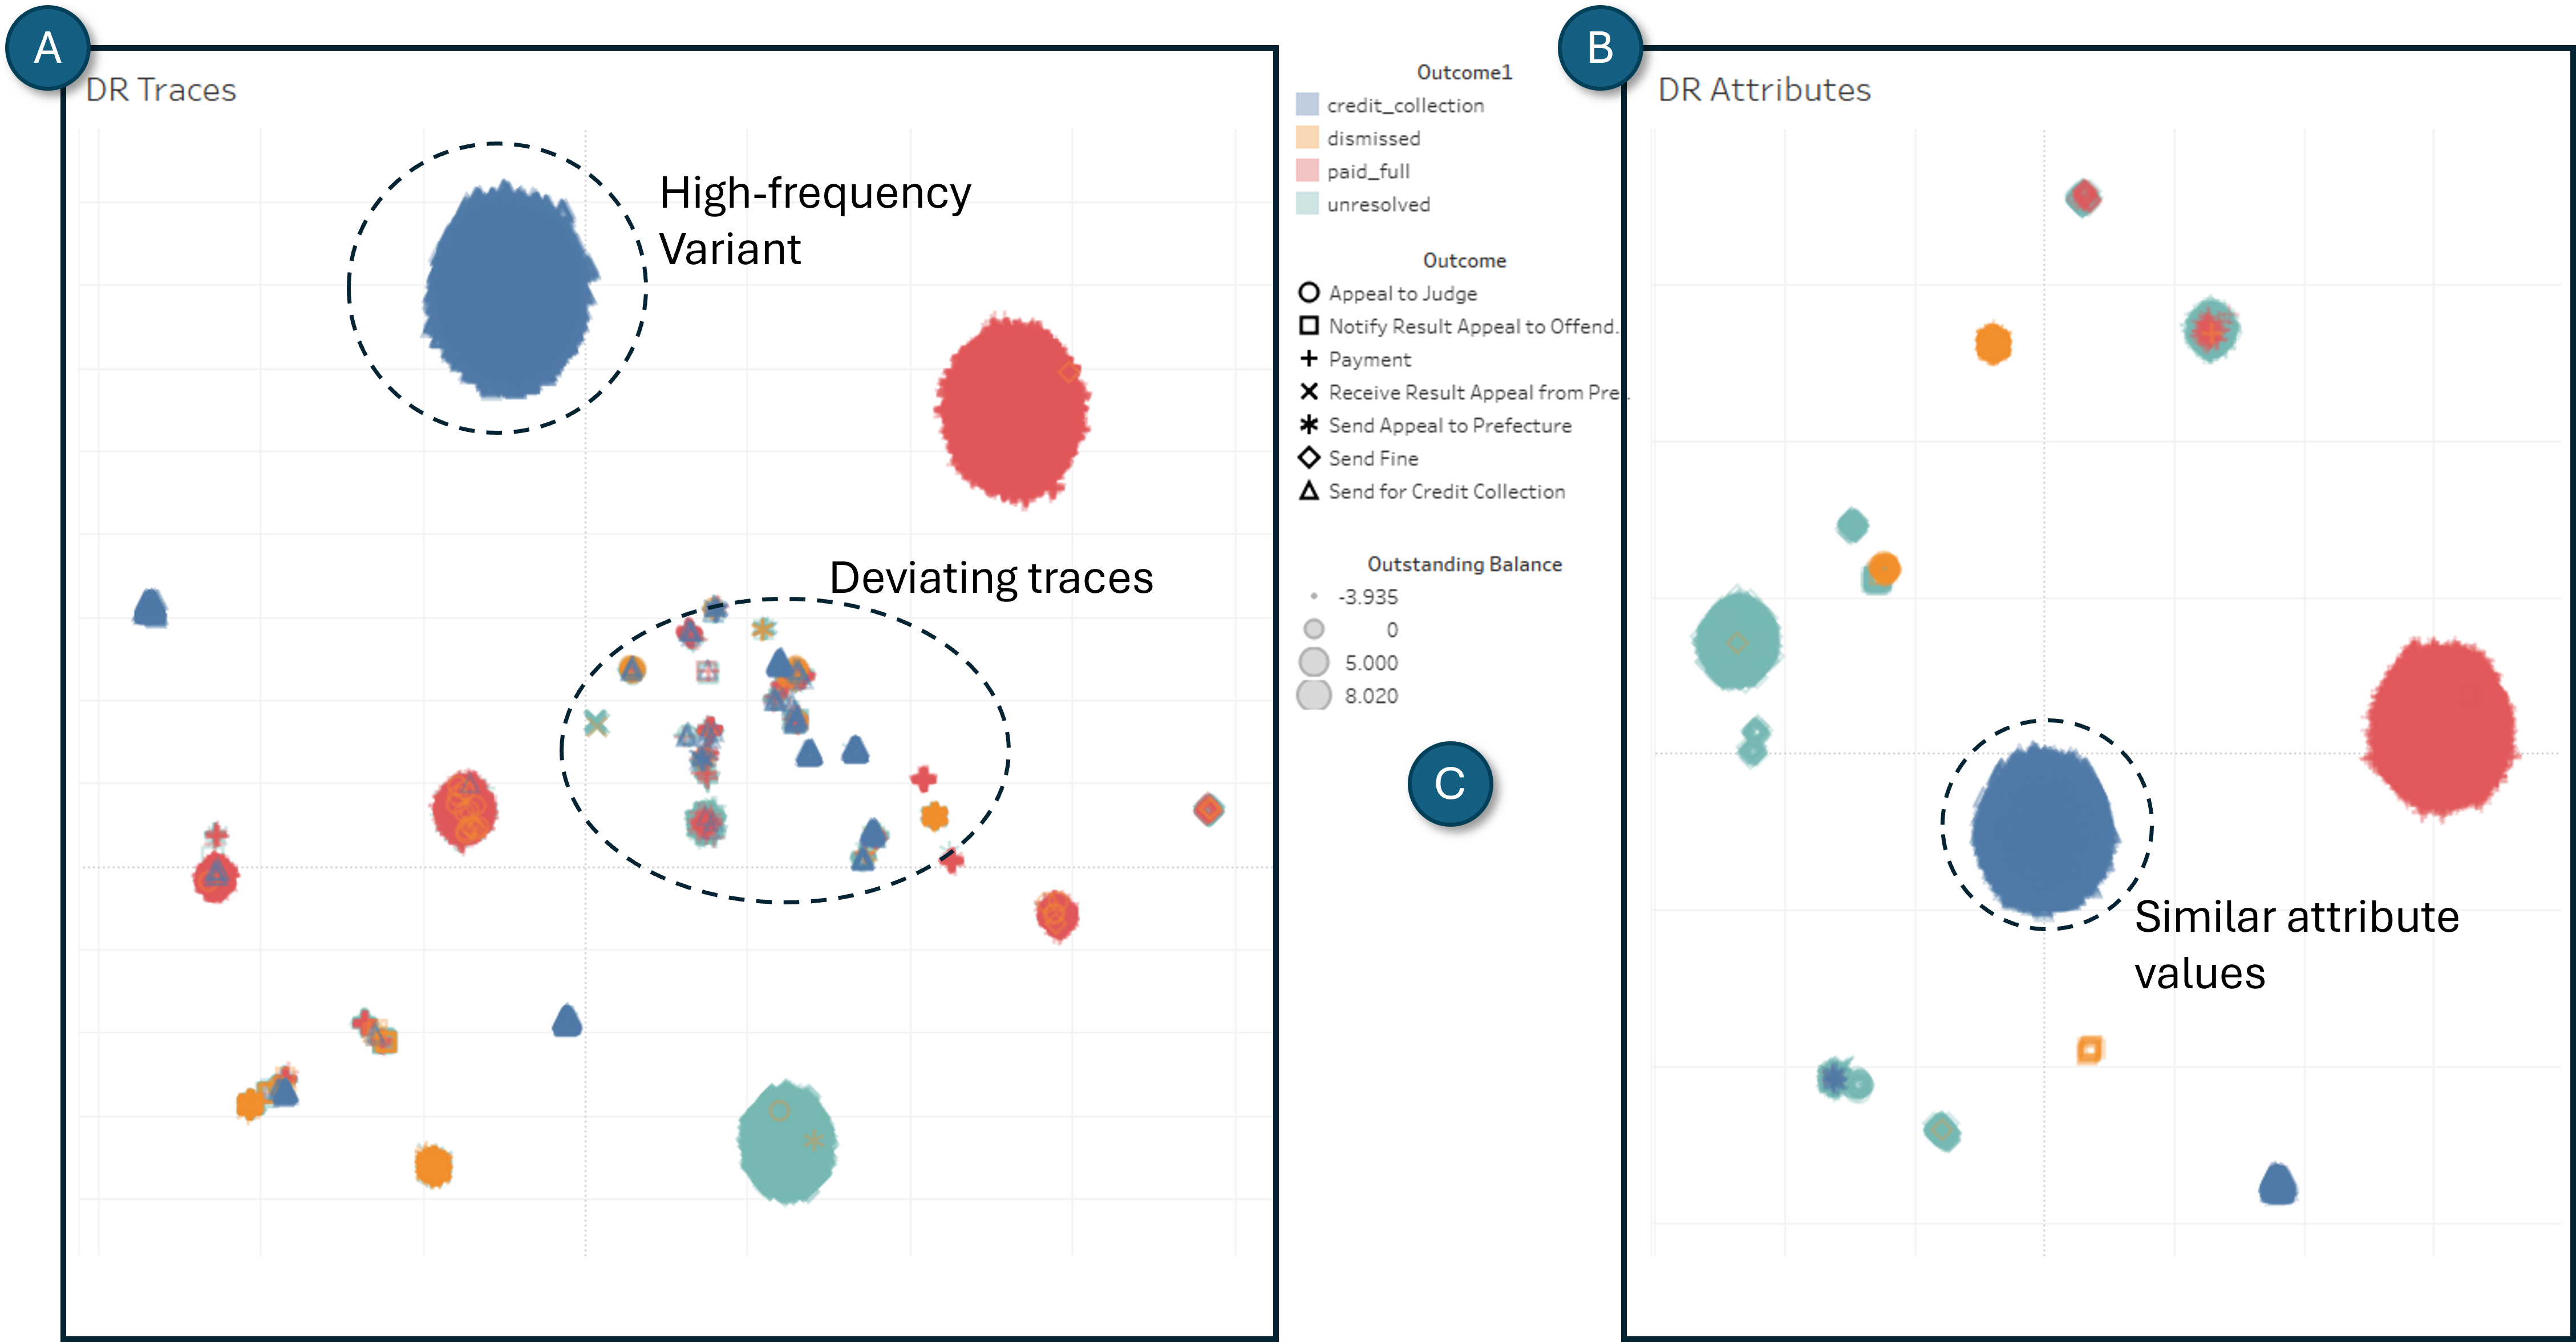
This enables users to explore the different data-facets in context of each other, see Figure 24 (e.g., explore the correlation between temporal order and data attributes). For the visualization of the DR result, the most used choice is a scatterplot-like representation. This has the advantage that the main facet of interest is encoded with the highest ranked visual channel of position [24]. To encode the additional facets, we can then use additional visual channels, such as color, shape, and size. However, as these channels are limited, we propose to use glyphs (cf. next paragraph) to encode the additional facets. The scatterplot also enables a scalable solution with respect to the number of items as here interaction techniques such as focus+context and semantic zooming alleviate overplotting issues.
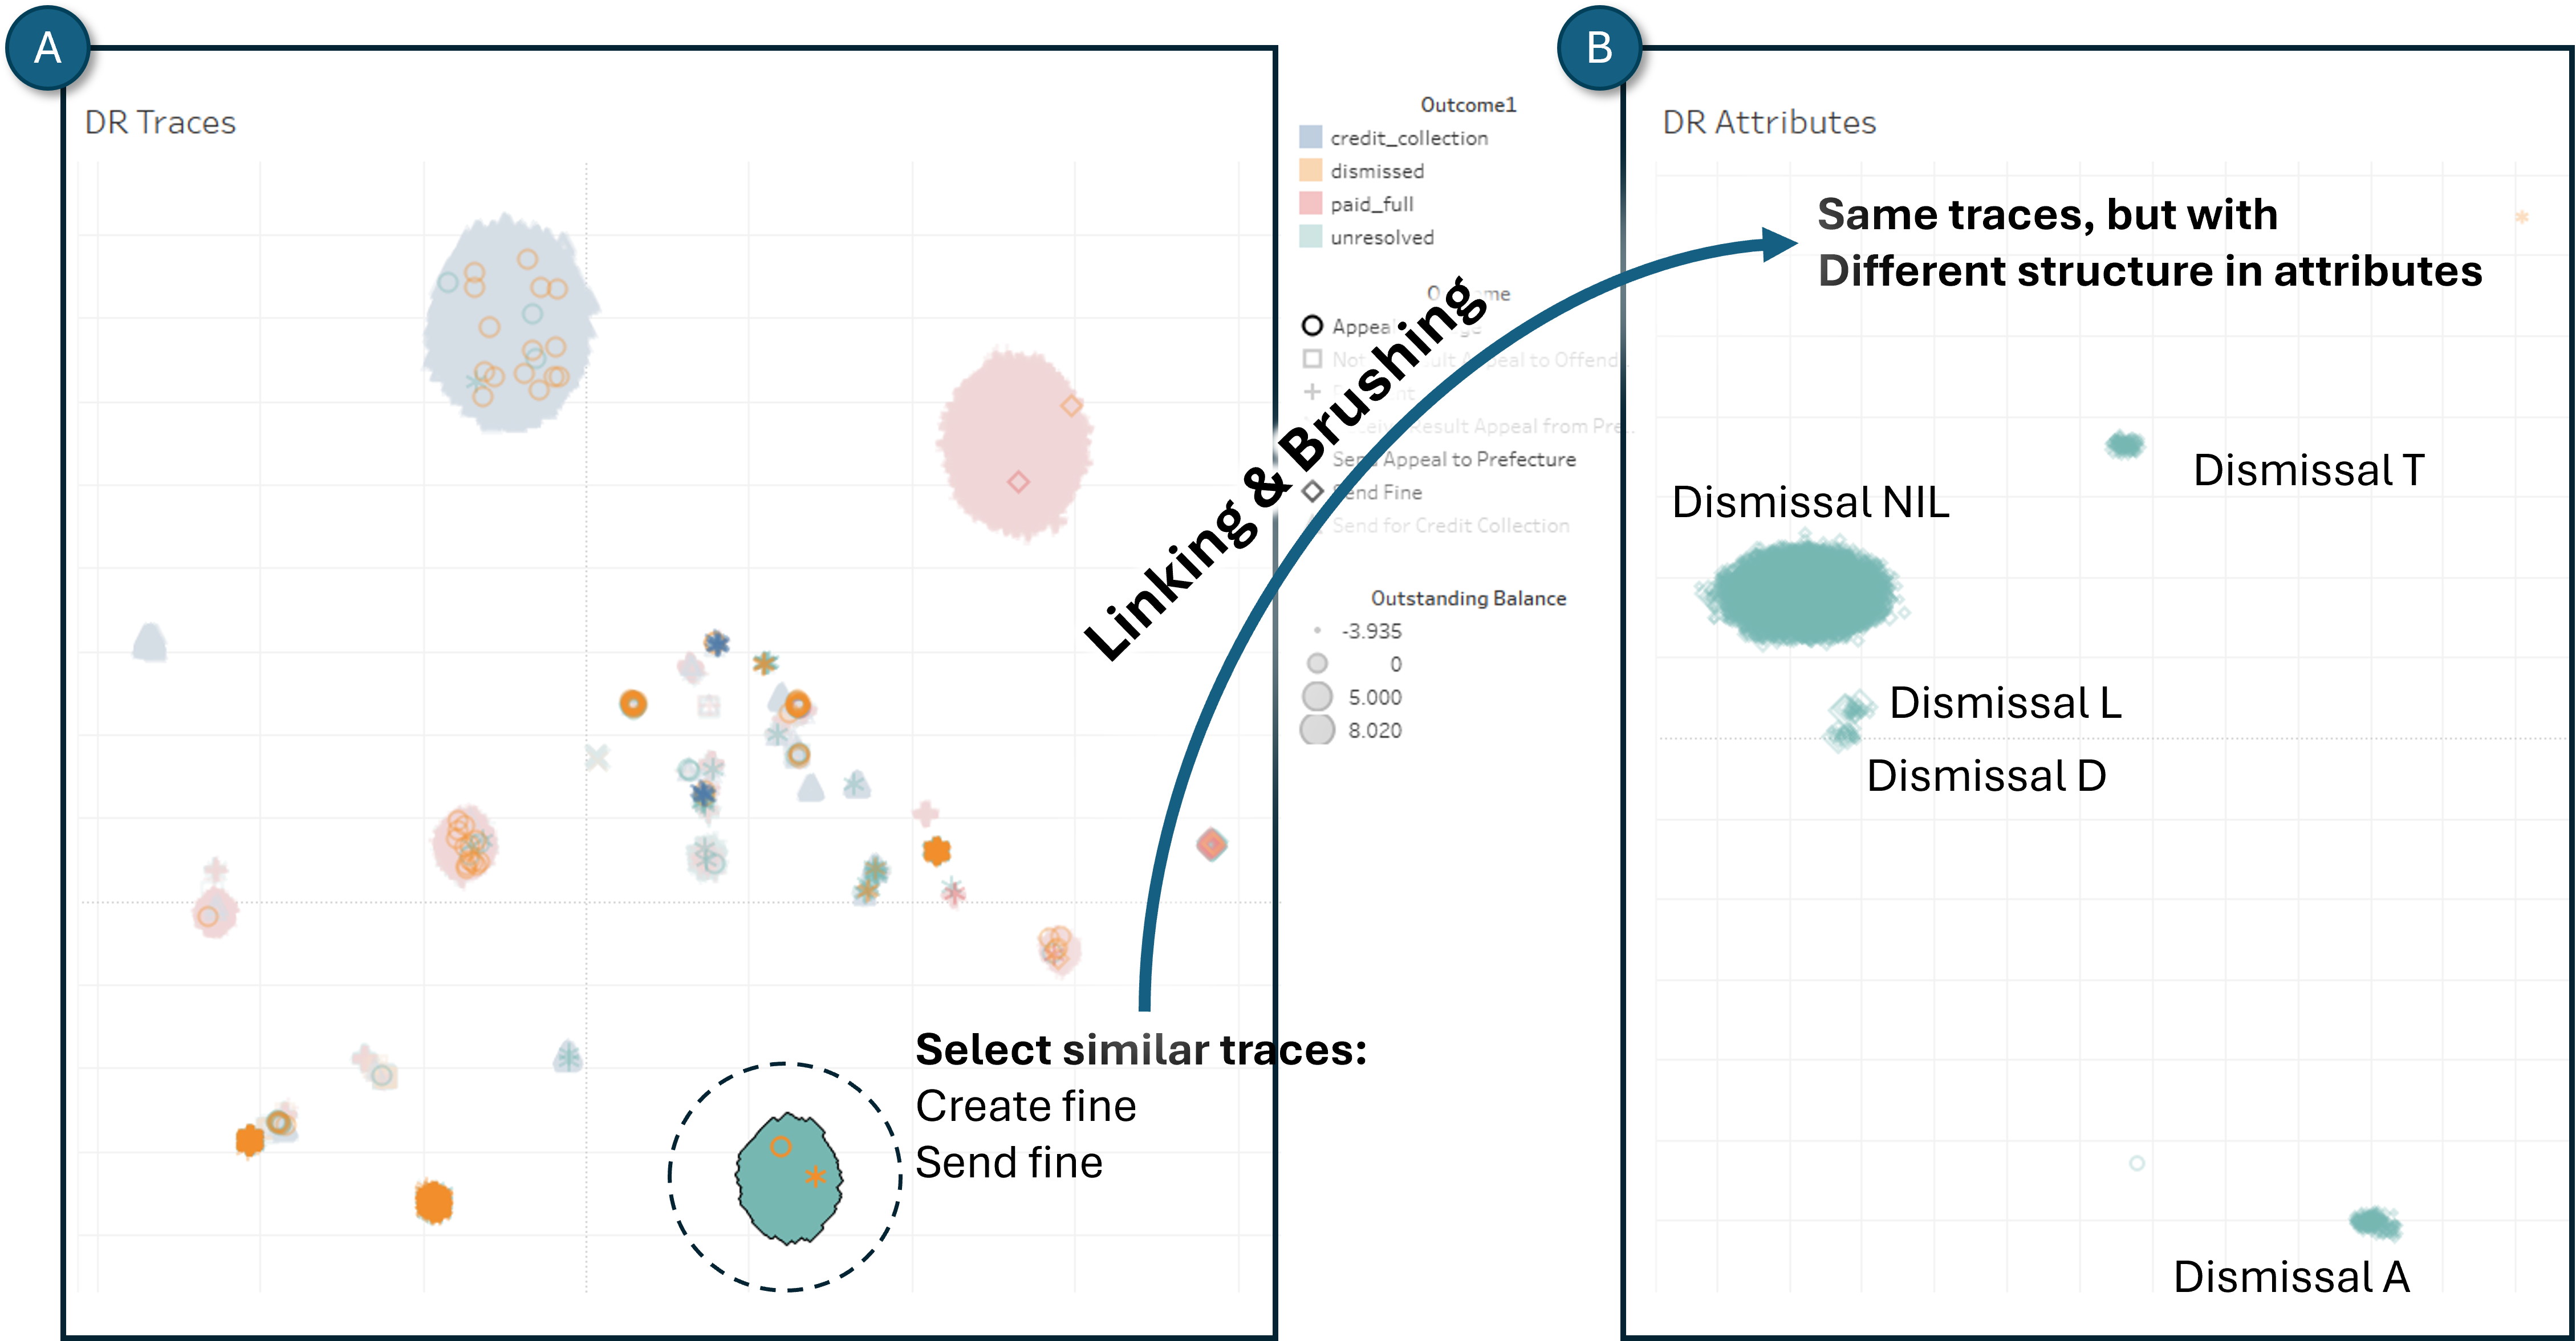
We have also applied topic modeling (see Figure 25) based on the combined representation of traces as sets of events and transitions between events. To validate the results, we made three UMAP projections (see Table 1) of all traces based on weights of topics, orders, and attributes of the logs. These projections have been colored according to outcomes of the traces (3rd column), main topic (fourth column), and also propagated continuous 2D color schemes (shown in the 2nd column) across the three projections (columns 5-7).
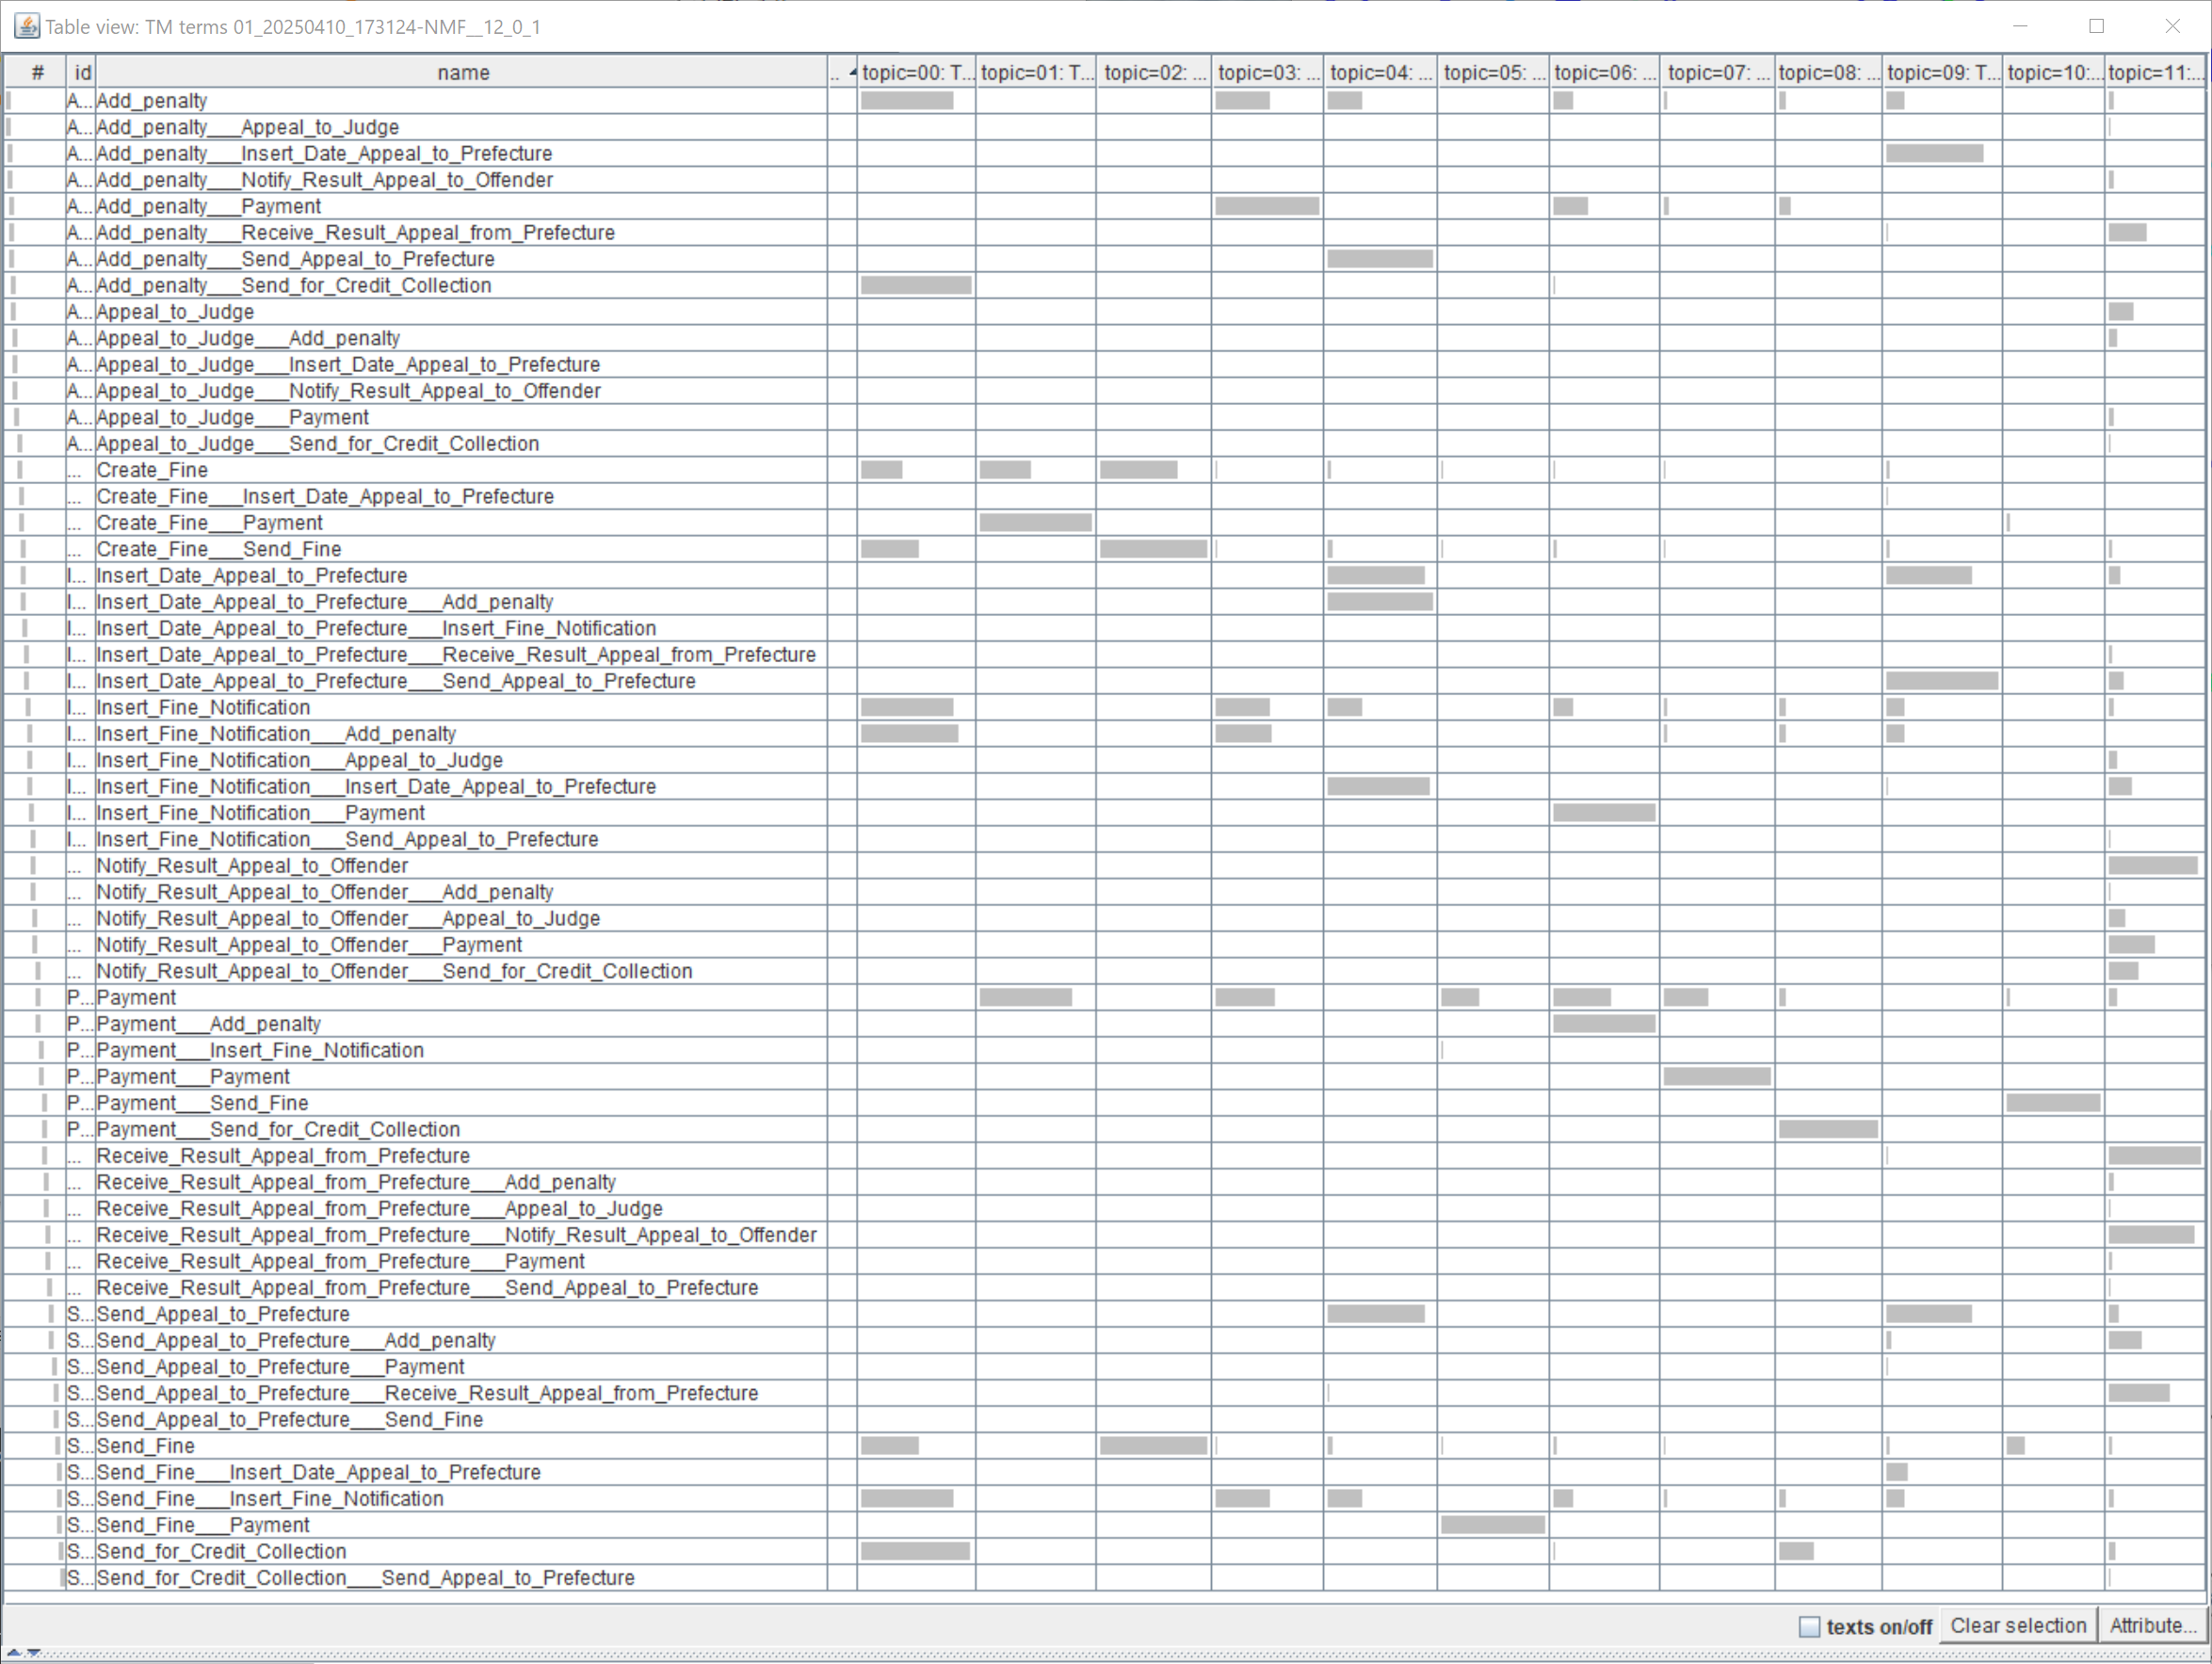
| Base File | - | -outcome | -mainTopic | -topics | -order | -attrs |
|---|---|---|---|---|---|---|
![[Uncaptioned image]](umapByTopics.png) |
![[Uncaptioned image]](umapByTopics-.png) |
![[Uncaptioned image]](umapByTopics-outcomes.png) |
![[Uncaptioned image]](umapByTopics-mainTopic.png) |
![[Uncaptioned image]](umapByTopics-stef.png) |
![[Uncaptioned image]](umapByTopics-attrs.png) |
|
![[Uncaptioned image]](umapByStef.png) |
![[Uncaptioned image]](umapByStef-.png) |
![[Uncaptioned image]](umapByStef-outcome.png) |
![[Uncaptioned image]](umapByStef-mainTopic.png) |
![[Uncaptioned image]](umapByStef-topics.png) |
![[Uncaptioned image]](umapByStef-attrs.png) |
|
![[Uncaptioned image]](umapByAttrs.png) |
![[Uncaptioned image]](umapByAttrs-.png) |
![[Uncaptioned image]](umapByAttrs-outcome.png) |
![[Uncaptioned image]](umapByAttrs-mainTopic.png) |
![[Uncaptioned image]](umapByAttrs-topics.png) |
![[Uncaptioned image]](umapByATtrs-stef.png) |
G. Changing Glyphs.
Prior research demonstrates that glyph-based representations can be employed across diverse application domains and serve a variety of analytical and communicative purposes. Various design alternatives of the most commonly used glyph types have been examined and discussed in numerous prior studies [18, 19, 20].
Multiple data attributes can be encoded within a single glyph, either to represent multiple properties of a single entity or to aggregate information across multiple entities. Additionally, certain glyph types (e.g., face-based and icon-based representations) typically exhibit a one-to-one mapping between glyph and data entity. Different glyph types can be combined to encode more complex data facets. However, excessive data encoding within a single glyph may result in visual clutter or scalability issues, potentially impairing perceptual efficiency [18]. Layout strategies for glyph drawing commonly include linear and circular or radial configurations. While radial layouts can yield visually engaging designs, they should not be regarded as universally optimal solutions for all information visualization challenges [21]. Recent studies in information visualization have proposed methods for the automatic generation of glyph designs to facilitate creating effective and context-appropriate representations [22, 23]. In addition to the primary selected facet, alternative layout designs can be employed based on supplementary facets of interest and the specific analytical tasks at hand.
Two prototype designs for encoding and representing Boolean, quantitative attributes, directly-follows relations, and temporal information are shown in Figure 26. In both designs, the Boolean attribute is encoded using the inner circle, which is rendered in black by default when the Boolean value is false. The left design utilizes a surrounding radial bar chart to convey quantitative values across a defined range, whereas the right design integrates additional visual encodings to represent directly-follows relations and temporal progression.
The scatter plot, generated via dimensionality reduction, serves as an overview of high-dimensional data. Upon user selection of individual or multiple scatter points, a corresponding glyph-based representation is activated to reveal detailed attribute-level information. Users can interactively customize the glyphs to control which attributes are displayed, apply filters, or adjust visual encoding parameters, thereby supporting flexible, multi-faceted, and task-driven exploration of the underlying data.
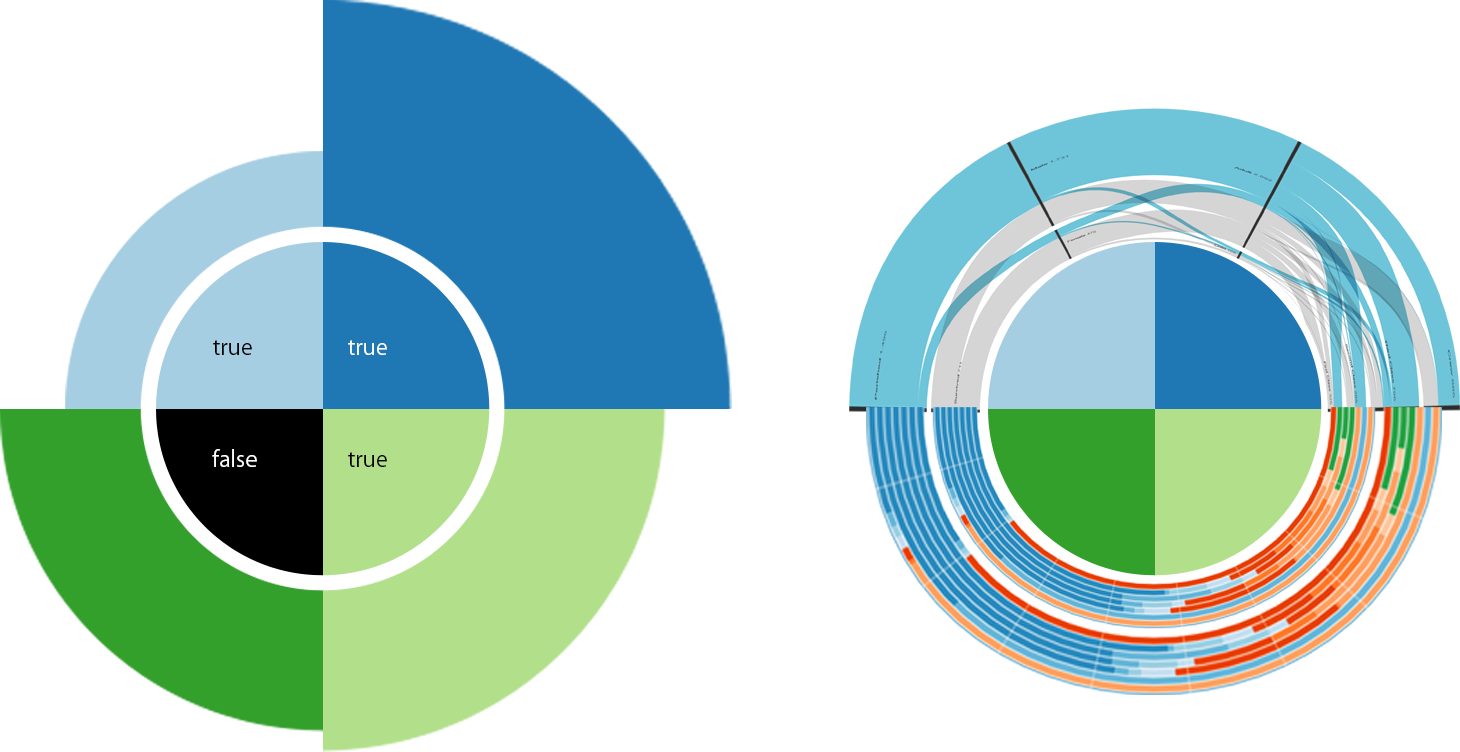
4.4.3 Outlook
As part of future work, we plan to implement a comprehensive visual analytics system that builds on our current approach. In the current system design, each dot in the visualization represents a case positioned using DR techniques. Moving forward, we aim to explore alternative semantic representations for dots, such as activities or process variants. Moreover, we would like to systematically investigate how to encode activities, variants, and traces in a multi-faceted manner to best support various exploratory goals. To further enrich the visual expressiveness, we plan to integrate glyph-based representations that convey additional attributes or contextual cues (e.g., for selected subpopulations). Moreover, we intend to integrate our approach with existing process discovery algorithms to support the creation of DFGs for selected subpopulations. Additionally, we intend to expand the visual space to support additional facets, including relationships, control-flow, and resources. Another interesting research direction is to study ensemble methods for embeddings where various embedding approaches might be combined (either conceptually different state-of-the-art embedding technologies or the same embedding algorithm with various hyperparameter settings) to provide better performance [15]. A key objective of our future work will be to evaluate the effectiveness of the proposed system in supporting exploratory process mining, demonstrating its ability to accommodate a wide range of analytical tasks and user needs.
References
- [1] Zeyang Huang, Daniel Witschard, Kostiantyn Kucher, Andreas Kerren. VA + Embeddings STAR: A State-of-the-Art Report on the Use of Embeddings in Visual Analytics. In Comput. Graph. Forum 42, vol. 42, no. 3, pp. 539-571. 2023.
- [2] Johannes Kehrer, and Helwig Hauser. Visualization and Visual Analysis of Multifaceted Scientific Data: A Survey. In IEEE Transactions on Visualization and Computer Graphics, vol. 19, no. 3, pp. 495–513, March 2013.
- [3] Jonathan C. Roberts. State of the art: Coordinated & multiple views in exploratory visualization. In Fifth international conference on coordinated and multiple views in exploratory visualization (pp. 61-71). IEEE. 2007.
- [4] Massimiliano de Leoni and Felix Mannhardt. Road traffic fine management process. Eindhoven University of Technology, Dataset, 284, 2015.
- [5] Elizaveta Sorokina, Pnina Soffer, Irit Hadar, Uri Leron, Francesca Zerbato, and Barbara Weber. PEM4PPM: A Cognitive Perspective on the Process of Process Mining. In Chiara Di Francescomarino, Andrea Burattin, Christian Janiesch, and Shazia Sadiq (Eds.), Business Process Management – 21st International Conference, BPM 2023, Utrecht, The Netherlands, September 11-15, 2023, Proceedings, volume 14159 of Lecture Notes in Computer Science, pages 465–481. Springer, 2023.
- [6] Francesca Zerbato, Pnina Soffer, and Barbara Weber. Initial Insights into Exploratory Process Mining Practices. In Artem Polyvyanyy, Moe Thandar Wynn, Amy Van Looy, and Manfred Reichert (Eds.), Business Process Management Forum – BPM Forum 2021, Rome, Italy, September 06-10, 2021, Proceedings, volume 427 of Lecture Notes in Business Information Processing, pages 145–161. Springer, 2021.
- [7] Hagen Völzer, Francesca Zerbato, Timothy Sulzer, and Barbara Weber. A Fresh Approach to Analyze Process Outcomes. In 5th International Conference on Process Mining, ICPM 2023, Rome, Italy, October 23-27, 2023, pages 97–104. IEEE, 2023.
- [8] Christopher Klinkmüller, Richard Müller, and Ingo Weber. Mining Process Mining Practices: An Exploratory Characterization of Information Needs in Process Analytics. In Thomas Hildebrandt, Boudewijn F. van Dongen, Maximilian Röglinger, and Jan Mendling (Eds.), Business Process Management, volume 11675 of Lecture Notes in Computer Science, pages 322–337. Springer International Publishing, 2019.
- [9] Carlos Capitán-Agudo, María Salas-Urbano, Cristina Cabanillas, and Manuel Resinas. Analyzing How Process Mining Reports Answer Time Performance Questions. In Business Process Management, volume 13420 of Lecture Notes in Computer Science, pages 234–250. Springer International Publishing, 2022.
- [10] María Salas-Urbano, Carlos Capitán-Agudo, Cristina Cabanillas, and Manuel Resinas. Designing a User Interface to Explore Collections of Directly-Follows Graphs for Process Mining Analysis. In Enterprise, Business-Process and Information Systems Modeling – 25th International Conference, BPMDS 2024, and 29th International Conference, EMMSAD 2024, Limassol, Cyprus, June 3-4, 2024, Proceedings, volume 511 of Lecture Notes in Business Information Processing, pages 35–47. Springer, 2024.
- [11] Minseok Song and Wil M. P. van der Aalst. Towards comprehensive support for organizational mining. Decision Support Systems, 46(1):300–317, December 2008.
- [12] David M Blei, Andrew Y Ng, and Michael I Jordan. Latent dirichlet allocation. Journal of Machine Learning Research, 3:993–1022, 2003.
- [13] Johannes Kehrer and Helwig Hauser. Visualization and visual analysis of multifaceted scientific data: A survey. IEEE Trans. Vis. Comput. Graph., 19(3):495–513, 2013.
- [14] Mateus Espadoto, Rafael M. Martins, Andreas Kerren, Nina ST Hirata, and Alexandru C. Telea. Toward a Quantitative Survey of Dimension Reduction Techniques. IEEE Trans. Vis. Comput. Graph., 27(3):2153–2173, 2021.
- [15] Daniel Witschard, Ilir Jusufi, Rafael Messias Martins, and Andreas Kerren. A Statement Report on the Use of Multiple Embeddings for Visual Analytics of Multivariate Networks. Proceedings of the 16th International Joint Conference on Computer Vision, Imaging and Computer Graphics Theory and Applications (VISIGRAPP 2021) – IVAPP, pages 219–223, 2021.
- [16] Wil M. P. van der Aalst. Process Mining – Data Science in Action, Second Edition. Springer, 2016.
- [17] Silvia Miksch, Claudio Di Ciccio, Pnina Soffer, and Barbara Weber. Visual Analytics Meets Process Mining: Challenges and Opportunities. IEEE Computer Graphics and Applications, 44(6):132–141, 2024.
- [18] Chun-houh Chen, Wolfgang Härdle, Antony Unwin, and Matthew O. Ward. Multivariate data glyphs: Principles and practice. Handbook of data visualization 179-198, 2008.
- [19] Johannes Fuchs, Petra Isenberg, Anastasia Bezerianos, and Daniel Keim. A systematic review of experimental studies on data glyphs. IEEE transactions on visualization and computer graphics, 2016, 23(7), 1863–1879.
- [20] Mandy Keck, Dietrich Kammer, Thomas Gründer, Thomas Thom, Martin Kleinsteuber, Alexander Maasch, and Rainer Groh. Towards glyph-based visualizations for big data clustering. Proceedings of the 10th international symposium on visual information communication and interaction, 2017, 129–136
- [21] Geoffrey M. Draper, Yarden Livnat, and Richard F. Riesenfeld. A survey of radial methods for information visualization. IEEE transactions on visualization and computer graphics 2009, 15(5), 759–776.
- [22] Lu Ying, Tan Tang, Yuzhe Luo, Lvkeshen Shen, Xiao Xie, Lingyun Yu, and Yingcai Wu. GlyphCreator: Towards example-based automatic generation of circular glyphs. IEEE Transactions on Visualization and Computer Graphics, 2021, 28(1), 400–410.
- [23] Lu Ying, Xinhuan Shu, Dazhen Deng, Yuchen Yang, Tan Tang, Lingyun Yu, and Yingcai Wu. MetaGlyph: Automatic generation of metaphoric glyph-based visualization. IEEE Transactions on Visualization and Computer Graphics, 2022, 29(1), 331–341.
- [24] Tamara Munzner. Visualization analysis and design. CRC press, 2014.
- [25] Kammer, Dietrich, Mandy Keck, Thomas Gründer, Alexander Maasch, Thomas Thom, Martin Kleinsteuber, and Rainer Groh. Glyphboard: Visual Exploration of High-Dimensional Data Combining Glyphs with Dimensionality Reduction. In IEEE Transactions on Visualization and Computer Graphics, vol. 26, no. 4, pp. 1661–1671, 2020.
- [26] Stef van den Elzen, Danny Holten, Jorik Blaas, and Jarke J. van Wijk. Reducing Snapshots to Points: A Visual Analytics Approach to Dynamic Network Exploration. In IEEE Transactions on Visualization & Computer Graphics, vol. 22, no. 1, pp. 1–10, Jan. 2016.
- [27] Lisa Zimmermann, Francesca Zerbato, Kristina Vrotsou, and Barbara Weber. A process-oriented approach to analyze analysts’ use of visualizations: Revealing insights into the what, when, and how. Computer Graphics Forum, vol. 44, no. 3, 2025.
4.5 Towards Visual Process Analytics for Process Ecosystems
Giovanni Meroni (Technical University of Denmark – Lyngby, DK), Natalia V. Andrienko (Fraunhofer IAIS – Sankt Augustin, DE), Iris Beerepoot (Utrecht University, NL), Claudio Di Ciccio (Utrecht University, NL), Cagatay Turkay (University of Warwick – Coventry, GB), and Tatiana von Landesberger (Universität Köln, DE)
License: ![]() Creative Commons BY 4.0 International license © Giovanni Meroni, Natalia V. Andrienko, Iris Beerepoot, Claudio Di Ciccio, Cagatay Turkay, and Tatiana von Landesberger
Creative Commons BY 4.0 International license © Giovanni Meroni, Natalia V. Andrienko, Iris Beerepoot, Claudio Di Ciccio, Cagatay Turkay, and Tatiana von Landesberger
4.5.1 Introduction
The surge in the digitalization of processes has catered for an abundance of recorded data. Process mining successfully leverages this renownedly precious information source for knowledge acquisition and enhancement, thus garnering significant attention in research and industry alike. Digitalization, on the other side, has also spurred the transcend of business landscapes beyond the silos of single processes, departments, or organisations [1]. While favouring the hyperconnection of expertise and knowledge, it has also exposed the limits of classical process mining, whose techniques are typically designed to focus on those silos. Events like the outbreak of pandemics in healthcare, the domino effect of stock market agitations in finance, and the blockades caused by issues along logistic routes in supply chain management, disruptively illustrated the expansion in space and time of events well beyond the boundaries of their locality.
We are experiencing a more and more predominant passage from an architecture of processes [2] to what we call a process ecosystem. Recent advances in the scientific literature call for multi-perspective, inter-instance, cross-process approaches [3]. Beyond the technical objectives of efficacy and scalability for this new wave of approaches, we claim in this paper that an expressive, appropriate, effective analysis of data from hyperconnected settings is key to pursuing the ultimate aim of knowledge extraction. To this end, we advocate the integration of process analytics to propel the potential of process mining and significantly contribute to its capability to handle process ecosystems.
4.5.2 Motivating Example
To motivate our work, we consider the organization of a scientific conference. To achieve this, the process of reviewing papers has to be enacted. The process is organized as follows: authors create new submissions by sending their abstract and full paper. The program chair then assigns the papers to review to program committee (PC) members. PC members then review the papers, potentially delegating the task to subreviewers. Once the review deadline expires, PC members begin discussing their reviews with senior PC members. Once the discussion is over, program chairs take the final decision on the paper and, in case of acceptance, the authors submit a camera-ready version of their paper.
This process encompasses several interrelated activities, such as submitting papers, assigning papers, writing reviews, discussing reviews, and taking decisions. Such activities involve different resources, such as papers, reviews, and comments. They are also performed by actors under different roles, such as authors, (senior) PC members, and program chairs. It is also worth noting that the same resource may participate in different activities carried out by different actors, and the same actor may perform different activities, or the same activity multiple times, depending on the involved resource.
To support the review process, the conference organizers rely on a Conference Management System (CMS). Instead, other supporting processes, such as participating in PC meetings and discussions, happen outside the CMS through other channels, such as email or videoconferencing applications. These processes are influenced by and influence the review process, as they all share a subset of actors and resources. Figure 27 shows an Enterprise Architecture [4] model that captures the activities, the objects, the supporting applications, and the roles that the actors have in this example.
Key Goals and Tasks
The steering committee would like to improve the knowledge transfer from the organizers of the previous edition of the conference, to the ones of the current edition. To this aim, the following tasks have been identified:
-
Provide suggestions on how to compose the PC, by identifying uncovered research areas and removing actors who did a poor job in reviewing papers.
-
Identify bottlenecks that could cause delays in the review process, as well as possible workarounds.
-
Identify under which conditions constraints in the process (e.g., a paper is reviewed by at least 4 reviewers, 2 of which are experts in the topic covered by the paper) are violated.
-
Ensure that the conference aligns with the goals set by the publisher (e.g., that the acceptance rate is not higher than 30%).
4.5.3 Technical Challenges in Process Ecosystem Analysis
-
Multiplicity of perspectives: Unlike analysis involving a single stakeholder or a particular part of a process, process ecosystems involve processes representing multiple perspectives within a complex system. Analyzing these multiple perspectives require creating multiple representations that enable switching from one perspective to the other seamlessly and with methods allowing cross-perspective analysis.
-
Inter-process interactions: An inherent challenge with multiple processes in process ecosystems is the diverse range of interactions that can take place within the processes. For instance, processes can be interdependent on one another, could be competing for shared resources or processes can be sub-parts of larger processes. These range of relations require an analyst or a designer to devise bespoke computations or visualizations that can handle a large range of complex relations between processes.
-
Temporal constraints: Temporal constraints and rules do already require special attention within analysis involving a single process. With multiple processes interacting in diverse ways, the effort to oversee temporal constraints is exacerbated. Analysts require multi-faceted but temporally-aligned representations to be able to concurrently analyze multiple interacting processes.
-
Data heterogeneity and quality issues: With several processes that needs to be interlinked and analyzed concurrently, the data that captures these process will be diverse and be available in incompatible formats, requiring extensive effort in data processing. With data being captured in multiple levels, the probability of data errors and gaps occurring is also higher.
-
Dynamic evolution: One inherent character of complex inter-related systems is their continuous evolution. This could mean that dependencies across entities could change, new dependencies could emerge and resource needs and pathways of processes could alter. This requires dynamic representations that enables the monitoring and analysis of evolving systems.
Limitations of Current Process Mining Solutions
Despite the growing maturity of process mining (PM) tools and techniques, significant limitations remain when it comes to analyzing systems composed of multiple interacting processes. In particular, existing PM solutions struggle to provide a comprehensive and time-aware understanding of how such systems evolve.
A key challenge lies in capturing and representing the temporal development of multiple processes and their interactions. Real-world process ecosystems, such as those seen in collaborative workflows, healthcare, logistics, or scientific conference management, involve numerous interdependent processes that run in parallel and influence one another over time. Understanding when and how these interactions occur is essential for diagnosing inefficiencies, anticipating problems, and identifying opportunities for intervention. However, most process mining visualizations are optimized for analyzing single processes in isolation and often focus on control-flow abstractions such as process models or variants.
When time is represented at all, current PM tools typically offer limited support for temporal overview or for tracing the evolution of interactions (other than, e.g., examining the differences between process models such as presented in Figure 28). Temporal data may be aggregated, reduced to average durations, or visualized in Gantt-like charts with limited interactivity and low scalability. This makes it difficult to analyze the unfolding of interactions, to understand the synchrony or asynchrony of processes, or to spot coordination problems that arise due to delays, resource contention, or structural dependencies.
This is where visual analytics (VA) can serve as a powerful complement to traditional PM. Visual analytics provides a rich toolkit for representing and analyzing time-oriented data, enabling interactive exploration of temporal patterns, event sequences, and process trajectories. Techniques such as storyline visualizations, Marey charts, and temporal networks can offer more nuanced perspectives on how multiple processes evolve and influence one another over time. Moreover, VA supports multi-scale and multi-faceted analysis, helping users to shift between overviews and detail, filter and compare temporal patterns, and incorporate contextual or domain-specific knowledge into the analysis.
By integrating temporal visual analytics into process mining, we can advance toward a more holistic understanding of process ecosystems – one that not only captures what processes occur, but also when, how, and in relation to what others.
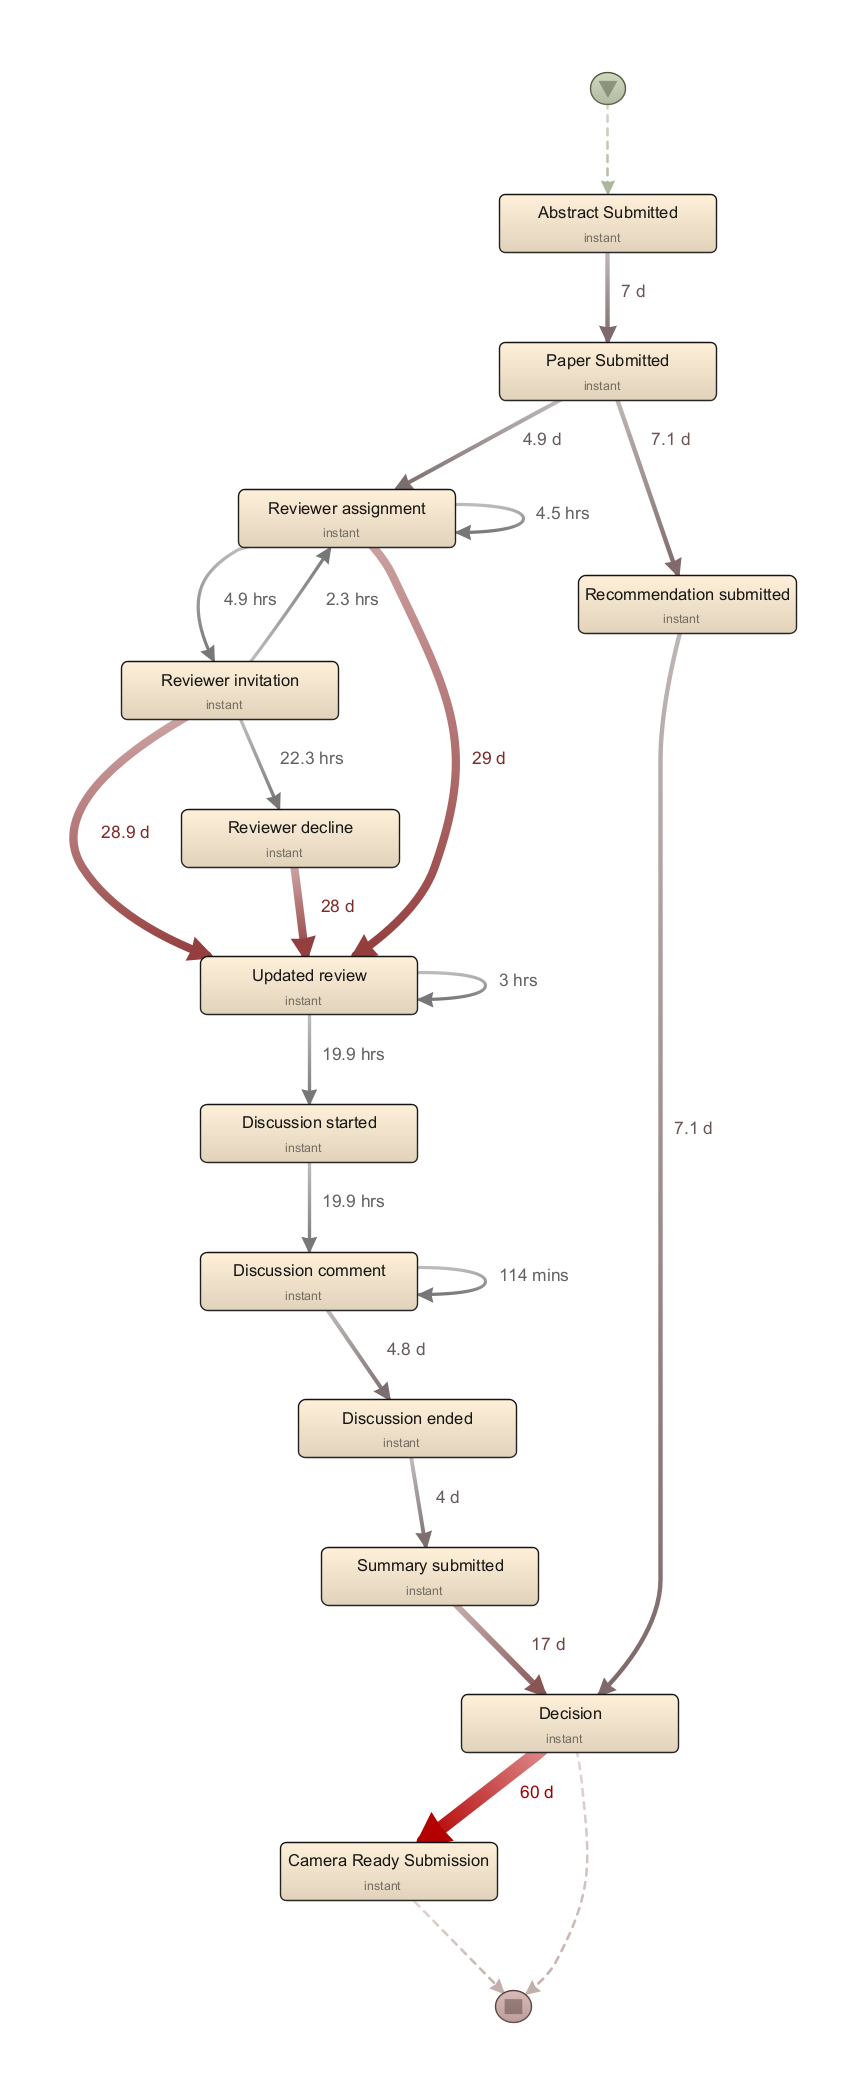


4.5.4 Vision
Effective monitoring and analysis of process ecosystems requires a combination of techniques that can extract structured knowledge from event data and support interactive, human-centered exploration. Process Mining (PM) and Visual Analytics (VA) offer complementary strengths that, when combined, enable a powerful approach to understanding such complex systems.
-
Linking Process Discovery with Interactive Exploration: PM excels at deriving structured process models from event data, revealing control-flow patterns and performance metrics. VA complements this by enabling users to interactively explore these models and the underlying data, focusing on aspects most relevant to their questions.
-
Integrating Temporal Representations and Analysis: PM tools provide time-based metrics and can segment process stages temporally. VA enriches this with expressive visual metaphors, such as timelines, storylines, Marey charts, or dynamic graphs, that allow users to perceive the progression, synchronicity, and timing of multiple processes in context.
-
Revealing Inter-Process Interactions: While PM can identify shared activities or resources, VA supports the visualization of dependencies, influences, and synchronizations across process instances. This helps users reason about how processes interact, support, compete with, or block each other.
-
Supporting Multi-Actor and Multi-Perspective Analysis: In process ecosystems involving many stakeholders (e.g., coordinators, reviewers, chairs), PM can identify roles and responsibilities. VA allows for flexible filtering and perspective switching, helping stakeholders understand the system from their own or others’ viewpoints.
-
Facilitating Monitoring and Timely Intervention: The combination enables the construction of rich monitoring dashboards where PM provides the structured event flow and derived KPIs, while VA supports intuitive visual layouts and alerts that guide attention to issues such as delays, coordination problems, or resource bottlenecks (see Figure 29).
-
Managing Complexity and Enhancing Interpretability: PM’s algorithmic capabilities scale to large datasets, and VA provides ways to abstract, aggregate, and interactively refine views, allowing users to navigate complexity without losing important details.
-
Enabling Retrospective Learning and Knowledge Externalization: PM can identify patterns of behavior over historical data, and VA supports sensemaking and storytelling helping analysts communicate findings, compare scenarios, and build shared understanding of systemic dynamics.
4.5.5 Conclusion and Future Work
In this work, we highlighted the need to move beyond traditional, isolated views of processes and embrace the concept of process ecosystems – systems of multiple interrelated and interacting processes evolving in parallel. We argued that understanding such ecosystems requires not only the discovery of individual process models but also tools for monitoring, visualizing, and analyzing their temporal development, mutual dependencies, and interactions.
We discussed how the synergy between Process Mining (PM) and Visual Analytics (VA) can address this need. PM offers robust methods for discovering and quantifying processes based on event data, while VA brings in powerful techniques for time-oriented representation, interactive exploration, and multiscale analysis. Time-based visualizations, coordinated multiple views, and interaction techniques such as brushing, filtering, and dynamic level-of-detail provide essential support for making complex process interrelations observable and interpretable.
Using the example of scientific conference organization, we illustrated a process ecosystem and discussed some key goals an visual process analysis approach could support. We also pointed to scalability challenges and the importance of grouping and abstracting processes using clustering based on task-specific similarity metrics.
Future research directions include:
-
Developing scalable visual representations that combine aggregate views with detailed process trajectories.
-
Designing similarity measures and clustering techniques tailored to different types of process interactions (e.g., synchronization, resource sharing, interference).
-
Supporting dynamic grouping and focus+context views to enable exploration of evolving sub-ecosystems.
-
Integrating causal inference techniques to understand not only correlations but also influence among processes.
-
Creating domain-specific dashboards that bring together PM and VA components to support monitoring and decision making in real-time.
-
Conducting empirical studies with domain experts to evaluate usability and effectiveness of the proposed approaches.
By advancing in these directions, we can build more intelligent and adaptive tools for managing complex systems of interacting processes across domains such as healthcare, logistics, manufacturing, and scientific workflows.
References
- [1] Daniel Beverungen, Joos C. A. M. Buijs, Jörg Becker, Claudio Di Ciccio, Wil M.P. van der Aalst, Christian Bartelheimer, Jan vom Brocke, Marco Comuzzi, Karsten Kraume, Henrik Leopold, Martin Matzner, Jan Mendling, Nadine Ogonek, Till Post, Manuel Resinas, Kate Revoredo, Adela del Río-Ortega, Marcello La Rosa, Flávia Maria Santoro, Andreas Solti, Minseok Song, Armin Stein, Matthias Stierle, and Verena Wolf. Seven paradoxes of business process management in a hyper-connected world. Business & Information Systems Engineering, 63(2):145–156, 2021.
- [2] Marlon Dumas, Marcello La Rosa, Jan Mendling, and Hajo A. Reijers. Fundamentals of Business Process Management, Second Edition. Springer, 2018.
- [3] Dirk Fahland. Process mining over multiple behavioral dimensions with event knowledge graphs. In Process Mining Handbook, pages 274–319. Springer, 2022.
- [4] Marc M. Lankhorst, editor. Enterprise Architecture at Work – Modelling, Communication and Analysis, Fourth Edition. Springer, 2017.
- [5] Wil M. P. van der Aalst. Object-centric process mining: Dealing with divergence and convergence in event data. In Peter Csaba Ölveczky and Gwen Salaün, editors, Software Engineering and Formal Methods – 17th International Conference, SEFM 2019, Oslo, Norway, September 18-20, 2019, Proceedings, volume 11724 of Lecture Notes in Computer Science, pages 3–25. Springer, 2019.
5 Participants
-
Wolfgang Aigner – FH – St. Pölten, AT
-
Gennady Andrienko – Fraunhofer IAIS – Sankt Augustin, DE
-
Natalia V. Andrienko – Fraunhofer IAIS – Sankt Augustin, DE
-
Iris Beerepoot – Utrecht University, NL
-
Andrea Burattin – Technical University of Denmark – Lyngby, DK
-
Lena Cibulski – Universität Rostock, DE
-
Claudio Di Ciccio – Utrecht University, NL
-
Irit Hadar – University of Haifa, IL
-
Marie-Christin Häge – Universität Mannheim, DE
-
Andreas Kerren – Linköping University, SE
-
Philipp Koytek – Celonis Labs GmbH – München, DE
-
Zhicheng Liu – University of Maryland – College Park, US
-
Giovanni Meroni – Technical University of Denmark – Lyngby, DK
-
Silvia Miksch – TU Wien, AT
-
Manuel Resinas – University of Sevilla, ES
-
Shazia Sadiq – University of Queensland – Brisbane, AU
-
Hans-Jörg Schulz – Aarhus University, DK
-
Pnina Soffer – University of Haifa, IL
-
Christian Tominski – Universität Rostock, DE
-
Cagatay Turkay – University of Warwick – Coventry, GB
-
Stef Van den Elzen – TU Eindhoven, NL
-
Maria-Cruz Villa-Uriol – University of Sheffield, GB
-
Tatiana von Landesberger – Universität Köln, DE
-
Katerina Vrotsou – Linköping University, SE
-
Barbara Weber – Universität St. Gallen, CH
-
Peilin Yu – Linköping University, SE
-
Francesca Zerbato – TU Eindhoven, NL
![[Uncaptioned image]](x3.jpg)