NEOntometrics – A Public Endpoint for Calculating Ontology Metrics

Abstract
Ontologies are the cornerstone of the semantic web and knowledge graphs. They are available from various sources, come in many shapes and sizes, and differ widely in attributes like expressivity, degree of interconnection, or the number of individuals. As sharing knowledge and meaning across human and computational actors emphasizes the reuse of existing ontologies, how can we select the ontology that best fits the individual use case? How do we compare two ontologies or assess their different versions? Automatically calculated ontology metrics offer a starting point for an objective assessment. In the past years, a multitude of metrics have been proposed. However, metric implementations and validations for real-world data are scarce. For most of these proposed metrics, no software for their calculation is available (anymore). This work aims at solving this implementation gap. We present the emerging resource NEOntometrics, an open-source, flexible metric endpoint that offers (1.) an explorative help page that assists in understanding and selecting ontology metrics, (2.) a public metric calculation service that allows assessing ontologies from online resources, including GIT-based repositories for calculating evolutional data, with (3.) a scalable and adaptable architecture. In this paper, we first evaluate the state of the art, then show the software and its underlying architecture, followed by an evaluation. NEOntometrics is today the most extensive software for calculating ontology metrics.
Keywords and phrases:
Ontology Metrics, Ontology Quality, Knowledge Graph Semantic Web, OWL, RDFCategory:
Resource PaperCopyright and License:
2012 ACM Subject Classification:
Computing methodologies Ontology engineering ; Information systems Web Ontology Language (OWL) ; General and reference Metrics ; General and reference EvaluationSupplementary Material:
The source code for NEOntometrics is published on Github under the MIT license, where version 1.1.0 was used for the performance results presented in Section 5.3. The evaluations are available on Zenodo under a CC-BY license.archived at
DOI:
10.4230/TGDK.2.2.2Received:
2023-12-01Accepted:
2024-10-31Published:
2024-12-18Part Of:
TGDK, Volume 2, Issue 2 (Resources for Graph Data and Knowledge)Journal and Publisher:
1 Introduction
Ontologies facilitate the shared understanding of a domain between people and systems [15]. They allow the structuring and contextualizing of data for detecting implicit knowledge, accessing this knowledge using complex queries, and integrating and interlinking data from various sources while facilitating a common understanding.
Over time, the semantic web community developed numerous ontologies. To give a perspective, the vocabulary repository “Linked Open Vocabulary (LOV)” [33] contains 860 ontologies. The portal “ontologydesignpatterns.org” collects small, reusable ontology patterns and provides 240 artifacts. Bioportal [34], a large repository for biomedical ontologies, contains 1,140 ontologies. Moreover, many more ontologies are available on different sources like GitHub or private company repositories111Accessed July 2024.
While the number of developed ontologies is extensive, just a few means are available to assess these artifacts quantitatively. For the development team that likes to integrate an ontology into their system, it is cumbersome to numerically compare the main attributes of two or more available ontologies that serve the same purpose. For the knowledge engineer, the missing assessment capabilities hinder tracking how ontology structure evolves throughout the ontology lifetime.
As shown in the next section, the lack of means for numerical assessments does not originate from a lack of proposed metrics - over time, various metric frameworks have been developed. What is missing are practical implementations of these metrics. Without a means to put these metrics into use, further empirical research cannot proceed, and the potential of ontology metrics remains theoretical.
This work aims to close this gap by presenting a flexible, extensible metric calculation endpoint for RDFS and OWL-based ontologies. The software enables metrics to be calculated and retrieved using a graphical user interface (GUI) or an application programming interface (API). It further aids users in learning about different metrics, their calculations, and possible interpretations through an interactive explorer for ontology metrics. If several versions of an ontology are available in a GIT-based repository, the development of the metric values over time can be tracked.
NEOntometrics is the successor of the Ontometrics software [11] and its API endpoint [26]. The new software allows for evolutional analysis, comes with visualization capabilities, calculates more metrics with improved calculation performance, and is better extensible. Parts of the NEOntometrics application have been previously published. We presented a poster of an earlier version of NEOntometrics at the Semantics Conference 2022 [25]. The metric ontology was presented at the KEOD conference 2022 [26], and the visualization capabilities at the Voilá Workshop 2023 [29]. This contribution combines the various works and extends them with (A.) a more thorough review of the state of the art, (B.) a more detailed description of the software’s capabilities and structure, and (C.) an evaluation of the practical relevance and the performance gains of the calculation engine.
The paper is structured as follows: Section two summarizes the current state-of-the-art regarding ontology metrics and calculation software. Section three presents NEOntometrics with its architecture and usage of the API and GUI. In section four, we illustrate the use of NEOntometrics by presenting a case study and means to adapt the software, followed by the evaluation of the framework and a conclusion.
2 Related Work
Significant for our research are metric calculation proposals and ontology metric frameworks, covered in the first part of this section, and possible calculation implementations, covered in the second part.
There are many different evaluation methods available. Please note that we only consider criteria-based frameworks that allow for an automatic evaluation based on the structural attributes of the ontology. Metrics that need human intervention or additional input parameters are not considered relevant. That excludes evaluation methods based on a gold standard (additional input parameter is a “perfect” ontology), task-based (additional input parameter is the task fulfillment level that an ontology can provide in a given context), or corpus-based (additional input parameters are domain-related documents like a text corpus). Raad and Cruz further describe the underlying categorization [20].
2.1 Related Quality Frameworks
Lozano-Tello and Gómez-Pérez published the Ontometric framework in 2004. It proposes evaluation attributes in five criteria: (Development) tool, (ontology) language, context, methodology, and cost. Arguably, some metrics have become obsolete due to standardization in the past years. In 2004, the web ontology language (OWL) was just released, and other representations like OIL, DAML+OIL, and SHOE were still actively used. Here, Ontometric is targeted to make the influences of the languages explicit and comparable [13]. Today though, regarding the category languages, RDFS-based ontologies can be considered state-of-the-art and are mostly compatible with each other. Further, the standardization decoupled the tools from the ontology. Thus, the tool capabilities do not influence the semantic artifact. Other proposed elements, however, can be supported by an automatic calculation, like the metric maximum depth in the category content. While the relevance today might be somewhat limited, Ontometric considerably influenced the newer frameworks.
Gangemi et al. proposed an ontology evaluation framework based on a semiotic meta-ontology O² that provides a formal definition for ontologies and their usage. Further, the authors define an ontology evaluation design pattern (oQual). Based on their O² definition, measurements assessing structural, task, corpus, and usability-based attributes are proposed [8]. A technical report by the same authors further suggested 32 metrics in seven categories assessing mostly graph-related structures like depth, width, modularity, the distribution of siblings, or tangledness [9].
In 2005, Burton-Jones et al. presented the semiotic metric suite. It comprises four main categories (syntactic, semantic, pragmatic, and social quality) and ten quality metrics. While some of these metrics are based solely on the structure of the ontology itself, others need further additional external information. Nine of these measurements, in theory, can be calculated automatically [2]. Practically, some of the required data for some measures will probably not be available. Examples are the access count of the ontology or the links from other ontologies to the currently assessed one.
OQuaRE was first proposed in 2011 by Duque-Ramos et al. It has since been used in several publications, always involving the core team of the proposing authors. OQuaRE offers 19 calculatable metrics and associates these metrics with quality dimensions like readability or accountability. Further, the framework ties metric results to quality ratings, thus providing an interpretation of the measurements. This holistic approach to quality is a unique characteristic among the frameworks [6]. However, during implementation, we experienced several heterogeneities in the metric definitions of the framework, with metrics having the same name, created by the same authors, being defined differently in their publications. To facilitate further research on the framework and to integrate the framework into NEOntometrics, we reworked the OQuaRE measurements. However, empirical research with the newly implemented metrics showed that their proposed linkages from measures to ontology quality scores do not sufficiently work [27]. Our study was the first made by authors not part of the team that proposed the framework; however, the NEOntometrics applications shall allow more thorough analysis in the future.
| Framework | [13] | [8] | [2] | [6] | [32] | [35] | [14] |
|---|---|---|---|---|---|---|---|
| Published | 2004 | 2006 | 2005 | 2011 | 2007 | 2005 | 2010 |
| # Citations | 424 | 356 | 370 | 115 | 356 | 180 | 52 |
Tartir et al. published 19 metrics in the OntoQA framework in 2005 and 2007. While the framework does not provide a grading system for metrics like OQuaRE, it aids the interpretation by describing how modeling decisions influence the metric results. Further, the authors propose measurements applicable not to the ontology as a whole but to the elements in an ontology. OntoQA also defines class- and relation-specific measurements. The relationship importance, for example, is calculated once for each relationship [32, 31].
There are further metric frameworks that consider the cohesion of an ontology. Yao et al. propose a set of measures based on an inheritance tree [35]. In a consecutive paper, the authors further provide an empirical analysis and interpretation context [17]. Ma et al. examined the ontology partitions with special consideration of the open world assumption [14].
Over the years, a lot of frameworks have been proposed. As Table 1 shows, these papers have gathered many citations over the years. Some of these frameworks are merely theoretical in their proposals; others came with prototypical implementations. Further, tools that do not correspond to one of the proposed frameworks have been developed.
2.2 Related Metric Calculation Software
The following section shows historical and current software for ontology metric calculation.
OntoKBEval by Lu and Haarslev [19] analyzes the structure of ontologies by providing graph-related measures like the number of levels or the number of concepts per level. The tool offers means to grasp clusters in the ontology and developed its own visualization “Xmas”-tree.
Tartir et al. developed a standalone java application for the OntoQA framework [32], implementing measures of the OntoQA framework, including metrics for the individual classes.
OntoCat, proposed by Cross and Pal [3], is a plugin for the Protégé editor and provides size- and structure-related metrics. They allow the assessment of the ontology as a whole but also provide metrics concerned with specific subsets of the given ontology.
S-OntoEval by Dividino et al. [4] serves as a calculation tool for, among others, the framework of Gangemi et al. Its primary focus is on structural evaluation. However, the tool also calculates usability based on annotations and task performance based on ontology querying.
The Protégé editor [16] offers basic metrics on its landing page that counts the usage of OWL-specific language constructs like the number of object property domain declarations or the number of classes.
The developers of the OQuaRE framework introduced a web tool to calculate their proposed metrics. It integrates a statistical correlation analysis of the metrics and a web service. The tool suffers from the same issues as the framework [27], and the implemented metrics are heterogeneous and do not adhere to a clear definition.
Amith et al. developed the Semiotic-based Evaluation Management System (SEMS), later renamed OntoKeeper [1], which implements the semiotic suite by Burton-Jones et al.
The “OntOlogy Pitfall Scanner” (OOPS) by Poveda-Villalón et al. [18] approaches automatic ontology evaluation differently: They detect common modeling pitfalls like the use of is relationship instead of rdfs:subClassOf or wrongful equivalent relations.
2.3 The Need for Another Calculation Tool
As the previous section has shown, many frameworks and tools have been developed over the past years. That raises the question of whether a new calculation tool is necessary. We argue that our application fills essential gaps:
- Missing Practicality.
-
As Table 2 shows, most of the developed tools are no longer available. Even if they are available, their usability is often low. Many of the tools were used for the authors’ evaluation efforts and do not come with a state-of-the-art user interface. Further, most of the software is not maintained. This problem is amplified by the fact that most of the software is:
- Closed Source.
-
None of the evaluated tools is fully open source (cf. Table 2). Not only hinders this reproducibility. It also prevents the community from maintaining the software and building on this previous research. If there is a need for another kind of evaluation, one has to start from scratch. We, thus, argue that the closed source leads to:
Table 2: The availability of the developed metric software (type: S: Standalone, P+: Protégé plugin, API: REST-API, WT: Web Tool). Tool Date Type Available Open Source Ref Onto-KBEval 2006 S No No [19] OntoQA 2005 S Yes (No)222https://github.com/Samir-Tartir/OntoQA.Thebinary.jarfilesareavailableunderCClicense.Thesourcecodeitselfisnotpublic. [32] OntoCat 2006 P+ No No [3] S-Onto-Eval 2008 S No No [4] Protégé 2015 S Yes Yes [16] OQuaRE 2018 WT, API Yes333http://sele.inf.um.es/ontology-metrics No [27] Onto-Keeper 2017 WT No No [1] OOPS 2012 WT, API Yes444http://oops.linkeddata.es No [18] OntoMetrics 2015 WT, API Yes555https://ontometrics.informatik.uni-rostock.de,opi.informatik.uni-rostock.de No [22, 11] - Isolation.
-
The implementation efforts have stayed mainly isolated from one another. Hardly any tool has reached a broad acceptance within the community, and the ontology evaluation efforts of researchers using different tools are often not comparable. While there is a consensus that ontology evaluation is meaningful, there is no common understanding of how to do it.
3 NEOntometrics
NEOntometrics is the successor of the Ontometrics tool [22, 11] (thus NEOntometrics). The old Ontometrics is one of the few ontology evaluation tools still available, but it does not scale well, provides fewer functionalities, sometimes redundant calculations, and is complicated to adapt [26].
The new tool, NEOntometrics, is a complete overhaul of the old software. It consumes public GIT-based repositories, iterates through all of the commits (a commit is a published change in a repository), and calculates the metrics of the available ontology files. The software seeks to solve many of the previously named challenges. It comes with a state-of-the-art user experience, a GraphQL endpoint, calculates various metrics, is quickly extensible through an ontology for creating and describing metrics, and is open source under the MIT License666https://github.com/achiminator/NEOntometrics. Table 3 further shows the application differences.
| NEOntometrics | OntoMetrics/OPI | |
| GUI | Flutter / Material Design | OntoMetrics: Static Web Page |
| API | GraphQL | OPI: REST |
| Technology | Microservices | Java Webpage |
| Evolutional Analysis | Public Git Repositories | No |
| Async | Yes | No |
| Metrics | 159 | 72777As some frameworks propose similar measurements, not all of the metrics are unique. |
| Extensibility | Good | Poor |
| Open Source | Yes | No |
| Performance | Fast (cf. Section 5.3) | Moderate |
The following section details the software itself: It presents the different components of the service, how they interact, and the underlying development decisions. We also present how our ontology-based metric calculations are extensible for future usage. Afterward, we give an overview of how to put the software to use.
3.1 The Architecture of the Metric Calculation
One design goal was to create a flexible application for integrating new metrics. A researcher shall be able to adapt the application to their needs and quickly implement new required metrics.
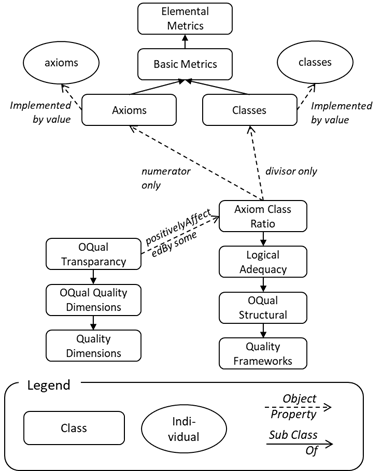
To achieve this adaptability, we did not encode all of the metrics of the various frameworks directly in the software but decomposed them into their building blocks. For example, the metric Axiom/Class Ratio is not calculated during the ontology analysis. Instead, their building blocks Axioms and Classes are analyzed and saved in the database. The compositional values are then calculated at the time of querying.
The information on the ontology metrics is stored in an OWL-based metric ontology131313https://raw.githubusercontent.com/achiminator/NEOntometrics/master/Git-Extension/rest/metricOntology/OntologyMetrics.owl. On startup of the application, multiple SPARQL-queries extract the codified knowledge and set up the backend and frontend. Thus, changing and adapting the ontology is sufficient to adapt the measures. The work [26] further details the underlying metric ontology.
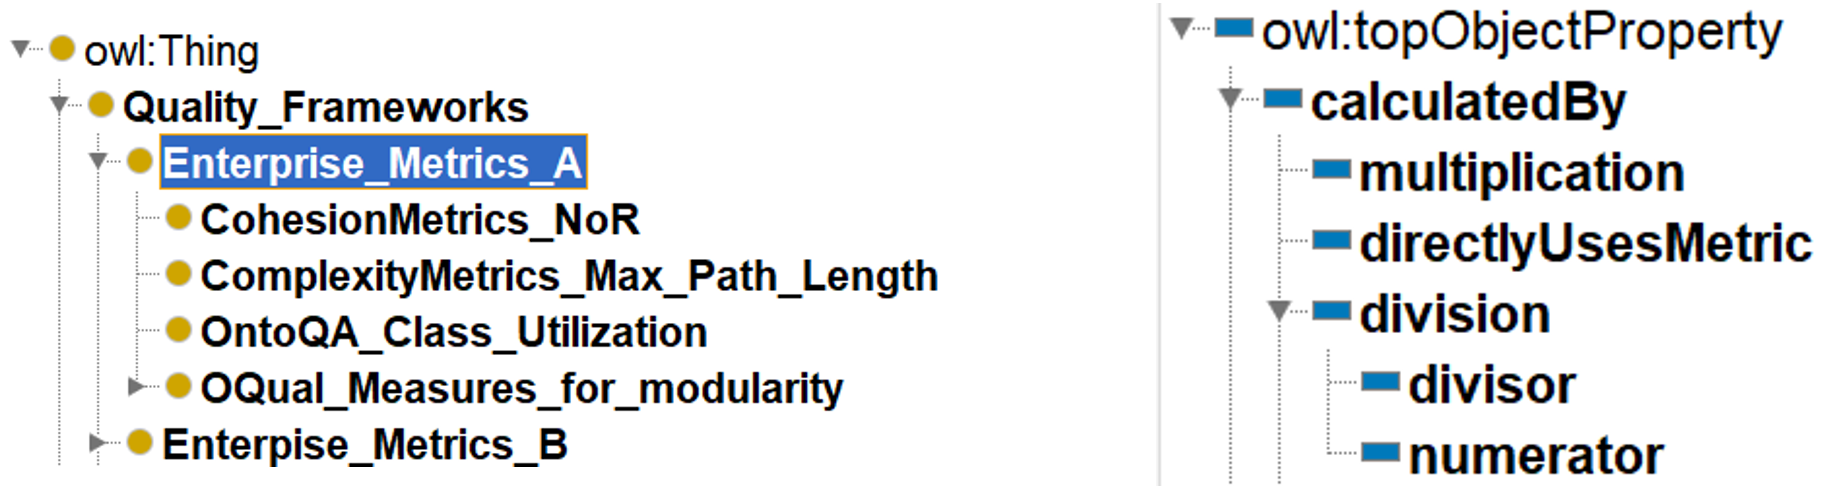
Figure 1 presents an example of the metric elements in the ontology. Elemental Metrics contain the atomic measures that are used to build the compositions. For Axiom Class Ratio, the Elemental Metrics are Axioms (the number of axioms) and Classes (the number of classes). The ontology further specifies mathematical relationships between the metrics. In the given example, Axiom Class Ratio is the subClassOf (divisor only Classes) and (numerator only Axioms). The Elemental Metrics are connected to metric instances named identically to the implementation names in the calculation service and the elements in the database. In the example of the Axioms, this element has a relationship implementedBy value axioms.
All elements have rich annotations, providing human-centered meaning to the metrics. Some elements have links to further online resources or scientific publications. The annotations are the foundation for the Metric Explorer, where users find guidance on the available metrics.
New metrics that build upon the available Elemental Metrics can be created by modeling them in the ontology. Upon start, the application will make these custom metrics automatically available in the front- and backend. Table 4 shows the frameworks that are already implemented in NEOntometrics and part of the Metric Explorer and the Calculation Unit at the time of publication. The case study in Section 4.2 details how to create new frameworks, e.g., for individual metric frameworks in an organization.
| Name in NEOntometrics | Proposed By | Ref |
|---|---|---|
| Cohesion Metrics | Yao et. al | [35] |
| Complexity Metrics | Zhang, Ye, Yang | [37] |
| Good Ontology | Fernandez et. al | [7] |
| OQuaRE | Duque-Ramot et. al | [6, 27] |
| OQual | Gangemi et al. | [9, 8] |
| OntoQA | Tartir, Apinar | [32, 31] |
| Complexity Cohesion | Orme, Yao, Etzkorn | [17] |
3.2 The Architecture Of The Application
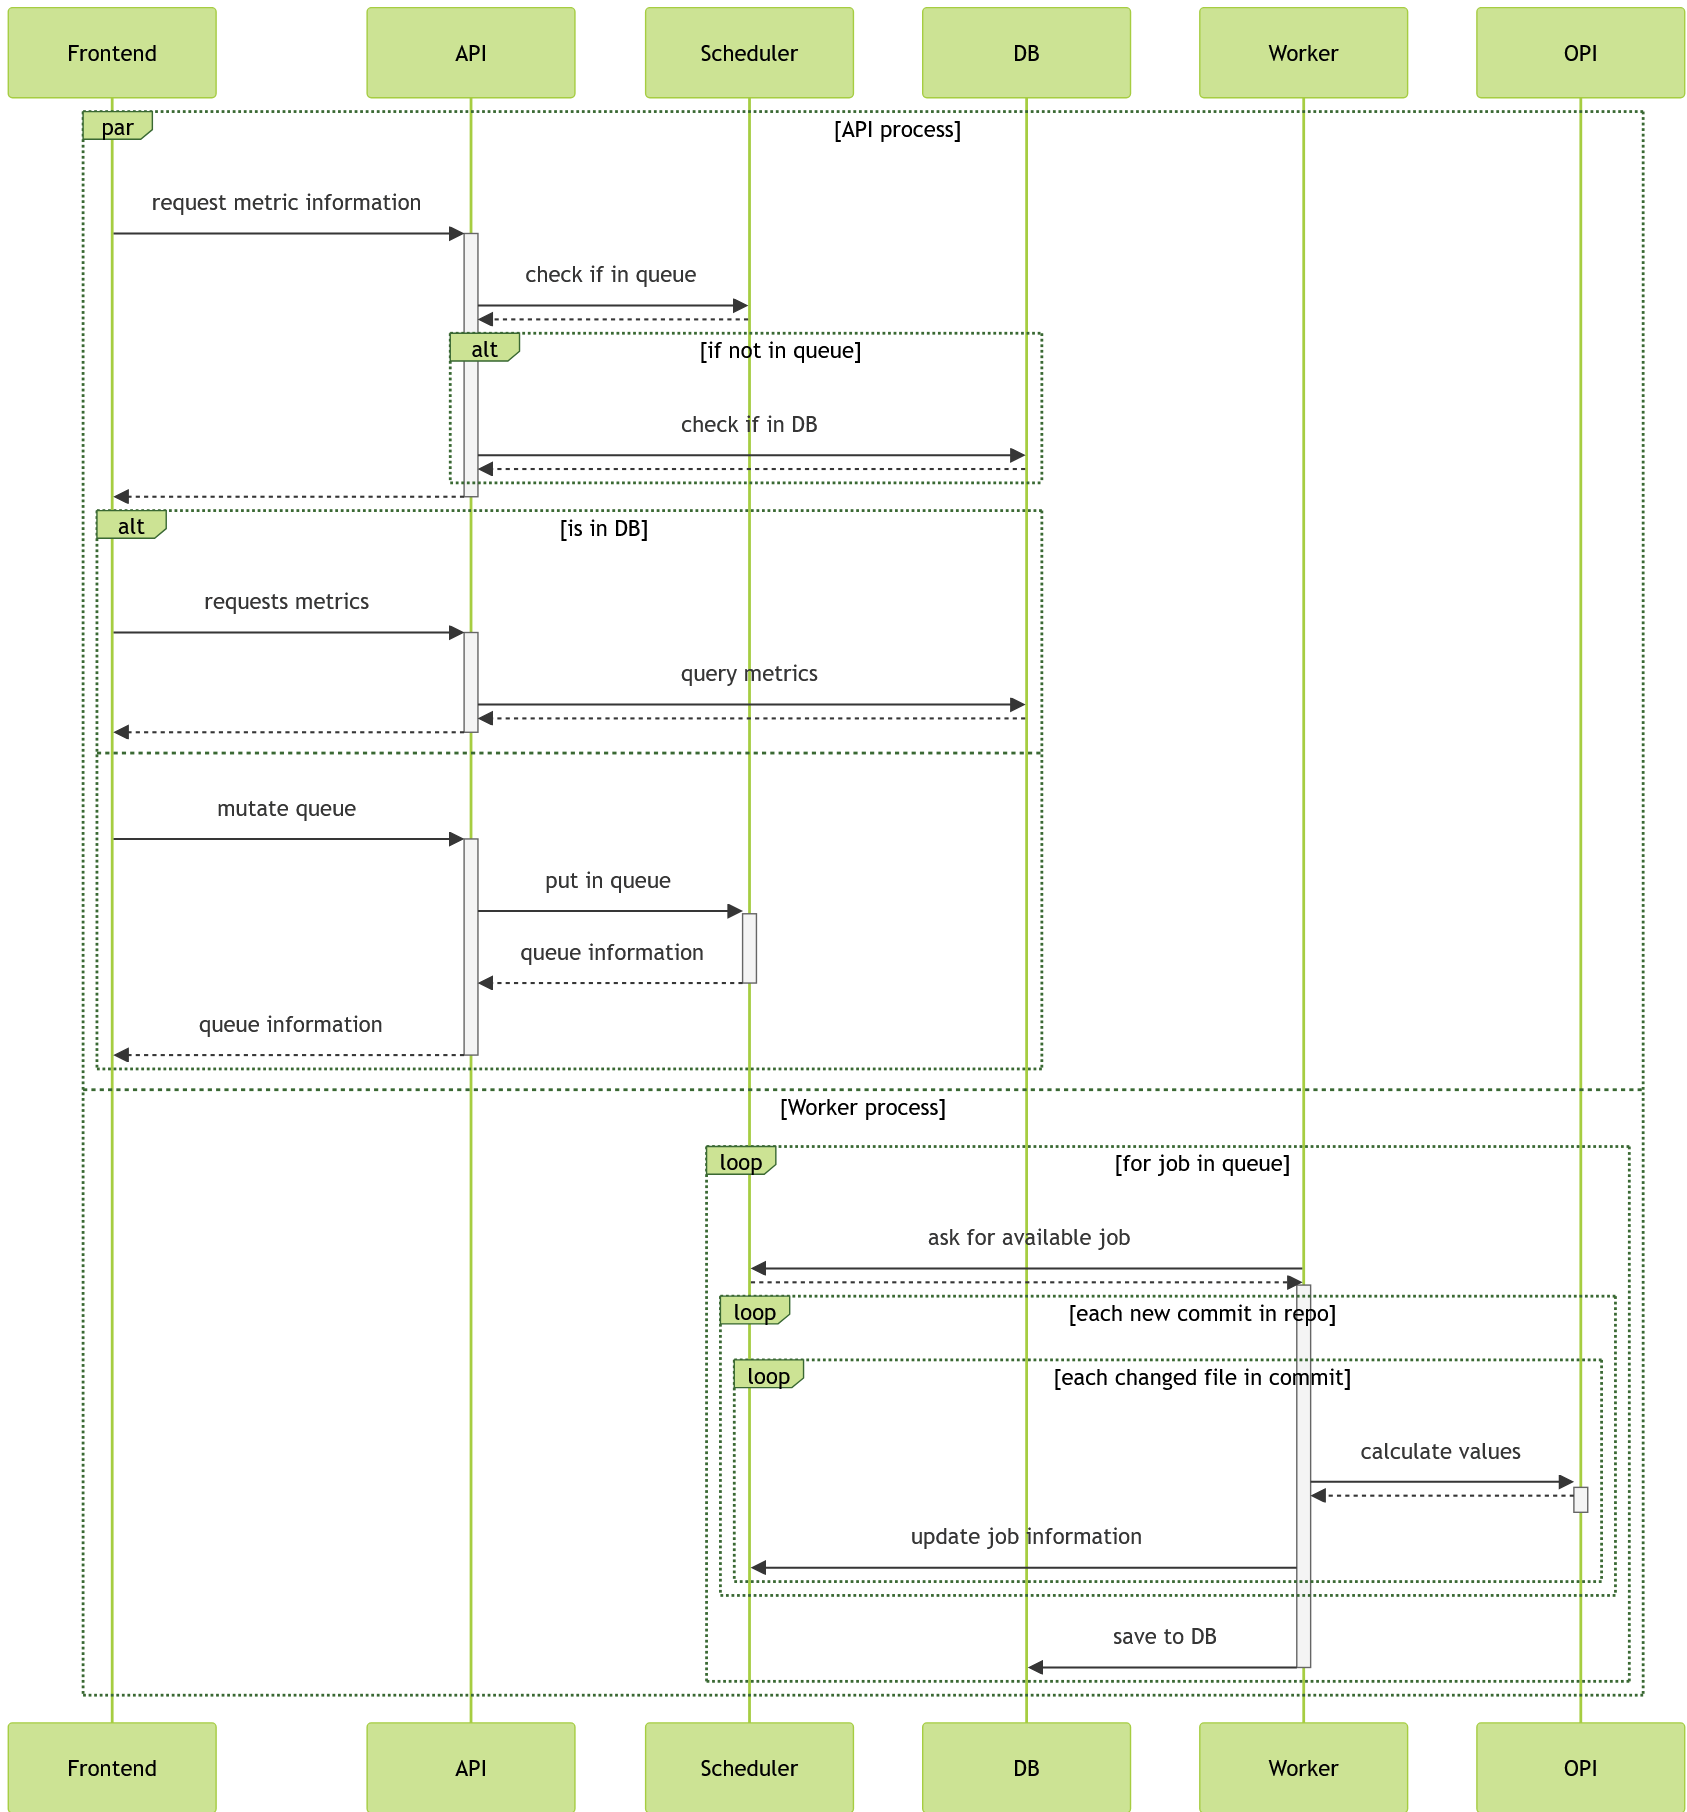
The application is based on a dockerized microservice architecture and consists of five components: the calculation-unit OPI (Ontology Programming Interface), the API, the worker application, a database for storing the calculated metrics, and a Redis interface for queueing jobs. The API and worker share a common codebase. Figure 3 depicts the interaction of the involved services.
The frontend contains the GUI. It is written using the multi-platform UI language flutter with its underlying client language dart888https://flutter.dev/, https://dart.dev/. Upon loading, the frontend first queries the API for available ontology metrics based on the metric ontology. This data fills the help section Metric Explorer, which allows users to inform themselves about the various available metrics and the options for the calculation page. Afterward, the user can retrieve the requested ontology metrics or put them into the queue if they do not yet exist.
The API is the django-based999https://www.djangoproject.com/, https://www.django-rest-framework.org/ endpoint for accessing already calculated metric data or requesting the analysis of new repositories. During the startup of the software, the application queries the metric ontology. It builds the frontend data and dynamically creates calculation code to provide the measurements of the frameworks that build upon the Elemental Metrics. After startup, a client can exploit GraphQL to check whether the data he requests exists already in the database. If so, he is able to retrieve all the selected metrics for a given repository. If not, it is possible to put the calculation of a given repository in the queue and track its progress.
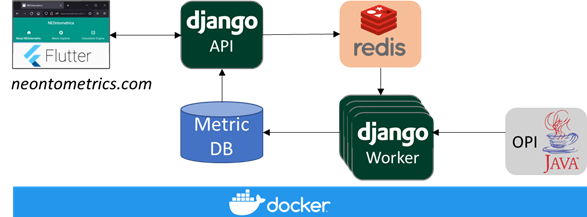
The worker is responsible for the calculation of the metrics itself. It checks whether jobs are available in the scheduler Redis database. If that is the case, it starts the analysis by first cloning or pulling the GIT-repository, then iterating through every new file and commit, analyzing the ontologies using the OPI metrics endpoint. Afterward, the calculation results are stored in the database. The scheduling mechanism is based on django-rq101010https://python-rq.org/patterns/django/. Even though the worker shares a code base with the API, it runs as a separate application. The number of parallel calculations can be scaled by increasing the number of workers.
The calculation service OPI is responsible for calculating metrics out of ontology documents. While it is based on the calculation service published in [22], most underlying code has been replaced. The old application struggled with ontology files larger than 10 MB due to inefficient memory allocation and had no separation of the calculation of the elemental metrics and the composed metrics of the metric frameworks. The old application was designed as standalone software, while the new calculation engine is hidden from the user and only accessed by the API.
The backend utilizes two languages: The API is written in python, and the calculation service OPI builds on Java. While the two languages add complexity to the application design, they allow the use of established frameworks for their given tasks.
The calculation and retrieval process as a whole is depicted in Figure 2. At first, the frontend requests whether an ontology is already known in the system. If not, it either returns the queue information to the end-user or starts another request for the ontology metrics. At the same time, the worker applications and OPI handle the queued tasks.
The microservice architecture allows utilizing the strengths of the various languages. The Java calculation unit builds on the OWL-API for an efficient graph traversal. The Python/django application is easily extensible through the availability of multiple plugins, e.g., for the GraphQL endpoint and the asynchronous metric calculation. The flutter-based frontend comes with built-in material design support. Further, the microservices allow for potential horizontal scaling of the calculation.
3.3 The Metric Explorer
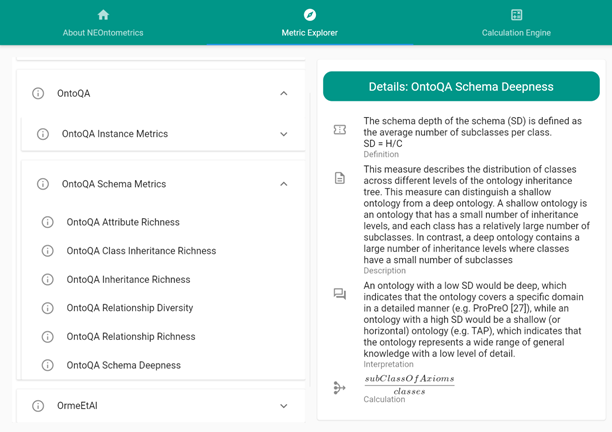
The page Metric Explorer is a dynamic help page of available metrics in NEOntometrics. The two main categories are Elemental Metrics and Quality Frameworks. The former contains the underlying atomic measurements of the ontologies. The authors of NEOntometrics create all the information shown in this category. Quality Frameworks, on the other hand, present the ontology metrics developed by other researchers, like the OntoQA Metrics [32] by Tartir et al., shown in Section 2.1. Here, all information originates from the authors of the given frameworks.
The Metric Explorer provides information on five categories (though not all are filled for all the metrics). Metric Definition contains the formal definition of the metrics and how they are calculated, while Metric Description supplements a more human-readable explanation and, at times, an example. The Metric Interpretation guides practical usage. Calculation explains their decomposition into the Elemental Metrics using the metric names that are returned by the API, and seeAlso links to further resources like the corresponding papers or additional reads.
The interactive help page is closely bound to the metric ontology. Every change will be reflected in the Metric Explorer after a restart, and the ontology provides annotation properties for the metric definitions, descriptions, and interpretations. The nesting of the measurements is defined by the subclass relations in the ontology, and the calculation field is defined by the object properties representing the mathematical relationships (cf. Figure 1).
3.4 A Frontend for Humans and an Interface for Machines
For direct consumption by a user, the tab Calculation Engine (as shown in Figure 5) is the main entry point for the metric calculation. The end-user first selects the required metrics. The “Already Calculated” button shows the calculated repositories already stored in the database. While these repositories can be a starting point for further exploration, the user can also place a URL in the textbox that points to a new public GIT repository or the location of an ontology file.
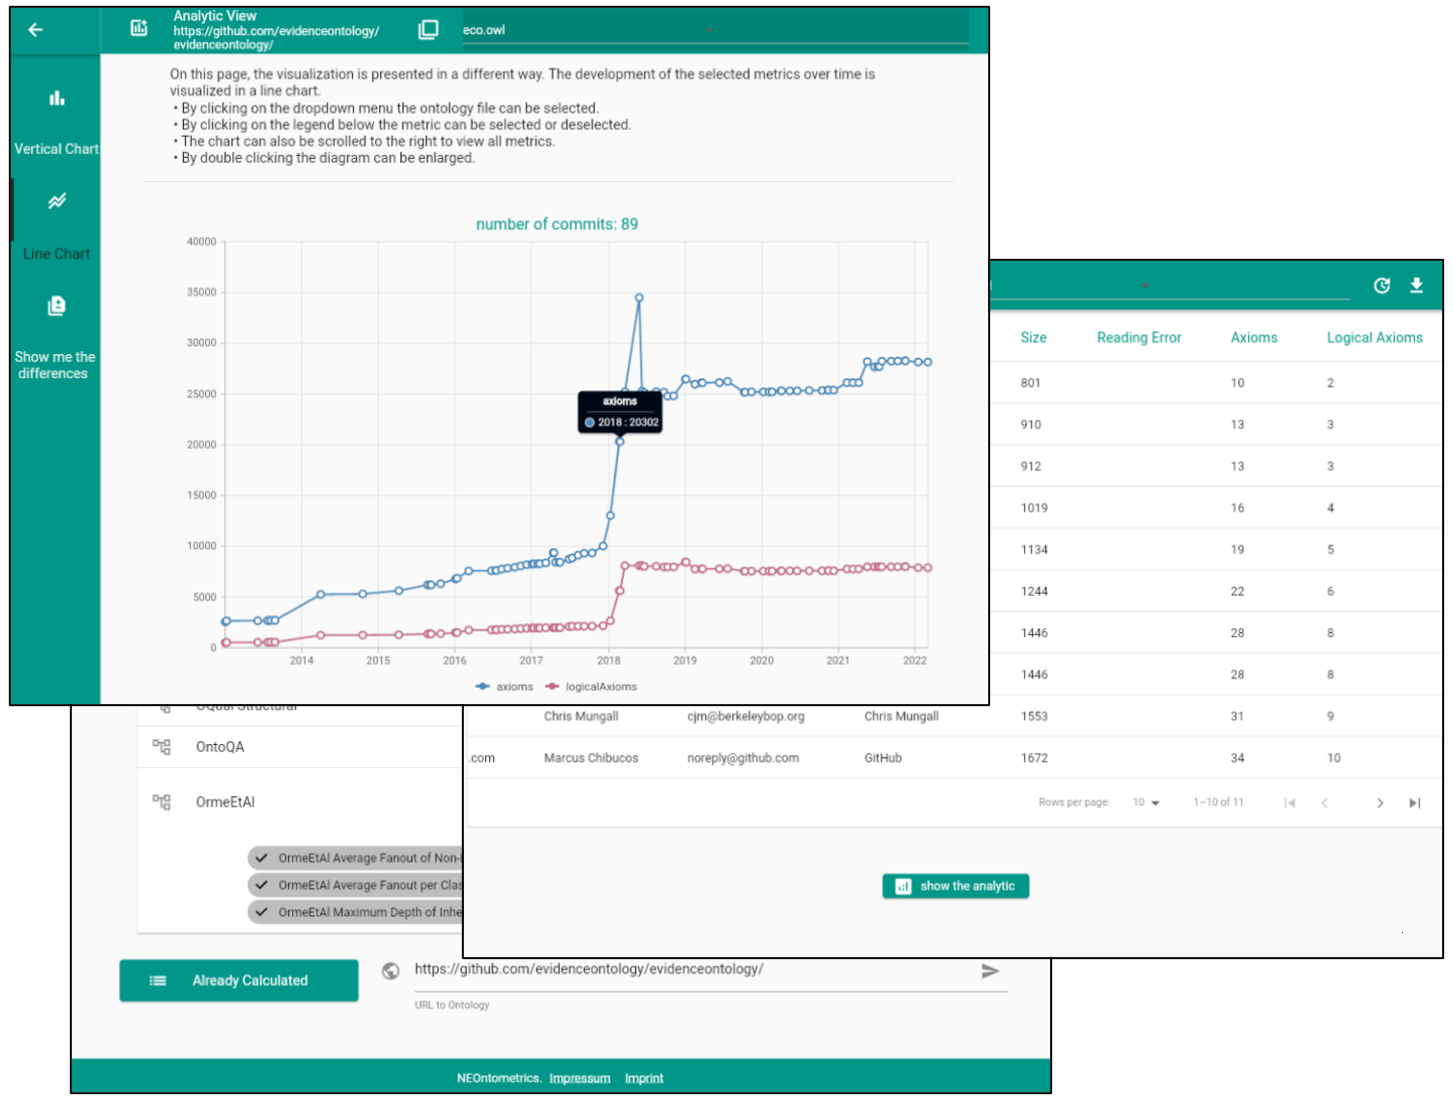
A click on the arrow starts the metric request. Once the data is analyzed, clicking the arrow leads to the metric results presented as a paginated table, representing the metric values for the different ontology versions. A drop-down menu in the header allows selecting the various ontology files, and the download button exports the metrics into a .csv. A click on the button “show the analytic” opens internal visualizations for displaying the ontology evolution, comparing the various ontologies in a repository, and assessing the recent changes.
One goal of NEOntometrics is to allow the integration of ontology metrics into semantic web applications, which requires exposing the service using a standardized interface. Relevant open standards are REST and GraphQL for the web and SPARQL for querying the semantic web. NEOntometrics builds on GraphQL.
GraphQL (together with REST) has become a new de facto standard for sharing information on the web, and there is broad support in various programming languages and frameworks. This support includes the django web framework used in this project, where the graphene plugin111111https://graphene-python.org/ allows utilizing the internal Object Relational Mapping. It allowed us to build the interface with comparatively little implementation effort, as the requests are translated to database queries automatically. While these integrations are also available for REST, GraphQL allows for the traversing of relationships and the precise selection of attributes for querying. Avoiding over-fetching is highly relevant for this use case, as one ontology version has over 100 ontology metrics, and the user likely selects just a few.
The GraphQL endpoint further provides documentation on the various available requests and possible return values, thus enabling the guided development of new queries. The interface is accessible through a browser on a GraphiQL interface or any other GraphQL client.
SPARQL, as a graph-based query language, has similar attributes to GraphQL regarding relationship traversal and attribute selection. Additionally, proving a SPARQL endpoint would further allow the integration of the metric calculations into existing knowledge bases. Unfortunately, there is (currently) no support in the form of plugins for integrating such an endpoint into the used django framework. This lack makes the creation of such an endpoint dissimilar costlier.
4 Bringing NEOntometrics Into Use
The following presents application scenarios for the NEOntometrics application. The first case study shows the potential of analyzing ontology evolution. The second part presents possible integration and adaptation scenarios for NEOntometrics.
4.1 Analyzing Ontology Evolution with NEOntometrics
Analyzing ontology metrics over time can tell a lot about underlying design decisions. The size of the changes indicates if an ontology evolves gradually or has disruptive changes, thus measuring stability and identifying the disruptive changes. They also allow us to assess how attributes like the logical complexity (e.g., measures through the number of axioms that incorporate meaning), the coverage (e.g., measured through the number of classes or individuals), or the shape of the graph (e.g., measured through depth or breadth) change over time.
This case study analyzes the Evidence and Conclusion Ontology (ECO). ECO captures the biological coherences like “gene product X has function Y as supported by evidence Z” [10]. The NEOntometrics authors have no affiliation with the authors of the ontology nor with the biomedical field of research. Further, the goal of the section is not to evaluate quality but to observe the development of the ontology over time to give an impression of possible assessments. Previous work discussed the connection between metrics and development decisions from an ontology engineering perspective [24, 36].
The ECO repository has 856 commits in 17 ontology files. For this analysis, we were interested in the main ontologies in this repository. Thus, we only assessed the ontologies in the root structure, resulting in three ontology files. eco.owl with 89 versions, eco-basic.owl with 44, and eco-base.owl with 45 versions. We first examined the axiom count of the ontologies and then used Tartir et al.’s OntoQA framework [32, 31] for further analysis. The corresponding source files in Jupyter Notebooks are available online121212doi.org/10.5281/zenodo.14047141.
The first analysis is concerned with the development of the ontology size. Figure 6 presents the three ontology files in their different versions and plots the development of axioms with time. While the solid line represents all axioms overall, the dashed line only accounts for such that incorporate a logical meaning in RDFS or OWL syntax. The difference between the dashed and the solid lines are, thus, annotations or custom-defined properties.
An insight of the chart in Figure 6 is the variances of the logical axioms and the axioms in general. While the size of the ontology overall fluctuates intensely, the number of parts of the ontology that incorporate logical meaning stays relatively stable. One significant spike occurred between 2018 and 2019, which we will scrutinize further. Analysis reveals that a more extensive restructuring of the ontology drives this increase in logical axioms. The classes in eco doubled from around 900 to a little over 2,000, then increased to over 3,000. The number of defined object properties jumps from three to above 50, and the relation on classes through object properties increases from 350 to almost 2,500, then drops to around 1,600. This change event also marked the introduction of eco-base and eco-basic.
Figure 7 shows the relationship richness and schema deepness defined in the OntoQA framework. The former is defined as the number of non-inheritance relationships divided by the sum of non-inheritance relationships and inheritance relationships, and the latter is the number of subclasses per class [32].
Figure 7 (left) shows that, after an initial increase due to the rise in object properties, the relationship richness of eco drops with the increase in classes and subClassOf statements. Also, object properties were introduced. Later, a decline in object properties, combined with the further increase in classes and subClassOf statements, partially reverses the growth.
The right diagram in Figure 7 provides more insights into the role of sub-class relationships. At first, a lot more subClassOf relationships than classes were introduced. However, the number of subClassOf relations later stagnated, even getting smaller. In contrast, the number of classes increased steadily. This suggests that the rebound in the relationship richness is driven more by the decline in object properties than the increase in subClassOf relationships. While the number of logical axioms is more or less stable, the underlying logical attributes of the ontology that constitute how the ontology is structured are still subjected to changes.
There are many more aspects that one could analyze for the given repository, and this section is merely a short demonstration of the value of environmental metrics. As the last diagram indicates, many more fluctuations are worth looking at. The variations affect the relationships between non-hierarchical and hierarchical relationships, classes, and graph-related structures like the width or depth, individuals, or data properties.
4.2 Adapting NEOntometrics by Adapting the Metric Ontology
A recent empirical analysis of 69 ontology evolution processes (based on NEOntometrics) has shown that the developments are highly heterogeneous and that assumptions on stereotypical development processes do not apply: There is no common rule or joint history that ontologies share [28]. If the ontologies are highly diverse, so is the required evaluation. This diversity of ontologies and their metrics emphasizes the careful selection of the latter. One person might build a taxonomy with rich human-readable annotations and other targets to infer knowledge by modeling complex class relationships. A successfully applied metric by the first person might not work for the second. While the Metric Explorer supports the selection process, a person might develop their measure to intertwine two metrics in a way that has not been done before. Organizations may want to select and reorder the metrics or limit the display to only relevant ones. The following subsection explains how to adapt the application by altering the metric ontology. While every ontology editor can be utilized for editing, this section builds on the open-source software Protégé [16]. The metric ontology is stored in the GitHub repository131313https://raw.githubusercontent.com/achiminator/NEOntometrics/master/Git-Extension/rest/metricOntology/OntologyMetrics.owl
4.2.1 Restructuring the Ontology Metrics
The two classes Elemental_Metrics and Quality_Frameworks are at the core of the metric calculation. The former represents the measurable ontology attributes and their implementation in NEOntometrics, and should only be changed if there is a need to define additional measurable ontology attributes. The Elemental_Metrics subclasses are essential for the startup of the application, and their alteration or deletion can lead to undesired behaviors. Thus, the individualization effort should occur in the subclasses of the Quality_Frameworks.
Reusing the existing metrics is possible by creating new, individual subclass structures for dedicated purposes. After restart, the software reads the new structure and injects it into the code. As an effect, the frontend displays the new categories, and the new subgroups can be quickly selected, reducing the complexity for the metric consumer. The example of Figure 8 illustrates custom-ordered metric categories in Protégé.
4.2.2 Creating New Ontology Metrics
The currently implemented quality frameworks based on the literature (cf. Table 4) already provide various metrics covering many use cases. However, reusing the existing metrics might not be sufficient depending on the individual challenges. In these cases, creating custom metric classes can provide a possible solution.
The ontology provides formalized properties for the extension of the ontology. The annotation properties MetricDefinition, MetricDescription, and MetricInterpretation fill the respective fields in the Metric Explorer (cf. Figure 4) to help the metric consumer to select suitable measures.
The object properties facilitate the connection of the reused or self-created Quality_Frameworks to the Elemental_Metrics and are the backbone for setting up the calculation unit. The subclasses of calculatedBy contain relations to describe the mathematical calculation operations of the application (cf. Figure 8).
The relation directlyUsesMetric states that a metric from a quality framework directly accesses an Elemental_Metric, e.g., the OQual_Absolute_Depth metric is a subclass of directlyUsesMetric only Total_Depth. Commutative operations like sum or multiplication are combined using the AND operator, e.g., sum only (Subclasses_Of_Thing and Super_Classes). Division and subtraction have further subclass for linking the elements. The mathematical relationships can be nested to create more complex queries.
As an example, the class with the name Average_Paths_Per_Concept, having a relationship SubClassOf (divisor only Classes) and (numerator only (sum only (Subclasses_Of_Thing and Super_Classes))) is first connected to the names of the given implemented database fields, represented by the connected individuals. Afterward, it is injected into NEOntometrics as:
5 Evaluation
While Section 4 focused on demonstrating the applicability of NEOnto, this section describes how the systematic evaluation of NEOnto against the objectives motivating our research was performed. As indicated in the introductory part of this paper, the development of NEOnto aimed at (a) supporting understanding and selecting ontology metrics, (b) a public metric calculation service that allows assessing ontologies from online resources, including calculation of evolutional data, and (c) with a scalable and adaptable architecture. Section 5.1 introduces the evaluation strategy applied, Section 5.2 summarizes the different evaluation episodes and their results, and Section 5.3 presents an additional evaluation episode focusing on performance improvement.
5.1 Evaluation Strategy
The aims motivating the development of NEOntometrics express the importance of creating an approach that is mature enough to be applied in the ontology engineering community without substantial development efforts. Our assumption is that the more an approach has been evaluated in theory and practice, the more mature and useful it is. Among the many scientific approaches for evaluating research results, we base our evaluation strategy on the work of Lincoln and Guba [12, p. 289 ff.] on “naturalistic inquiry”.
| Theory | Practice | |
|---|---|---|
| Internal, Development Team | Validation against state of research, internal consistency checks | Prototype implementation for checking feasibility, test in lab environment |
| External, in validation context | Peer-review of publications describing approach and concepts, comparison to known best practices of the domain. | Case studies with application partners using the artifacts for evaluation purposes, Application of the developed artifacts in cooperation / under instruction from developers |
| External, in application context | Development of extensions or enhancements of the concepts and approaches by external actors Application of the artifacts for creation of new theoretical knowledge, Comparison with related approaches | Use of the artifacts developed (e.g. algorithms, methods, software components) for solutions |
Lincoln and Guba distinguish between theoretical and practical validation. Theoretical validation means assessing an approach within the theories of the domain to which the approach is part or supposed to contribute. In the context of ontology metrics, this means assessing the soundness, feasibility, and consistency within the body of knowledge, such as ontology engineering and knowledge engineering. Practical validation encompasses all kinds of application of the approach for evaluation purposes, which requires defined procedures and documenting results. This could be simple lab examples illustrating the approach, controlled experiments in a lab setting, applications in industrial cases, etc.
Furthermore, Lincoln and Guba also consider the context of validation and distinguish between validation by the approach’s developers in their internal environment, validation by the developers outside the internal environment, and validation by actors other than the developers. Combining these two perspectives leads to a two-by-three matrix, as depicted in Table 5. The cells of this table show typical ways of validation for the different combinations of the two perspectives.
Usually, validation starts on the “internal, development team” level with validation in theory followed by validation in practice, and proceeds “downward” in the matrix with alternating theory and practice validation to “external, in application context”. Thus, the highest validation status would be reached if all cells in the matrix were covered.
As described above, Lincoln and Guba focus on validating research results, i.e., to check whether or not a certain result from research is appropriate for its purpose. In our case, the purpose of NEOntometrics is defined by the objectives (see introduction to this section 5). Validation and evaluation, even though different from each other, are very much linked. Evaluation is the process of assessing (and often computing) key characteristics of the research results, which can be used for validation purposes. As many of the NEOntometrics objectives require measurements instead of only checking characteristics, we use the term evaluation episodes in the next section.
5.2 Evaluation Episodes
Table 6 shows the performed validation episodes following Lincoln and Guba’s naturalistic inquiry framework. This section aims to summarize the intention and results of the different episodes. To emphasize the importance of the usefulness and applicability of the tool for the ontology engineering community, we put a focus on external validation. Many external validation episodes were published in peer-reviewed publications, and peer-reviewing was also used as an instrument for external validation. In total, six publications contribute to the evaluation steps.
Internal, Development Team.
Internally, we first validated that the results of the newly designed measures are consistent with the ones from the old application. This shall ensure continuity for analyses regardless of the used calculation backend. Further, the shortcomings of the predecessor OntoMetrics motivated the creation of the NEOntometrics tool. The technical shortcomings of the predecessor are described in section 3 and originated from a practical application with an industry partner, resulting in the feature list of Table 3. Regarding the practical evaluation, we tested the performance of the reworked measures. The results are shown in 5.3.
External, in Validation Context.
Two papers are part of the external validation context: The homogenization of ontology metrics in the metric ontology [26] and an early validation of the usefulness of analyzing evolutional ontology metrics [24].
The metric ontology (cf. Figure 1) was presented at the Conference on Knowledge Engineering and Ontology Design [26]. While many frameworks have been published over the years (cf. Section 2.1), no common language exists for naming measured elements. That led to similar metrics included in different frameworks, which is only apparent after close examination. The metric ontology homogenizes the various notions into one machine-readable notation that serves as the backbone of the NEOntometrics application and is served through the Metric Explorer.
A practical validation of the usefulness of analyzing evolutional ontology metrics was performed before the development of the NEOntometrics tooling and presented at the Business Informatics Research Conference [24]. This paper showed the potential of analyzing changes in ontology metrics over time by giving an abstract yet objective account of how development decisions influenced the ontology structure. Also, several obsolete axioms and areas that had not been developed further were identified.
External, in Application Context.
For the theoretical validation context, NEOntometrics was extended with a visualization capability [29]. In a practical setting, the tool examined various ontology versions to identify stereotypical development behavior [28], investigated and invalidated the broad quality claims made by the OQuaRE framework [27], and analyzed semantic media wikis [5].
One theoretical validation in the application context was performed as part of the Voilá Workshop for ontology visualization [29]. Here, we described how newly added visualization features can be used to compare various ontologies in a repository, analyze the evolution of one ontology throughout its lifetime, and a feature to compare the changes between the two most recent versions.
For the practical validation, we looked out for active use of the tool in research papers. First, the tool scrutinized stereotypical development behavior in dormant ontologies, published as part of the invited extended conference papers on Knowledge Engineering and Ontology Development (KEOD) 2022 [28]. Using public git repositories, 7,053 ontology versions of 69 ontologies showed the heterogeneous development of ontologies throughout their lifetime. We could invalidate many commonly held assumptions with the numerical assessments, like “ontologies tend to get larger over their lifetime” or “ontologies get more complex with increasing maturity”.
The next analysis concerned the quality statements of the often-cited OQuaRE framework; this analysis was published as an extended version of the contribution of the International Conference on Information Systems (ICEIS) 2022 [27]. OQuaRE not only recommends ontology measures but also desirable value ranges for the given measurements. However, while integrating the ontology metrics in the NEOntometrics metric ontology, we identified several inconsistencies in their metric proposal, leading to a homogenization effort of the various measures. Further examination based on the data collected with NEOntometrics on the validity of the made quality statements through the analysis of 4,094 ontologies found that the framework’s quality statements likely do not reflect the actual performance of the modeled artifacts.
Finally, the calculation software was used by Dobriy et al. [5] in an analysis of semantic media wikis, presented at the Extended Semantic Web Conference (ESWC) 2024. The authors analyzed a corpus of 1,029 datasets containing wikis for various use cases. The authors found significant deviations between the structures of the semantic media wikis and the linked open data cloud, especially regarding the use of RDFS and OWL semantics.
| Theory | Practice | |
|---|---|---|
| Internal, Development Team | Internal Checks for consistent Measurement of the old and new metric calculation engine. Feature requirements out of the predecessors’ shortcomings. (cf. Section 3.1) | Test of calculation performance (cf. Section 5.3). |
| External, in validation context | Metric Ontology containing the implemented ontology metrics [26]. | Case-Study on the value of evolutional metric analysis [24]. |
| External, in application context | Extending the software with metric Visualization Capabilities [29]. | Analysis on stereotypical ontology evolutional processes [28]. An empiric examination of the OQuaRE quality claims [27]. Evaluating Semantic Media Wikis [5]. |
5.3 Evaluation of Computational Performance
Besides the additional functionality powered by the microservice architecture of NEOntometrics, the calculation engine has also been reworked to improve performance and resource consumption. The following evaluation compares the old OntoMetrics [25] with the performance of the reworked metric calculation (cf. Figure 3). The old Ontometrics engine calculates 72 measurements, 16 of these measurements are ratio-based metrics. The new calculation engine only measures the underlying atomic measures, 83 in total.
For the test, we run both calculation services in dockerized environments on the same machine (Lenovo z13 G2, 64GB Ram, AMD Ryzon Pro 7840U). We run a calculation of three different ontologies: The puppet-Disco inferred ontology141414https://raw.githubusercontent.com/kbarber/puppet-ontologies/master/puppet-disco/inferred.owl, the larger human disease (DOID) ontology with 24MB151515https://raw.githubusercontent.com/DiseaseOntology/HumanDiseaseOntology/main/src/ontology/doid.owl, and the ECO ontology of Section 4.1 with 7.2MB161616https://raw.githubusercontent.com/evidenceontology/evidenceontology/master/eco.owl. Ten times, we send the puppet ontology, then human disease, and finally, the ECO ontology to the new calculation service and then the old one. We measured the response time and queried the docker stats to analyze memory footage. The jupyter notebook used for analysis is available online121212doi.org/10.5281/zenodo.14047141. The first analysis presented in Figure 9 displays the average calculation times for each of the ontologies. The small Puppet Ontology is sped up 35 times in its analysis, while the human disease ontology calculates 6.5 times faster, and ECO 29 times faster.
The second analysis in Figure 10 measures the engine’s memory consumption by extracting the docker statistics after each run. Here, the rework of the calculation engine cut the required memory of the analysis to a fifth.
6 Conclusion
Ontologies are in use in various applications, facilitating meaning between human and computational actors and enabling these actors to harness the full potential of structured knowledge. The rising number of developed ontologies emphasizes the need for practical evaluations.
The research community has identified this need for quite some time. Many ontology metric frameworks have been proposed that assess a variety of ontology attributes. However, implementations of these frameworks have been scarce. The missing software hinders the research progress: While the definition of measurements is important, it is then crucial to put these metrics into use to perform further evaluations.
The application proposed in this paper aims at closing this gap. We presented NEOntometrics, an open-source software to calculate ontology metrics. The application integrates several metric frameworks and is easily extensible. It is possible to analyze the development of metrics over time by analyzing GIT-based ontology repositories. Further, the user can inform themselves of available calculations and possible implications using an interactive Metric Explorer. The ontology metrics can be calculated and retrieved either using a graphical user interface or a GraphQL-API. While the former is targeted at knowledge engineers, the latter shall allow developers of semantic-based applications to integrate metrics into their software.
In a case study, we briefly presented possible applications. The evaluation further shows that the software works with large ontologies on an average machine and demonstrates how it has already enabled research on ontology evolution and existing metric frameworks.
The software still has limitations, which motivates further work. One active task is adding more potential metric sources, like private repositories or enabling the manual upload of new graph versions. Further, we aim to add metrics on the specific elements within an ontology, like class-specific and relation-specific measurements. The OntoQA framework by Tartir et al. [32, 31] has some element-specific measures that are a potential starting point. Finally, since most of the frameworks were proposed over 10 years ago, the semantic web community moved forward quite considerably in terms of new vocabularies: The Shape Constraint Language (SHACL) was proposed and is increasingly adopted, and there is a growing need to create evaluations to the constraint specifics of the language.
Our perception is that quantitative ontology research offers much potential for future research, which benefits from continuous interaction in the community. In this context, we are interested in the aspects the community would like to see implemented in our tool and ask for participation171717Contributors or users are asked to create an issue in the GitHub repository to start a discussion on a new feature or potential bug: https://github.com/achiminator/NEOntometrics/issues.
Further research will be concerned with analyzing the metric data itself. There are many more aspects worth looking at regarding empirical ontology development studies, like comparing typical development processes in different fields (e.g., industrial vs. biomedical ontologies), the usefulness of the proposed frameworks, and the modeling preferences of different persons, to name a few. In the long term, we hope that NEOntometrics impacts the use and research of ontology metrics and that it can help us empirically understand ontology modeling better.
References
- [1] Muhammad Amith, Frank Manion, Chen Liang, Marcelline Harris, Dennis Wang, Yongqun He, and Cui Tao. OntoKeeper: Semiotic-driven Ontology Evaluation Tool For Biomedical Ontologists. Journal of biomedical semantics, 8(1), 2017. doi:10.1109/BIBM.2018.8621458.
- [2] Andrew Burton-Jones, Veda C. Storey, Vijayan Sugumaran, and Punit Ahluwalia. A semiotic metrics suite for assessing the quality of ontologies. Data & Knowledge Engineering, 55(1):84–102, 2005. doi:10.1016/j.datak.2004.11.010.
- [3] Valerie Cross and Anindita Pal. Ontocat: An ontology consumer analysis tool and its use on product services categorization standards. In Proceedings of the First International Workshop on Applications and Business Aspects of the Semantic Web, 2006.
- [4] Renata Dividino, Massimo Romanelli, and Daniel Sonntag. Semiotic-based ontology evaluation tool S-OntoEval. In Proceedings of the International Conference on Language Resources and Evaluation, 2008.
- [5] Daniil Dobriy, Martin Beno, and Axel Polleres. Smw Cloud: A Corpus of Domain-Specific Knowledge Graphs from Semantic MediaWikis. In The Semantic Web - 21st International Conference, ESWC 2024, Hersonissos, Crete, Greece, May 26–30, 2024, Proceedings, Part II, pages 145–161, 2024. doi:10.1007/978-3-031-60635-9_9.
- [6] Astrid Duque-Ramos, J. T. Fernández-Breis, R. Stevens, and Nathalie Aussenac-Gilles. OQuaRE: A SQuaRE-based Approach for Evaluating the Quality of Ontologies. Journal of Research and Practice in Information Technology, 43(2):159–176, 2011. URL: http://ws.acs.org.au/jrpit/JRPITVolumes/JRPIT43/JRPIT43.2.159.pdf.
- [7] Miriam Fernández, Chwhynny Overbeeke, Marta Sabou, and Enrico Motta. What Makes a Good Ontology? a Case-Study in Fine-Grained Knowledge Reuse. In The semantic web - Fourth Asian Conference, ASWC 2009, Shanghai, China, December 6-9, 2008. Proceedings, volume 5926 of Lecture notes in computer science, pages 61–75, Berlin, 2009. Springer. doi:10.1007/978-3-642-10871-6_5.
- [8] Aldo Gangemi, Carola Catenacci, Massimiliano Ciaramita, and Jos Lehmann. Modelling Ontology Evaluation and Validation. In The semantic web: research and applications, volume 4011 of Lecture notes in computer science, pages 140–154, Berlin, 2006. Springer. doi:10.1007/11762256_13.
- [9] Aldo Gangemi, Carola Catenacci, Massimiliano Ciaramita, Jos Lehmann, Rosa Gil, Francesco Bolici, and Strignano Onofrio. Ontology evaluation and validation: An integrated formal model for the quality diagnostic task, 2005.
- [10] Michelle Giglio, Rebecca Tauber, Suvarna Nadendla, James Munro, Dustin Olley, Shoshannah Ball, Elvira Mitraka, Lynn M. Schriml, Pascale Gaudet, Elizabeth T. Hobbs, Ivan Erill, Deborah A. Siegele, James C. Hu, Chris Mungall, and Marcus C. Chibucos. ECO, the Evidence & Conclusion Ontology: community standard for evidence information. Nucleic Acids Research, 47(D1):D1186–D1194, 2019. doi:10.1093/nar/gky1036.
- [11] Birger Lantow. OntoMetrics: Putting Metrics into Use for Ontology Evaluation. In Proceedings of the 8th IC3K 2016 International Joint Conference on Knowledge Discovery, Knowledge Engineering and Knowledge Management (KEOD), pages 186–191, 2016. doi:10.5220/0006084601860191.
- [12] Yvonna Lincoln and Egon Guba. Naturalistic Inquiry. SAGE Publications, Inc, 1985.
- [13] Adolfo Lozano-Tello and Asunción Gómez-Pérez. ONTOMETRIC: A Method to Choose the Appropriate Ontology. Journal of Database Management, 15(2):1–18, 2004. doi:10.4018/jdm.2004040101.
- [14] Yinglong Ma, Beihong Jin, and Yulin Feng. Semantic oriented ontology cohesion metrics for ontology-based systems. Journal of Systems and Software, 83(1):143–152, 2010. doi:10.1016/j.jss.2009.07.047.
- [15] C.J.H. Mann. Ontologies: A Silver Bullet for Knowledge Management and Electronic Commerce. Kybernetes, 33(7), 2004. doi:10.1108/k.2004.06733gae.001.
- [16] Mark A. Musen. The Protégé Project: A Look Back and a Look Forward. AI matters, 1(4):4–12, 2015. doi:10.1145/2757001.2757003.
- [17] Anthony Mark Orme, Haining Yao, and Letha H. Etzkorn. Indicating Ontology Data Quality, Stability, and Completeness Throughout Ontology Evolution. Journal of Software Maintenance and Evolution, 19(1):49–75, 2007. doi:10.1002/smr.341.
- [18] María Poveda-Villalón, Asunción Gómez-Pérez, and Mari Carmen Suárez-Figueroa. OOPS! (OntOlogy Pitfall Scanner!). Semantic Web and Information Systems, 10(2):7–34, 2014. doi:10.4018/ijswis.2014040102.
- [19] Qing Lu and Volker Haarslev. OntoKBEval: A Support Tool for DL-based Evaluation of OWL Ontologies. In OWLED - OWL: Experiences and Directions, 2006.
- [20] Joe Raad and Christophe Cruz. A Survey on Ontology Evaluation Methods. In Proceedings of the 7th International Joint Conference on Knowledge Discovery, Knowledge Engineering and Knowledge Management, pages 179–186, Setúbal, 2015. SciTePress. doi:10.5220/0005591001790186.
-
[21]
Achim Reiz.
neontometrics.
Software, swhId:
swh:1:dir:a0a2d612a4de911f171dadcefb66dcc1c
5b42bd9 (visited on 2024-12-09). URL: https://github.com/achiminator/neontometrics, doi:10.4230/artifacts.22597. - [22] Achim Reiz, Henrik Dibowski, Kurt Sandkuhl, and Birger Lantow. Ontology Metrics as a Service (OMaaS). In Proceedings of the 12th International Joint Conference on Knowledge Discovery, Knowledge Engineering and Knowledge Management, pages 250–257, 02.11.2020 - 04.11.2020. doi:10.5220/0010144002500257.
- [23] Achim Reiz and Kurt Sandkuhl. neontometrics online calculation. InteractiveResource (visited on 2024-12-09). URL: http://neontometrics.com, doi:10.4230/artifacts.22599.
- [24] Achim Reiz and Kurt Sandkuhl. Design Decisions and Their Implications: An Ontology Quality Perspective. In Perspectives in Business Informatics Research, volume 398 of Lecture Notes in Business Information Processing (LNBIP), pages 111–127, Vienna, 2020. doi:10.1007/978-3-030-61140-8_8.
- [25] Achim Reiz and Kurt Sandkuhl. NEOntometrics: A Flexible and Scalable Software for Calculating Ontology Metrics. In Proceedings of Poster and Demo Track and Workshop Track of the 18th International Conference on Semantic Systems co-located with 18th International Conference on Semantic Systems (SEMANTiCS 2022), Vienna, 2022. CEUR-WS.
- [26] Achim Reiz and Kurt Sandkuhl. An Ontology for Ontology Metrics: Creating a Shared Understanding of Measurable Attributes for Humans and Machines. In Proceedings of the 14th International Joint Conference on Knowledge Discovery, Knowledge Engineering and Knowledge Management, pages 193–199. SCITEPRESS - Science and Technology Publications, 2022. doi:10.5220/0011551500003335.
- [27] Achim Reiz and Kurt Sandkuhl. A Critical View on the OQuaRE Ontology Quality Framework. In Enterprise Information Systems, volume 487 of Lecture Notes in Business Information Processing, pages 273–291. Springer Nature Switzerland, Cham, 2023. doi:10.1007/978-3-031-39386-0_13.
- [28] Achim Reiz and Kurt Sandkuhl. Evolution of Computational Ontologies: Assessing Development Processes Using Metrics. In Knowledge Discovery, Knowledge Engineering and Knowledge Management - 14th International Joint Conference, IC3K 2022, Valletta, Malta, October 24–26, 2022, Revised Selected Papers, volume 1842 of Communications in Computer and Information Science, pages 217–238. Springer Nature Switzerland, Cham, 2023. doi:10.1007/978-3-031-43471-6_10.
- [29] Achim Reiz and Kurt Sandkuhl. Visualizing Ontology Metrics In The NEOntometrics Application. In Proceedings of the 8th International Workshop on the Visualization and Interaction for Ontologies, Linked Data and Knowledge Graphs co-located with the 22nd International Semantic Web Conference (ISWC 2023), 2023.
- [30] Achim Reiz and Kurt Sandkuhl. neontometrics TGDK dataset, November 2024. doi:10.5281/zenodo.14047141.
- [31] Samir Tartir and I. Budak Arpinar. Ontology Evaluation and Ranking using OntoQA. In International Conference on Semantic Computing, 2007, pages 185–192, Los Alamitos, Calif., 2007. IEEE Computer Society. doi:10.1109/ICSC.2007.19.
- [32] Samir Tartir, I. Budak Arpinar, Michael Moore, Amit P. Sheth, and Boanerges Aleman-Meza. Ontoqa: Metric-Based Ontology Quality Analysis. In IEEE Workshop on Knowledge Acquisition from Distributed, Autonomous, Semantically Heterogeneous Data and Knowledge Sources, 2005.
- [33] Pierre-Yves Vandenbussche, Ghislain A. Atemezing, María Poveda-Villalón, and Bernard Vatant. Linked Open Vocabularies (LOV): A gateway to reusable semantic vocabularies on the web. Semantic web, 8(3):437–452, 2016. doi:10.3233/SW-160213.
- [34] Patricia L. Whetzel, Natasha Noy, Nigam Haresh Shah, Paul R. Alexander, Csongor Nyulas, Tania Tudorache, and Mark A. Musen. BioPortal: enhanced functionality via new web services from the National Center for Biomedical Ontology to access and use ontologies in software applications. Nucleic Acids Research, 39, 2011. doi:10.1093/nar/gkr469.
- [35] Haining Yao, Anthony Mark Orme, and Letha Etzkorn. Cohesion Metrics for Ontology Design and Application. Journal of Computer Science, 1(1), 2005. doi:10.3844/jcssp.2005.107.113.
- [36] Jonathan Yu, James A. Thom, and Audrey Tam. Requirements-oriented methodology for evaluating ontologies. Information Systems, 34(8):766–791, 2009. doi:10.1016/j.is.2009.04.002.
- [37] Dalu Zhang, Chuan Ye, and Zhe Yang. An Evaluation Method for Ontology Complexity Analysis in Ontology Evolution. In Managing knowledge in a world of networks - 15th International Conference, EKAW 2006, Podebrady, Czech Republic, October 6-10, 2006, Proceedings, volume 4248, 2006. doi:10.1007/11891451_20.