KG2Tables: A Domain-Specific Tabular Data Generator to Evaluate Semantic Table Interpretation Systems

Abstract
Tabular data, often in the form of CSV files, plays a pivotal role in data analytics pipelines. Understanding this data semantically, known as Semantic Table Interpretation (STI), is crucial but poses challenges due to several factors such as the ambiguity of labels. As a result, STI has gained increasing attention from the community in the past few years. Evaluating STI systems requires well-established benchmarks. Most of the existing large-scale benchmarks are derived from general domain sources and focus on ambiguity, while domain-specific benchmarks are relatively small in size. This paper introduces KG2Tables, a framework that can construct domain-specific large-scale benchmarks from a Knowledge Graph (KG). KG2Tables leverages the internal hierarchy of the relevant KG concepts and their properties. As a proof of concept, we have built large datasets in the food, biodiversity, and biomedical domains. The resulting datasets, tFood, tBiomed, and tBiodiv, have been made available for the public in the ISWC SemTab challenge (2023 and 2024 editions). We include the evaluation results of top-performing STI systems using tFood Such results underscore its potential as a robust evaluation benchmark for challenging STI systems. We demonstrate the data quality level using a sample-based approach for the generated benchmarks including, for example, realistic tables assessment. Nevertheless, we provide an extensive discussion of KG2Tables explaining how it could be used to create other benchmarks from any domain of interest and including its key features and limitations with suggestions to overcome them.
Keywords and phrases:
Semantic Table Interpretation (STI), Knowledge Graph (KG), STI Benchmark, Food, Biodiversity, BiomedicalCategory:
ResourceCopyright and License:
2012 ACM Subject Classification:
Information systems Information integrationAcknowledgements:
The authors would like to thank Sirko Schindler for his help to setup JenTab. In addition, we thank Marco Cremaschi and Roberto Avogadro from s-elbat team, Fidel Jiomekong from TSOTSA team, Yoan Chabot from DAGOBAH team, Ioannis Dasoulas from TorchicTab team for the early and quick tFood solving.DOI:
10.4230/TGDK.3.1.1Received:
2024-06-13Accepted:
2025-01-06Published:
2025-04-11Part Of:
TGDK, Volume 3, Issue 1Journal and Publisher:
1 Introduction
Semantic Table Interpretation (STI) has recently witnessed increasing attention from the community [42]. The goal of this process is to map individual table components, e.g., cells and columns, or even the entire table, to entities and classes from a target Knowledge Graph (KG) such as Wikidata [41], DBpedia [15], or Schema.org [25]. Such process is expressed in five STI-tasks: Cell Entity Annotation (CEA), Column Type Annotation (CTA), Column Property Annotation (CPA), Row Annotation (RA), and Topic Detection (TD). We give the details of each of them in Section 2. Since 2019, the Semantic Web Challenge on Tabular Data to Knowledge Graph Matching (SemTab)222https://www.cs.ox.ac.uk/isg/challenges/sem-tab/, which is running for the sixth time this year, has aimed at setting a common standard for evaluating STI systems [30, 31, 22, 1, 14]. It poses various challenges and benchmarks333We use benchmarks and datasets interchangeably in this paper. every year. Most of the datasets are Automatically Generated (AG) except for the Tough Tables (2T) [21] and BiodivTab [12] datasets that have been manually curated. Most of these benchmarks, including 2T, are derived from the general domain. BiodivTab is an exception as it is a biodiversity-specific dataset. The SemTab results showed that this dataset was much harder to tackle than the domain-independent ones for state-of-the-art systems participating in the challenge [22]. We believe this is due to domain-specific challenges that general-purpose systems are ill-equipped to handle or require extensive tuning or training data. In order to improve performance on this vital group of datasets, we argue that a broader range of domain-specific test data is urgently needed. Due to the high effort in creation (in particular, the need for manual curation), BiodivTab is a relatively small dataset compared to others in the competition; this might be a drawback influencing evaluation results. Therefore, there is a need for larger, domain-specific datasets to be included within the community-driven evaluation campaigns. In this paper, we propose a technique that enables the creation of large-scale and domain-specific benchmarks without massive human intervention from a KG. We focus on three crucial domains: food, biodiversity, and biomedicine.
An impressive number of STI systems have been developed over the past years to solve the common challenges of STI tasks. To encourage these systems to tackle STI tasks in a specific domain, we need to provide a systematic evaluation using well-established benchmarks following the FAIR (findable, accessible, indescribable, and reusable) [44] principles. In particular, benchmarks are needed that cover domains of high practical or scientific relevance. Thus, we introduce a domain-agnostic approach that constructs domain-specific tabular data benchmarks for STI given a KG. As a proof of concept, we introduce three novel tabular data benchmarks derived from Wikidata to evaluate existing STI systems.
The main contributions of this paper, extending those of our previously published ISWC 2024 poster paper [3], are as follows:
-
KG2Tables, a detailed overview of a general framework to construct domain-specific STI benchmarks. It leverages the internal hierarchy of related domain concepts from a KG.
-
Novel large-scale tabular data benchmarks for three domains supporting five STI-tasks.
-
Evaluation of the generated benchmarks and a comparison with the state of the art. One of these datasets, tFood, was made available in the SemTab 2023 Challenge. The others, tBiodiv and tBiomed, have been included in the 2024 edition.
-
tFood evaluation through the current top-performing STI-systems besides the SemTab 2023 participation.
-
Data quality inspection for three subsets of the generated benchmarks.
-
Extensive discussion of KG2Tables with respect to its limitations and potential future solutions. In addition to a detailed guide on how to use KG2Tables to create other benchmarks.
The rest of this paper is organized as follows: We give the prior background of this work by explaining table types and STI tasks in Section 2. We provide an overview of the existing benchmarks and discuss their limitations in Section 3. We demonstrate our KG2Tables approach in Section 4. We evaluate our generated benchmarks in Section 5. We demonstrate the limitations of KG2Tables with an extensive discussion in Section 6 We conclude this work and present future directions in Section 7.
2 Background
Tabular Data
A table could be just a layout or encapsulate a certain amount of information [43]. The former is used for visualization (layout table). However, the latter expresses a topic or thing (genuine table). Genuine tables can be categorized along two dimensions [39, 35]: (i) Inner-relationship dimension: a table could be Relational (footnote 6(a)), Matrix (footnote 6(b)), or Entity (footnote 6(c)), (ii) Orientation dimension: it considers the direction of relationships inside a table, it could be horizontal, vertical, or matrix. Entities are described row-wise in horizontal tables (footnote 6(a)). They are described by a column in vertical tables (footnote 6(c)). Matrix tables cannot be interpreted row by row or column by column but rather cell by cell while simultaneously considering both horizontal and vertical headers as given by footnote 6(b). For example, our dataset tFood contains both Horizontal Relational Tables and Entity Tables.
Matching Tasks
State-of-the-art STI tasks propose ways to annotate tabular data semantically and, thus, facilitate a potential transformation into a KG. Figure 2 gives an overview of the five most common STI tasks. The tasks are described below (the examples assume Wikidata is the target KG):
-
1.
Cell Entity Annotation (CEA) aims at linking a table cell value to a KG entity. In the case of Figure 2, ‘Egypt’ would be linked to ‘wd:Q79’777 We use the following prefixes throughout this paper: wd: http://www.wikidata.org/entity/, wdt: http://www.wikidata.org/prop/direct/ .
-
2.
Column Type Annotation (CTA) maps the entire column to a semantic type. In the example of Figure 2, it annotates the highlighted column to ‘wd:Q6256’ (country).
-
3.
Column Property Annotation (CPA) links a column pair (subject-object) with a semantic property from the target KG. In Figure 2, country and capital columns would be linked through ‘wdt:P1376’ (capital) from the target KG.
-
4.
Row Annotation (RA) maps the entire row to a KG entity. Its output is different from the first task since the subject column may be absent as in the example of Figure 2. Row to instance would be able to detect that the entire third row refers to ‘wd:Q30’ (United States of America)888RA is different in Entity Tables. It maps the row to a property instead of an instance..
-
5.
Topic Detection (TD) classifies the entire table to a topic. Such topic could be a KG class or entity. ‘wd:Q6256’ (country) would be the solution for the table in Figure 2.
SemTab Challenge
The Semantic Web Challenge on Tabular Data to Knowledge Graph Matching (SemTab) defines a standard framework to evaluate STI approaches. It has been held annually since 2019 and so far co-occurred along with the International Semantic Web Conference (ISWC) and Ontology Matching (OM) workshop. During the series of the challenge, various tasks of the STI are posed to participants including CEA, CTA, and CPA tasks with various synthetic benchmarks from the general domain [30, 31, 22, 1, 21, 28] and realistic domain-specific datasets [12, 13]. The SemTab challenge had a large impact on the community since the highest number of STI systems have been developed and took part in the challenge during its years [35].
3 Related Work
In the following, we give an overview of a common generator for STI benchmarks. In addition, we discuss the current state-of-the-art and most widely used benchmarks for STI and their limitations.
3.1 Existing Datasets Generators
SemTab 2019 [30] introduced a new collection of benchmarks created using an automated data generator. The data generator takes a KG with a SPARQL endpoint as input and first performs profiling to identify classes, properties, and their characteristics. It then uses the profiling output to generate tables where: a) each table contains a set of entities of a particular class type (e.g., person), b) the first column in each table contains an identifier label (e.g., person name), c) other columns in each table contain property values (e.g., age or place of birth), and d) errors and variations are introduced in each cell value to make the annotation task more challenging. Each generated table comes with ground truth annotations for CEA (mapping each label to the KG entity), CTA (mapping each column to the associated class), and CPA (mapping the first column and every other column to the property used to populate the column contents). The SemTab 2019 generator retrieves only direct properties for each class without considering the subclass hierarchy in the KG. The primary mechanism for data generation in the generator is randomly selecting property sets and running SPARQL queries to find those that produce complete tables with no null values.
3.2 Existing Benchmarks
In the following, we discuss the most common benchmarks that are used for evaluating STI systems with an overview of their limitations. We provide comparison tables for such benchmarks, including our newly generated ones in Table 2 and Table 3 (see Section 5).
Limaye [34] is one of the earliest benchmarks developed for STI tasks. It aims to annotate web tables using the YAGO KG. The dataset is divided into four subsets according to the data source, the labeling method, and application scenarios. Three subsets are manually labeled, while the fourth one is automatically generated. Altogether, it constructs the final benchmark with 428 annotated tables. Annotation errors were reported for the automatically labeled subset [36], which were corrected by Bhagavatula et al. [18] in 2015. Later on, in 2017, Efthymiou et al. [24] adapted the disambiguation links to the DBpedia KG.
T2Dv2 [33] is the recent edition of the T2D [40] gold standard where annotation errors are fixed. It is widely used by STI systems like Limaye et al. [34] and others. Up to 2019, T2Dv2 along with Limaye were the main benchmarks used by STI systems. T2Dv2 covers the tasks of row-to-instance (RA in our context), attribute-to-property (maps to our definition of CPA), and table-to-class (TD following our definition), for 779 tables that are derived from WebTables [19] where the target KG is DBpedia. In addition, T2Dv2 provides extensive metadata, such as the context of the table and whether the table has a header.
ToughTables (2T) [21] is a set of 180 tables that are annotated from Wikidata and DBpedia. The first use of 2T was during SemTab 2020 fourth round. It focuses on the ambiguity among entity mentions in a way that makes it hard to disambiguate by a human expert. The authors did not rely on the automatic generation of the dataset only but also provided manual curation of such annotation to avoid false positives while evaluating a matching algorithm. It contains real tables that reflect a knowledge gap between the target KG and an input table. Misspellings are frequent and intense, which is useful for testing the weight of lexical features an algorithm could use. In addition, a large number of rows is used to evaluate the system’s performance.
GitTables [28] is a subset of the original dataset [27] that was introduced in SemTab 2021. It is a collection of 1,101 tables crawled from GitHub. They are annotated with DBpedia and schema.org for the CTA task. GitTables poses a special case of CTA where the target annotation match is not only a KG class but also a KG property. However, we analyzed the provided CTA targets; we found GitTables has a sparse table structure leading to empty or almost empty columns, making the CTA task very challenging.
SemTab 2019-2020 [30, 31] are the first and second benchmarks that were introduced by SemTab challenge in 2019 and 2020, respectively. Both are large-scale datasets automatically generated (AG) from DBpedia and Wikidata, consisting of and tables, respectively. The common data issues in both benchmarks are misspellings and ambiguity among table rows. These benchmarks also focus on testing the ability of a system to scale.
HardTables 2021-2022 [22, 1] are the benchmarks that were introduced by SemTab’s third and fourth editions in 2021 and 2022. They also focus on misspellings and ambiguities. Each consists of tables generated using an improved version of the data generator introduced in 2019 [30] that creates more realistic-looking tables. Tables that are correctly annotated by baseline methods are removed to create a harder dataset.
WikidataTables [14] is the benchmark that was published during SemTab’s fifth edition in 2023. This dataset is also generated by an improved version of the 2019 data generator and consists of tables. However, it is generated using a configuration that resulted in a large number of very small tables with a high level of ambiguity for entity columns. This was done by selecting labels that can refer to more than one entity in Wikidata.
BioTables [37] is a dataset that is used during SemTab 2021. It is derived from the biomedical domain and consists of 110 tables. Its unique characteristic is that it contains columns with very long descriptions from Wikidata.
BiodivTab [12, 13] is a biodiversity-specific benchmark manually annotated using Wikidata and DBpedia concepts. It consists of tables that are derived from real and augmented tables. BiodivTab featured new challenges besides the common ambiguity issue and spelling mistakes, like the nested entities in a single cell and the synecdoche; biodiversity scientists might use a city name instead of a target river or an ecosystem name. For example, we found an occurrence for Kentucky (city) to represent Kentucky River (river).
Limitations of Existing Benchmarks
By analyzing these benchmarks, we found that all of them except BioTables and BiodivTab are derived from the general domain. This means that some very difficult challenges faced in certain domains could be significantly underrepresented or even absent in such datasets. In addition, they focus mainly on ambiguity and spelling mistakes. However, as highlighted in BiodivTab, real-world datasets adopt a particular domain feature and distinctive challenges other than ambiguity. In addition, all of them are synthetic and AG datasets with two exceptions, 2T and BiodivTab. Both are relatively small as they consist of 180 and 50 tables, respectively.
4 KG2Tables Approach
KG2Tables accepts a list of related domain concepts in a CSV file. It parses these concepts to construct a tree structure of these concepts. In Wikidata, domain concepts form a graph structure since the KG allows that. However, KG2Tables process each relevant concept only once. Figure 3 demonstrates the recursive methodology of KG2Tables with a configured four levels of depth. We construct the respective tree structure using the internal hierarchy of the input concepts. i.e., in Wikidata, we have included all instances and subclasses via SPARQL queries.999Section 5 provides concrete examples of how a non-exhaustive list of input concepts can be defined for a specific domain. We determined both using via wdt:P31, instance of and wdt:P279, subclass of. We use the term ‘Children’ to generalize related instances or subclasses. The tree structure is different in DBpedia, for example, where, the internal hierarchy is determined via the predicate rdf:type only. We applied a deduplication step since the overall instances and subclasses may overlap. Such overlap may also occur across different levels of the tree.
Figure 4 extends Figure 3 with the logical steps to depict the approach we developed to construct domain-specific benchmarks. In a given depth level of the tree structure, it retrieves the current children of domain concepts and then follows with four steps: (1) Create Horizontal Tables and (2) Create Raw Entity Tables: we constructed both types of tables based on the properties of the current children; these tables contain the solutions of all STI tasks. (3) Refine Tables: we revised the collected data and applied several steps to construct the final tables. (4) Format Benchmark: we separated tables from solutions and targets to create a complete set of STI tasks. In the following, we explain the individual steps.
4.1 Create Raw Horizontal Tables
We retrieved both instances and subclasses for each level using a recursive method for each concept. For example, at the first level, for each concept in the input domain, we identified three folds: direct instances, subclasses, and instances of subclasses. For each fold, we applied two kinds of table generation methods to construct horizontal relational tables: a description-based method and properties-based methods.
Descriptions-based Method
We have collected long descriptions for all children for each fold in the three data folds. Some descriptions are unavailable in the KG, thus yielding an empty row in the final table. The following Equation 1 describes this method. It creates a table with a single column where each row holds a long description, , of the retrieved of the current concept in a data fold .
| (1) |
Properties-based Methods
We retrieved all properties for each child, grouping them by data fold and excluding labels and ID-related fields, e.g., Google ID. This set of properties is called excluded properties . This filtration ensures that the lexical table context is provided. We then manipulate the remaining properties in three ways, leading to three table versions. We explain these methods in the following, where a common filtration step for each property not in the excluded properties set . Multi-valued properties are converted as comma-separated fields in the generated table file. i.e., the property ‘wdt:P527 - has part(s)’ is usually given by multiple values.
We demonstrate examples entities, a set of current children (C1-C5) of a recursive call are connected with a set of properties (p1-p3) as indicated in Figure 5 (a). We keep this as a running example for the following generation methods.
-
(i)
Exclusive Selection: This version is created by column-wise stacking for all retrieved properties, for each child in the data fold . This strategy creates a large table in terms of size (rows and columns) but sparse in terms of cell content. The following Equation 2 describes this method. It creates a table with the total number of children’s properties in a data fold columns. Figure 5 (b) represents an output of this method. It keeps listing all properties without considering any importance or frequency of such properties.
(2) -
(ii)
Random Selection: This version is created by randomly dropping properties from all the created versions above using the exclusive selection. To ensure sufficient context in the resultant table, we applied another filtering step to drop a table row if it has less than two properties. Equation 3 explains this method, where it randomizes101010For reproducing the results of this method since it relies on the ‘random’ function, we set the seed to the random module to 42., dropping of the full set of properties, i.e., table columns. Figure 5 (c) represents an output of this method. It assumes that the dropped column is the first column of p1. Note that the first row representing C1 is also removed since it would be empty given only the remaining properties p2 and p3. Such an output is a reduced version in terms of table columns due to the randomized selection of these columns. It might also reduce the number of table rows due to the filter function of dropping children with less than two properties.
(3) -
(iii)
Common Selection: This version is created by grouping children in one data fold with the maximum number of shared properties. Equation 4 describes this creation method, retrieving the maximum, number of shared properties set, for all children, in a data fold . The resultant table from this method is relatively small in size but dense in cell content, i.e., the table contains no empty cells. Figure 5 (d) represents an output of this method as the intersection of all entities that share the maximum number of properties, three properties.
(4)
The five STI tasks, introduced in Section 2, are supported in the horizontal relational tables. Raw tables at this step include the solution of the supported tasks, except for CTA. We generated these solutions separately in the final step. In raw tables, we did not include a subject column; alternatively, we added a synthetic ID column. CPA targets ask for detecting properties that link that (subject) column with other (object) columns. CEA targets require annotation for object columns’ cells. We keep cell annotations for all entities as multi-valued.
4.2 Create Raw Entity Tables
The generation of this table type, entity table is more straightforward in development than in horizontal relation tables. For each child in the retrieved children per concept, we have listed its properties and have applied the general filtering function, i.e., excluding labels and IDs. Afterwards, we have saved such a child to a CSV file with an entity orientation, where an entity table should have at least two properties. Additionally, we added a common description of the parent category to all its belongings. The added long text provides an entity table with more lexical context.
The supported STI tasks for entity tables are (i) TD links the entire table to a KG entity. (ii) RA annotates a row to a single property. (iii) CEA maps a single cell that has a property value to an instance.
4.3 Refine Tables
The objective of this task is to obtain the final output of the benchmark, and it contains two steps. Raw table headers containing either the term ‘description’ or the original properties names. I.e., in properties-based generation methods, table columns represent children’s properties. We have anonymized these values by changing them to col1, col2, etc. Another indirect manipulation is renaming the header to another value. This technique requires manual effort. For example, a column with header ‘country of origin’ would be renamed to ‘originated’. Another possibility for header manipulation is to abbreviate it. For example, the same example is changed to ‘C. of Origin’ or ‘CoO’. For this task, we can also leverage a Large Language Model (LLM), e.g., GPT-4 [38] to suggest realistic abbreviated labels for a given column header.
4.4 Format Benchmark
During the raw table generation phase, we embedded the solution of STI tasks in the table itself except for CTA. For example, the original table name is the solution of TD. In addition, we created an extra column with the ground truth of the RA task. In this step, we create the final format of the benchmark. We create final tables, their solutions ‘Ground truth data (gt)’, and targets, i.e., indicate what to solve for each task. Targets are given to STI systems in case the gt data is hidden. They are used to guide these systems on what to annotate without providing the actual solutions or annotations to them. During the gt creation, we extracted solutions from the raw tables and created separate files that list the gt data with an indication of the target file, column, row, or cell. From this gt, we create the targets for the required tasks by dropping its solution column. For the CTA task, we collected cells’ annotations for columns and queried the KG for their semantic types. We collected all types with at least 50% support of the column cells. To enable a partially correct solution for CTA, we queried the ancestors and descendants for the collected types using the same technique introduced in SemTab 2020 [31]. For the CEA task, since some cells are created using multiple properties, we kept a ground truth for each individual if it exists.
5 Benchmark Generation using KG2Tables
In this section, we present, analyze, and evaluate benchmark data generated using KG2Tables. We give an overview of the generated benchmarks with a detailed evaluation of the tFood dataset using STI systems. We also provide information about the setup of KG2Tables and the challenges we faced during the creation of the large-scale benchmarks, i.e., the need for tree pruning. Finally, the release and availability of the generated artifacts are also provided.
5.1 Setup
We selected the Food, Biodiversity, and Biomedical domains as examples to generate domain-specific STI benchmarks. However, KG2Tables is not limited to these domains since it accepts any given domain concepts. We set the maximum levels of depth to 10 of the KG2Tables for the first two domains while we set it to 5 for the biomedical domain. These experiments yielded three huge datasets: tFoodL, tBiodivL, and tBiomedL.
Concepts Determination
We needed to provide KG2Tables with domain concepts for each selected domain. For the Food domain, in Wikidata, ‘food (wd:Q2095)’ had 949 instances and 2650 subclasses during the construction of the first benchmark in March 2023. Thus, it is a rich source for creating tables from it. To enable manual verification and revision and ensure quality, we limited the scope of searching for domain-related concepts to those commonly found in a typical food menu. For example, we search Wikidata for food, breakfast, lunch, dinner, drink, etc. At the end of this step, we collected 64 food-related concepts.
For the other two domains, we leveraged only CTA annotations from existing benchmarks as domain concepts. This ensures domain specificity as well. For the Biodiversity domain, we obtained the unique semantic types from BiodivTab [12]. We omitted the general domain classes from BiodivTab. For example, we removed ‘airline (wd:Q46970)’, and ‘airport (wd:Q1248784)’ to ensure domain specificity from the beginning. This resulted in 81 unique semantic types used as categories. For the Biomedical domain, we retrieved the unique semantic types from BioTables [37]. This list contains seven semantic types, including ‘protein (wd:Q8054)’ and very high-level concepts like ‘entity (wd:Q35120)’.
Data Folds & Sampling
We applied validation/test splits where the validation set includes 10% of the total number of tables. By this means, it allows training and testing for annotation systems and it becomes easier to publish them online. For those too-large benchmarks, we applied a sampling strategy, i.e., create a 1% sample of each entity and horizontal tables to be published online.
5.2 Tree Pruning and Convergence
The target KG contains different tree sizes based on the selected domain concepts. For instance, the biomedical domain contains general concepts, e.g., entity (wd:Q35120) contains millions of instances. Thus, tree pruning is needed.
Figure 6 depicts the tree we leveraged to construct tFood. It also highlights the effective depth that is included during the creation of the corresponding benchmark. tFood and tFoodL are created with 2 and 8 levels of the tree, respectively. This also indicates that constructed benchmarks contain all related data (instances and subclasses) by convergence before reaching the maximum level of depth without any tree pruning applied.
Figure 7 and Figure 8 illustrate the tree to construct both tBiodiv and tBiomed. We applied a tree-pruning technique for both benchmarks by setting the maximum number of instances/subclasses to 100. tBiomed did not converge where the maximum depth is reached even after applying tree pruning. This is due to the huge number of instances retrieved, e.g., ‘protein (Q8054)’ contains 1,002,653 instances in Wikidata as of the time of writing in November 2023. So, to construct a biomedical-specific benchmark, we set the maximum depth to 5 levels instead of 10 to yield into tBiomedL.
5.3 Benchmarks Overview
Table 1 summarizes the current state of the three experiments. tFoodL is 3x times larger than tFood by leveraging more tree levels instead of two, as in tFood. tFoodL contains all the data of the internal hierarchy of eight levels without any tree pruning. The last two levels (9 and 10) yielded no results We set the tree pruning threshold to 100 for both biodiversity and biomedical benchmarks. This threshold will limit the maximum number of instances/subclasses to be retrieved. The former, tBiodivL produced more than tables leveraging nine levels of the tree, where the last level produced no results. The latter, shown in tBiomed, failed to converge when we set the maximum level to 10; thus, we reduced the maximum depth into five levels, yielding more than tables leveraging five levels of the tree. We constructed relatively smaller-sized benchmarks for both domains using only two levels: tBiodiv and tBiomed. However, tBiodiv is still large, 122 GB in size. Both dataset folds, validation and test, are available online, but the test fold currently has no ground truth data. We plan to publish it as well by the end of 2024. We published a sample online for those datasets that were too large (as a proof of concept). This sample contains 1% of the resultant benchmark data.
Table 2 describes the existing benchmarks in terms of their domain, original data source, and target KG. Our generated benchmarks are the only domain-specific datasets that are derived from a given KG (Wikidata in this case). Table 3 shows the statistics of the state-of-the-art benchmarks compared to the horizontal tables from our generated datasets. It shows their number of tables, average rows, columns, and their coverage for STI tasks. From this table, our generated benchmarks are the only benchmarks that cover all STI tasks. In addition, they are large-scale domain-specific datasets compared to BioTables and BiodivTab. E.g., tBiomedL contains more than tables, to the best of our knowledge, this is the largest benchmark for STI tasks. This enriches the community with large-scale benchmarks that cover the entire set of STI. In addition, KG2Tables facilitates the construction of new domain-specific tabular data benchmarks since it is independent of the domain of interest and easily adapted to different underlying KGs.
| Table Statistics | Depth | |||||||
|---|---|---|---|---|---|---|---|---|
| Benchmark | Entity | Horizontal | Total | Config. | Effective | Pruning | Published | Disk Size |
| tFood | 8,492 | 4,737 | 13,229 | 2 | 2 | - | val/test | 71 MB |
| tFoodL | 23,976 | 19,279 | 43,255 | 10 | 8 | - | val | 144 MB |
| tBiodiv | 15,391 | 42,035 | 57,426 | 2 | 2 | 100 | val/test* | 122 GB |
| tBiodivL | 60,803 | 161,550 | 222,353 | 10 | 9 | 100 | sample | 312 GB |
| tBiomed | 10,567 | 16,211 | 26,778 | 2 | 2 | 100 | val/test* | 1 GB |
| tBiomedL | 310,951 | 549,528 | 860,479 | 5 | 5 | 100 | sample | 27 GB |
| Dataset | Domain | Data Source | Target Annotation |
| ST19 | General | DBpedia | DBpedia |
| ST20 | General | Wikidata | Wikidata |
| HT21-22 | General | Wikidata | Wikidata |
| WT23 | General | Wikidata | Wikidata |
| 2T | General | WebTables, DBpedia, Wikipedia | Wikidata, DBpedia |
| BioTables | Biology | Gene Ontology, Uniprot | Wikidata |
| GitTables | General | GitHub | DBpedia, Schema.org |
| T2Dv2 | General | WebTables | DBpedia |
| Limaye | General | Wikipedia | DBpedia |
| BiodivTab | Biodiversity | BExIS, BEFChina, data.world | Wikidata, DBpedia |
| tFood(L) | Food | Wikidata | Wikidata |
| tBiodiv(L) | Biodiversity | Wikidata | Wikidata |
| tBiomed(L) | Biomedical | Wikidata | Wikidata |
| Table Statistics | Target Annotations | ||||||||||||
| Dataset | KG | Tables |
|
|
CEA | CTA | CPA | RA | TD | ||||
| ST19 | D | 14,966 | 22,176 | 17,070 | NA | NA | |||||||
| ST20 | W | 131,471 | 2,930,722 | 93,483 | 236,003 | NA | NA | ||||||
| HT21 | W | 8,957 | 106,389 | 9,398 | 14,531 | NA | NA | ||||||
| HT22 | W | 8,997 | 51,587 | 9,683 | 10,366 | NA | NA | ||||||
| WT23 | W | 9,917 | 64,542 | 12,331 | 14,413 | NA | NA | ||||||
| 2T | W | 180 | 663,655 | 539 | NA | NA | NA | ||||||
| 2T | D | 180 | 636,185 | 535 | NA | NA | NA | ||||||
| BioTables | W | 110 | 1,391,324 | 656 | 546 | NA | NA | ||||||
| Git-ST21 | D | 1,101 | NA | 2,516 | NA | NA | NA | ||||||
| Git-ST21 | Sch | 1,101 | NA | 720 | NA | NA | NA | ||||||
| T2Dv2 | D | 779 | NA | NA | 670 | 26,106 | 237 | ||||||
| Limaye | D | 428 | NA | 84 | NA | NA | NA | ||||||
| BiodivTab | W | 50 | 259743 | 2413 | 33,405 | 614 | NA | NA | NA | ||||
| BiodivTab | D | 50 | 259743 | 2413 | 33,405 | 569 | NA | NA | NA | ||||
| tFood | W | 4,388 | 2387 | 66 | 249,128 | 18,578 | 35,894 | 181,210 | 4,737 | ||||
| tFoodL | W | 19,279 | 1689 | 54 | 391,867 | 35,453 | 64,148 | 288,237 | 19,279 | ||||
| tBiodiv | W | 42,035 | 2023 | 1315 | 4,975,112 | 188,008 | 467,979 | 817,230 | 42,035 | ||||
| tBiodivL | W | 161,550 | 1722 | 1011 | 8,965,006 | 543,272 | 1,337,533 | 2,537,059 | 161,550 | ||||
| tBiomed | W | 16,211 | 1725 | 88 | 556,397 | 51,229 | 107,864 | 260,990 | 16211 | ||||
| tBiomedL | W | 549,528 | 1724 | 76 | 20,010,526 | 1,518,523 | 3,041,404 | 8,835,762 | 549,528 | ||||
5.4 Generated Tables & Domain Specificity
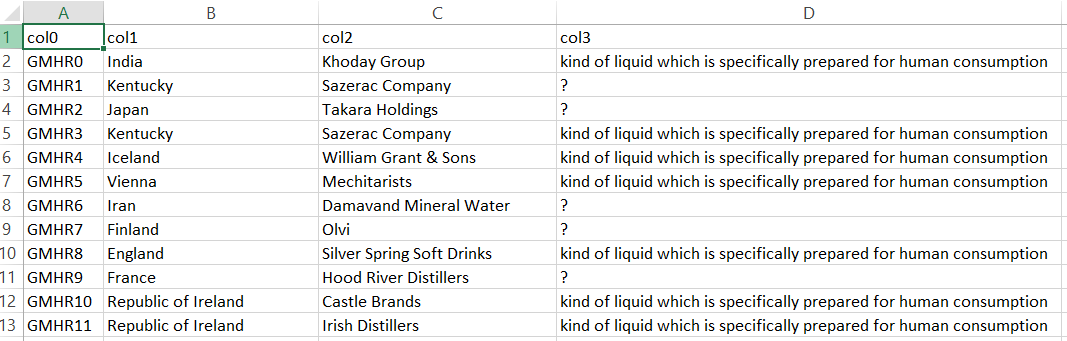
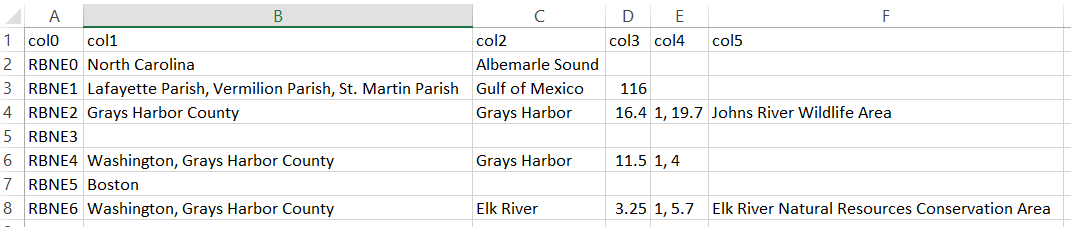
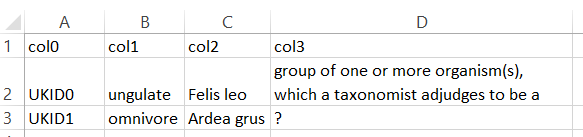
In this section, we demonstrate randomly generated tables by KG2Tables in the three domains we have experimented with to explore whether the generated tables adhere to a specific domain. Figure 12 represents a randomly tFood generated table. It contains encoding issues, e.g., in row 42, that should be solved first before systems can annotate such a table. This table groups a set of drinks (wd:Q40050). Figure 13 and Figure 14 depict random examples from tBiodiv, and tBiomed datasets, respectively. Both tables are much smaller regarding row number compared to the tFood example. The former represents a set of tidal rivers (wd:Q1074069). The latter demonstrates a set of taxons (wd:Q16521). Given the solutions of TD task as shown above, the three examples demonstrate domain specificity for each experimental domain.
5.5 tFood Detailed Evaluation
In the following, we give a statistical overview of the tFood benchmark and an evaluation of well-known STI systems participating in the 2022 and 2023 editions of SemTab and beyond.
Insights
Figure 9 depicts the distribution of the horizontal relational tables per generation method. Properties-based methods (shared properties and descriptions) yielded the most number of tables due to their high number of combinations. Figure 10 represents the distribution of the top 10 concepts used to generate entity tables via instances and subclasses, respectively. The ‘dish’ category resulted in the highest number of tables in both cases. We calculated these numbers after removing the duplicates; thus, we have unique tables. This figure proved the need to gather tables from both instances and subclasses since they provided different sets of tables.
Horizontal Tables Evaluation
To gain a first impression of the tFood benchmark, we contacted the main authors for s-elbat [20] and DAGOBAH [29] to solve the three tasks of STI (CEA, CTA, and CPA) on the horizontal tables of the tFood benchmark for comparison reasons. Additionally, we set up JenTab [11] since the primary author of this paper is one of the main developers of that system. We included the results of TSOTSA [32] and Kepler-aSI [16, 17] since they solve the three datasets. All these systems are well-established for STI and top performers in the SemTab challenge. We compare their scores with those published on HardTables and BiodivTab in 2022. Figure 11111111We omit the BiodivTab-CPA from the figure since the dataset does not support it. shows the systems’ scores using the three datasets. The highest scores by all systems come from HardTables, which is an AG and derived from the general domain. BiodivTab, a biodiversity-specific dataset, yields the second-highest scores by all systems. The lowest scores by all systems come from the proposed tFood benchmark. This shows the novel challenges the tFood dataset brings to the community on a very important domain where tool support is much needed.
Entity Tables Evaluation
We gained an insight into tFood entity tables as well through the achieved scores by SemTab 2023 participants: TorchicTab [23] and TSOTSA [32]. Table 4121212TorchicTab results are calculated after the SemTab challenge and are not published in [23, 14] demonstrates their F1-scores on the tFood entity tables test fold. Both systems achieved lower scores on tFood (CEA) compared to their performance on the general domain HardTables dataset. TorchicTab and TSOTSA lost 14.4% and 39%, respectively, from their F1 scores compared to HardTables. Such results also confirm the unique challenges of the tFood benchmark as in the horizontal tables evaluation above.
| System | CEA (HardTables) | CEA (tFood) | TD (tFood) |
|---|---|---|---|
| TorchicTab | 0.830 | 0.686 | 0.726 |
| TSOTSA | 0.627 | 0.237 | 0.156 |
5.6 Release and Availability
Resources should be easily accessible to allow replication and reuse. We follow the FAIR guidelines to publish our contributions [44]. We released KG2Tables [10]131313https://github.com/fusion-jena/KG2Tables and datasets (tFood(L) [8, 9], tBiodiv(L) [4, 5], tBiomed(L) [6, 7]) in such a way that researchers in the community can benefit from them. To reach a broader audience the tFood benchmark was integrated within the SemTab 2023 edition141414https://sem-tab-challenge.github.io/2023/. We plan to include the other datasets within SemTab 2024. Our code and datasets are released under MIT and Creative Commons Attribution 4.0 International (CC BY 4.0), respectively.
5.7 Maintenance and Update
We plan to maintain the published artifacts from this paper by uploading newer versions of the dataset to the same Zenodo repositories. We expect changes for such datasets in case of bug fixes, ground truth data modifications, targets, etc. Regarding the code, we plan to apply the same methodology of monitoring updates; we will release new code versions and upload them to Zenodo as well, while the most recent version of the code is found under our GitHub repository. In addition, we will publish a ‘change log’ that describes the changes that have been applied to a specific dataset or in the code.
Since KGs are dynamic and subject to frequent changes, we should point to a specific version or a KG dump for benchmark reproducibility and allow a fair assessment to STI systems that solve these benchmarks. Thus, we also upload specific dumps of KG, e.g., Wikidata, to Zenodo. For example, the early Wikidata dump of March 2024 [26] could be used to either reproduce the results of KG2Tables or to be used by STI systems to solve the generated benchmarks.
5.8 Data Quality Inspection
We relied on STI systems to directly solve our generated benchmarks, and we used their obtained scores as a metric to evaluate such benchmarks. However, after these experimentations, either in the early bird evaluation or in SemTab 2023 (see Section 5.5, we decided to investigate the quality of the generated tables as well.)
Since the generated benchmarks could reach up to 500K tables, inspecting the individual tables manually is impossible. Thus, to gain an overview of these benchmarks, we constructed smaller subsets using the most frequent semantic class, e.g., top CTA annotation for each of them, and re-ran the generator using a maximum depth level of two and maximum number of instances (tree pruning) is five. These subsets are summarized in Table 5 demonstrating the selected concept and validation test splits number of tables. We manually checked the validation split for each of these benchmarks, which is, in total, 30 tables with their corresponding ground truth annotations.
| Subset | Selected Concept | Val/Test |
|---|---|---|
| tBiomed | wd:Q2996394, biological process | 9/86 |
| tBiodiv | wd:Q7432, species | 9/90 |
| tFood | wd:Q746549 dish | 12/111 |
In this quality inspection experiment, we aim to evaluate these subsets concerning three dimensions of data quality: 1) Diversity of the generated data, e.g., does the generator manage to capture other related domain concepts, or does it stick to the provided domain concepts? Another aspect is comparing null annotations to the retrieved types, e.g., NILs. 2) Quality of annotations, i.e., if a required annotation is impossible to solve, it is wrongly labeled in the ground truth or too abstract and not that useful. Finally, 3) Quality of the table structure, e.g., if there are duplicate tables, rows, or columns. Table 6 summarizes these findings by showing the number of tables per subset that fulfills the abovementioned requirements.
To assess the generated topics’ diversity, we counted unique table types from the ground truth data of the TD task. While NILs represent the count of the null annotations versus the actual semantic types for CTA annotations. For this aspect, the generator found more related concepts using only two levels for both tBiomed and tFood subsets. For tBiodiv, the generator needs more levels to explore to include more diverse data. The NILs metric balances the number of null annotations and actual semantic types for the tBiomed subset. This is much better in the other two domains, where the dominant types are actual semantic classes.
To evaluate the quality of annotations, we counted the number of individual tables with wrong, abstract, or impossible annotated annotations in all STI tasks. To inspect the quality of the generated table structure, we also counted the number of individual tables that are duplicated or have duplicate columns, rows, or cells. In tBiomed and tFood subsets, we found a couple of tables listing a duplicate cell value (wd:Q16695773, ‘WikiProject’), which is considered too abstract. In tBiodiv subset, another table contains (wd:Q1239328, ‘national encyclopedia’) as a column type, CTA annotation, which is too abstract or not domain-relevant. Additionally, another table contains RA annotations for rows containing one cell value (short values, e.g., country names). Those should be removed from RA ground truth or converted to NIL. In tFood, RA annotations are also found for tables that contain only one column but with longer text, e.g., descriptions. We did not consider that as impossible to annotate as in tBiodiv since the text provides more context than short values. We extended the evaluation of the annotation quality by giving a closer look to RA and CTA ground truth data. We determined four more aspects: how many annotations belong to the general domain, a different domain, and the desired domain. In addition, we locate those that are impossible to be annotated by an STI system. Table 7 summarizes these findings for the three datasets. RA gt annotations for tBiomed and tBiomed have seven unique entities in total. In tBiomed, we found (wd:Q3, life) and treated as both domain-specific and general domain simultaneously. The rest are entities related to (wd:Q2996394, biological process) like (wd:Q11978 ,digestion). In tBiodiv, we found only one entity that is impossible to annotate since it does not have any label or description in Wikidata. The rest are entities related to (wd:Q16521, taxon) or (wd:Q7432, species). tFood has a total of 19 unique RA annotations; we found two impossible entities to annotate due to the lack of Wikidata labels. The rest are entities related to (wd:Q178, pasta), (wd:Q9266, salad), or (wd:Q746549, dish). CTA gt annotation for tBiomed and tBiodiv have three unique classes. The former has the WikiProject class, which we considered a general domain, and the latter contains a class related to Philosophy, which is a different domain from biodiversity. tFood has a total of 8 unique classes, three of which belong to the general domain like (wd:Q6256, country). The rest are subclasses of (wd:Q2095, food) or (wd:Q25403900, food ingredient).
| Diversity | Annotations | Structure | |||||||
|---|---|---|---|---|---|---|---|---|---|
| Subset | Topics | NILs | Wrong | Impossible | Abstract | Tables | Columns | Rows | Cells |
| tBiomed | 2 | 10/13 | 0 | 0 | 4 | 0 | 0 | 0 | 3 |
| tBiodiv | 1 | 0/5 | 0 | 1 | 1 | 0 | 0 | 0 | 4 |
| tFood | 3 | 2/19 | 0 | 1 | 3 | 0 | 0 | 0 | 5 |
| Subset | Unique | General Domain | Different Domain | Desired Domain | Imp. |
|---|---|---|---|---|---|
| RA gt Inspection | |||||
| tBiomed | 7 | 1 | 0 | 7 | 0 |
| tBiodiv | 7 | 0 | 0 | 7 | 1 |
| tFood | 19 | 0 | 0 | 17 | 2 |
| CTA gt Inspection | |||||
| tBiomed | 3 | 1 | 0 | 2 | 0 |
| tBiodiv | 3 | 0 | 1 | 2 | 0 |
| tFood | 8 | 3 | 0 | 5 | 0 |
5.9 Realistic Tables Assessment
In this section, we evaluate the generated tables with their annotation concerning being a realistic dataset that is possible to annotate. First, we define the metrics we use to define a realistic dataset.
-
M1: The analysis of the generated tables with their TD gt data should reflect various domain concepts and not stick to the given ones.
-
M2: The analysis of the individual rows and columns with their mappings (RA and CTA) should reflect the selected domain (probably with some classes from the general domain as well) or cannot be mapped at all (NILs).
-
M3: The ratio between the number of annotations and NILs should have a good balance.
-
M4: The analysis of the gt data for STI tasks should have NILs for records that are impossible to annotate.
-
M5: The generated tables should have no or limited duplicated rows and columns.
-
M6: The generated tables should have realistic noise. For example, column names should be anonymized or renamed with meaningful headers.
Currently, we evaluate the generated benchmarks across these metrics. We could determine some of them based on the method we developed and others we assess using the manual inspection of the generated benchmark as we did in the Quality Inspection (Subsection 5.8).
For M1, manual inspection of the generated benchmarks is needed. We provided these numbers for the generated snippets of the three domains. Table 6 showed that the generated datasets contain more topics than the initial input domain-related concepts. Despite KG2Tables parsing the input domain concepts hierarchically, this ensures that all topics and classes belong to the same parent concept, and manual inspection could help identify the relational mistakes among these concepts in the source KG itself. For instance, if we leverage DBpedia as a source KG, at the time of writing, it contains a triple dbr:Species rdf:type dbo:MilitaryUnit.
For M2-M5, all of them need manual inspection as well. The Data Quality Inspection (see above) fulfills these metrics. For M2, Table 7) demonstrated the number of entities and classes that are related to the target domain versus the general or different domain. In the three domains, the desired target domain has the dominant mappings. For M3, M4, and M5, Table 6 showed that the generated benchmarks have a good balance between NILs and true annotations for all STI tasks. Where we detected duplicates only on the cell level. However, it is still a subject of enhancement, especially for those that are impossible to annotate records in both tBiodiv and tBiomed.
For M6, we can judge this metric from the method level. We currently anonymize column headers for all generated tables, such as Col1, Col2, … etc. We also suggest using LLMs to rename these columns, providing more context to the table. Alternatively, we could abbreviate the original column headers, which provides limited context. For table cells, we do not introduce any artificial noise to the original cell content. This is unlike existing AG general domain benchmarks (SemTab’19-23 and 2T) that have excessive artificial noise in the table content, making the generated table more artificial than realistic. These metrics and their evaluation in our generated benchmark from the method level or based on the sample evaluation demonstrate that we created realistic benchmarks for the three domains of interest using KG2Tables.
6 Discussion and Limitations
In this section, we compare between KG2Tables and the existing generator, SemTab 2019. In addition, we demonstrate key characteristics and limitations of KG2Tables with a highlight of what challenges it solved and what it brought.
6.1 KG2Tables vs. SemTab 2019 Generator
Table 8 demonstrates a summary of five categories of the comparison between KG2Tables to SemTab 2019 generator approach: General aspects, generated tables types, internal structure it uses, table refinement techniques, and supported STI tasks. At first, the SemTab 2019 approach requires an entire dump of a KG, which it analyzes during the profiling step; however, it can also work off of SPARQL as well. KG2Tables, it requires an input of a list of domain-related concepts and uses SPARQL queries only to interact with KG to retrieve scoped children via recursive calls as demonstrated in Section 4. Both SemTab 2019 and KG2Tables produced large-scale benchmarks, while the latter has the largest produced tBiodivL with around half a million tables. SemTab 2019 adheres to no domain since it can process an entire KG dump; however, our approach is bounded by the scope of the provided domain concepts as in the input file. Both generators are subject to generalization and support various KGs via slight modifications. This is possible in SemTab 2019 by having a KG dump of own choice or by re-writing SPARQL queries. In KG2Tables, we need to change the configuration of the SPARQL query endpoint and re-write the SPARQL queries themselves as well. Regarding the generated table types, SemTab 2019 generates only horizontal table types, but KG2Tables generates horizontal and entity table types. The internal data structure used by SemTab 2019 generator code is the direct classes with their properties only, i.e., ‘flat’ data structure compared to KG2Tables. In the case of KG2Tables, we process the entire data hierarchy using recursive calls as a ‘tree’. A flat structure is also covered by setting the depth level to one. Concerning table refinement, KG2Tables anonymizes table columns only. However, SemTab 2019 introduces artificial noise, i.e., spelling mistakes and column anonymization. Finally, SemTab 2019 supports the three basic STI tasks: CEA, CTA, and CPA only, but KG2Tables additionally supports RA, and TD.
| Category | Aspect | SemTab 2019 | KG2Tables |
| General Aspects | Input | KG Dump+SPARQL | SPARQL |
| Specificity | General | Domain-specific | |
| Generalization | Allowed | Allowed | |
| Scale | Large | Large | |
| Table Types | Horizontal | ✓ | ✓ |
| Entity | ✗ | ✓ | |
| Internal Structure | Flat | ✓ | ✓ |
| Deep (tree) | ✗ | ✓ | |
| Table Refinement | Anonymization | ✓ | ✓ |
| Noise | ✓ | ✗ | |
| Supported STI Tasks | CEA | ✓ | ✓ |
| CTA | ✓ | ✓ | |
| CPA | ✓ | ✓ | |
| RA | ✗ | ✓ | |
| TD | ✗ | ✓ |
6.2 KG2Tables Aspects
In this section, we discuss eleven aspects of KG2Tables with an illustration of its limitations, and we point out possible solutions for them.
Data Quality for Large Scale Benchmarks
tFood brought interesting challenges due to its specificity as witnessed in the state of the art; however, the dataset might also contain errors. The root cause of them is its source KG (Wikidata currently). Wikidata could contain meaningless data (entities/properties) that are impossible to discover from a first shot running KG2Tables code (they need to be explicitly filtered from the KG or specially handled).
We have done manual data quality checks on a smaller scale of tFood, which indeed turns into a bottleneck in those larger benchmarks. However, it opens a room to investigate methodologies for checking the data quality. For example, we can develop a statistical-based analysis of the retrieved information and give insight into whether it contains enough context for disambiguation and classification. Thus, it influences our filters on what to select and what to drop to generate a more realistic dataset. Some examples have already been discovered during development, and others need further iterations. For example, wd:Q76846839, excluding the label, there is only ‘Italy’ represents the country of origin for this sandwich. Systems can not predict this specific sandwich with such limited context. Thus, during the development of KG2Tables, we iterated over filtering rules like this to be excluded from target tasks. The same applies to exclude entries with only IDs or images (URLs).
Data quality is still an open gap; we opened that call in SemTab 2024, ‘isGold?’ track151515https://sem-tab-challenge.github.io/2024/tracks/is-gold-track.html focuses on quality assessment for STI benchmarks. We invited systems from the community that were developed to derive some metrics to help judge the quality level for a given benchmark.
Ambiguous Rows
We have encountered some table examples containing identical rows, where each row is supposed to be mapped to a different entity. Although these cases may not look realistic, and some may be impossible to annotate, 1) The goal is to evaluate the annotation solutions and have real-world matching problems, so how the tables look to a human user may not be relevant. 2) real-world data sets also contain plenty of such “impossible” cases, so a realistic benchmark should also contain such cases. Nevertheless, we will extend the data generator with the option to drop impossible mappings and produce human-readable labels in the tables.
Internal Data Structure
We used the term tree to represent the retrieved instances and subclasses’ internal data structure or related concepts. Originally, such related concepts formulated graphs (as the nature of a KG allows). However, we removed duplicates between them so an instance/ a subclass is handled only once. Thus, the overall retrieved children shape a tree structure.
Depth Level
Depth levels hold two meanings: 1. the configured level where it sets a limit for the recursive method (base case). 2. effective level indicates the exact number of levels included in the benchmark. For example, in Figure 6, tFood and tFoodL have 2 and 8 as an effective level, respectively. The configured level, the max level that could be reached by the algorithm, is set to 10 in the code. Depth controls the volume of the generated tables and the granularity of the retrieved instances/subclasses, thus, the generated tables.
Domain Representation Impact
Domain representation affects the resultant benchmark in two ways. On the one hand, if insufficient entities (graph nodes) describe such a domain, it will negatively impact the number of possible generated tables. On the other hand, even if many concepts belong to such a domain but have a limited number of properties, it would negatively affect the table disambiguation context that could be used to annotate its individual components. i.e., yields many ‘Impossible to Annotated’ cases. This limitation faces all kinds of STI benchmarks generator code. In our case, domain concepts are an input to our approach. Usually, they are determined by domain experts or by a data-driven approach, not by random pick-ups. However, we encourage a kind of ‘Dry Run’ before KG2Tables usage with other domains. Dry Run could be seen as a pilot phase with, for example, a short list of domain concepts to facilitate benchmark investigation to ensure a high-quality level.
Scalability Pitfall
The scalability is bounded by the current resources/hardware, e.g., we did not manage to generate tBiomed using the full 10 levels due to memory issues and timeout from the SPARQL query live endpoint by Wikidata. A solution for this is a distributed system where individual machines solve smaller-scale tasks. In addition, the timeout could be avoided by substituting the live endpoint with a locally hosted one.
Diverse vs. Fine-grained Domain-specific Benchmarks
To capture a diverse set of related concepts for a specific domain, the initial Domain Concepts .csv (first item in Fig 3) should be carefully selected by domain experts or followed by a data-driven approach. However, the current method does not influence those concepts. Additionally, selecting the initial Domain Concepts controls the granularity of the generated benchmark. The biodiversity domain (too broad) could be split into subdomains (climate and soil). We can capture both at once or focus on a more fine-grained domain (e.g., soil).
Code Design
We selected our design to deliver a high level of reusable components. Currently, we have developed two three methodologies to create horizontal relational tables based on properties. It would be easier to change only the implementation of generate_tables procedure without affecting other parts of the code. The same applies to anonymize_tables, it would be straightforward to change the final format of the benchmark since it currently follows the format of SemTab benchmarks. Additionally, it allows for changing the KG itself as well. Concrete APIs that list properties (hold SPARQL queries) could easily be replaced. A monolithic script will do the same task, but less flexible and more error-prone. Separated micro-services (to some extent) are adopted as the most straightforward implementation for the open-closed principle by allowing for easy extension of functionality without modifying other existing code.
Larger size benchmark, does it matter?
The larger size of tables, in terms of rows and columns, is not the sole factor requiring STI systems to be efficient and potent. While an STI system may address only the first ten records of a table, this approach is often insufficient due to the inherent diversity of the data within the table. As demonstrated in the Data Quality Inspection and Realistic Table Assessment experiments (see Subsection 5.8 and Subsection 5.9), this diversity underscores the limitations of focusing solely on the top rows. To effectively handle STI tasks, a system must analyze all individual components of the table, significantly increasing the complexity of the process.
Wikidata as a Data Source & Specificity
Wikidata at the first place is a general domain KG; it does not adhere to a specific domain, so selecting representative domain concepts could be challenging in general. In addition, each domain has its own domain-specific challenges that might not appear at the final generated benchmark. For example, the biodiversity-specific benchmark BiodivTab [13] lists at least five data issues that are not common in the general domain. Thus, we recommend using domain-specific KGs available and accessible via a SPARQL query endpoint. A final decision on what to use as a source KG is based on the actual use case and project needs. In this work, since we work with demonstrative domain examples, Wikidata is a sufficient and good enough data source to generate our benchmarks.
Generalization of KG2Tables
We explore the generalization of KG2Tables along three key dimensions: 1) Changing the Knowledge Graph (KG) as a Source: The current implementation utilizes Wikidata; however, the KG2Tables methodology is based on SPARQL queries, allowing the endpoint to be substituted with an alternative KG, such as DBpedia. This approach is not inherently tied to Wikidata but relies on a series of generic queries executed against a KG using a seed signature. Furthermore, the modular code design facilitates seamless substitution of the KG. 2) Altering the Domain of Interest: In its general framework, KG2Tables accepts a customizable list of domain concepts. In this study, we defined these concepts using state-of-the-art resources or through a data-driven methodology. This process can be readily adapted, either by employing similar methods or by deferring the selection of domain concepts to domain experts. For instance, if the selected domain is “Aerospace” and Wikidata serves as the source KG, the following concepts could be used: (wd:Q11436, aircraft), (wd:Q1297322, satellite), and (wd:Q41291, rocket). Finally, 3) Modifying the Structure of the Generated Benchmark: Currently, the structure of generated benchmarks is controlled through a configuration file. Adjusting parameters such as or produces datasets with varying statistical properties. These three dimensions illustrate the flexibility of KG2Tables in generating diverse STI benchmarks, thereby enabling its application across a wide range of contexts.
6.3 Create Your Benchmark - What Does it Cost?
The out-of-the-box usage of KG2Tables is the fastest use, i.e., Wikidata is source KG. A list of domain-related concepts is the only required step. Ideas on how to select domain concepts include but are not limited to, a data-driven approach where a domain analysis is required on the KG itself, as we did in tFood construction. Another approach is reusing existing semantic classes or types for a particular domain. We adopted this approach to create tBiomed and tBiomed. Last but not least, ask domain experts to suggest domain-related concepts. KG2Tables has no limit on the number of domain-related concepts, but a non-exhaustive list is guaranteed to generate benchmarks successfully.
A recommended step before generating a benchmark is a sanity quality inspection, i.e., a lightweight activity to gain an overview of the to-be-generated benchmark, which can be tested with one or two domain-related concepts. Mertices that are important to check are the quality of both annotations and generated tables. We demonstrate such activity in Section 5.8 with a list of useful metrics to assess the data quality. This step can influence the filters applied to generate the final tables and yield high-quality benchmarks.
A customized use is also supported beyond providing domain-related concepts to KG2Tables. We expose customized input to the generator via a configuration file161616https://github.com/fusion-jena/KG2Tables/blob/main/config.py. For example, the value of the depth level and the maximum number of children per depth level are customizable. Changing these values allows exploring different data and nested concepts; if the maximum number of children is too large, KG2Tables might fail to generate the benchmark.
More advanced use of KG2Tables leverages other KGs, e.g., DBpedia or domain-specific ones. In addition to providing the target SPARQL query endpoint in the configuration file, more modifications are required to the current code version. For example, re-writing SPARQL queries that retrieve instances, subclasses, and their properties. These queries are embedded in the code itself171717https://github.com/fusion-jena/KG2Tables/blob/main/inc/api_properties.py.
6.4 KG2Tables: Impact vs. Challenges
Based on the comparison with SemTab 2019 approach and the explained aspects of KG2Tables, we summarize its impact and challenges. On the one hand, KG2Tables solved the problem of finding or crafting an STI benchmark to assess domain-specific STI system. This is brought handily and quickly by providing a list of concepts of a domain of interest. The target audience for this tool will be researchers who aim to build trusted domain-specific STI systems. Other audiences from the industry could also use it to validate their commercial tools. From our experience, STI systems evaluation using only general domain benchmarks is insufficient if such systems are supposed to be domain-specific; a critical domain example is the biomedical domain. The manual construction of these domain-specific benchmarks, usually small in scale, costs an average of a year of development, e.g., BiodivTab [12, 13]. KG2Tables generated realistic datasets as we defined in Subsection 5.9. For example, the constructed benchmarks add no artificial noise to the cell content. In addition, KG2Tables relies purely on SPARQL queries to construct STI benchmarks, making it easily adapted to any other KG. It can also generate various benchmarks with different parameters, such as the maximum depth at which the approach can go deep. On the other hand, the current version of KG2Tables brought new challenges to the STI benchmarks creation. Generally, the output benchmarks from the KG2Tables approach are silver-standard, which is less in quality than those manually created or gold-standard. For example, the ambiguous rows we detected in a later stage of KG2Tables development. This requires a sort of systematic approach to ensure high-quality data. We explained a sample-based method to ensure data quality in Subsection 5.8 with quality metrics in Table 6 and Table 7. In addition, KG2Tables is sensitive to the domain representation in the source KG. If the target domain has limited entities and classes, then the resultant benchmark will lack a dense representation of such a domain. Moreover, KG2Tables is bounded by the selected resources of the hardware and the timeout errors from the SPARQL endpoint. Such scalability issues we experienced in the construction of tBiodivL.
7 Conclusion and Future Work
In this paper, we introduced KG2Tables, a generator code that constructs domain-specific tabular data benchmarks for Semantic Table Interpretation (STI) tasks. It recursively leverages the internal hierarchy of the given related concepts in the target Knowledge Graph (KG) to construct two types of tables: horizontal and entity tables. It also covers five STI tasks commonly used in the state of the art. We tested KG2Tables with three domains of interest: Food, Biodiversity, and Biomedical. We managed to construct two variations of each domain of interest by leveraging different depths of the internal hierarchy of each domain-related concept. Our experiments yielded six large-scale domain-specific benchmarks with over half a million tables. In addition, we gave insights about the generated benchmarks and showed the challenges that come up with them. We included a detailed evaluation of one of our benchmarks, tFood, using the state-of-the-art STI systems. We conducted a systematic data quality inspection experiment on three subsets of the constructed benchmarks, showing the current quality level and pointing out issues as well.
Currently, we manually selected the related domain concepts from a target KG or by re-using existing semantic types provided in the state of the art. We plan to investigate the automatic discovery of the related concepts given only one category. We released our generated benchmarks in CSV format only; we plan to support the generation of RDF data to enable the evaluation of ontology matching tools from a different perspective. Since we perform a sample-based method for the quality inspection, we plan to explore the generalization, i.e., leveraging other KGs like DBpedia or other domain-specific ones. Last but not least, we aim to explore more systematic ways for data quality inspection on a larger scale of benchmarks, e.g., those with hundreds of thousands of tables.
References
- [1] Nora Abdelmageed, Jiaoyan Chen, Vincenzo Cutrona, Vasilis Efthymiou, Oktie Hassanzadeh, Madelon Hulsebos, Ernesto Jiménez-Ruiz, Juan Sequeda, and Kavitha Srinivas. Results of SemTab 2022. In Proceedings of the Semantic Web Challenge on Tabular Data to Knowledge Graph Matching co-located with the 21st International Semantic Web Conference (ISWC 2022)., volume 3320 of CEUR Workshop Proceedings, pages 1–13. CEUR-WS.org, 2022. URL: https://ceur-ws.org/Vol-3320/paper0.pdf.
- [2] Nora Abdelmageed, Ernesto Jiménez-Ruiz, Oktie Hassanzadeh, and Birgitta König-Ries. KG2Tables. Software (visited on 2025-03-25). URL: https://github.com/fusion-jena/KG2Tables, doi:10.4230/artifacts.22938.
- [3] Nora Abdelmageed, Ernesto Jiménez-Ruiz, Oktie Hassanzadeh, and Birgitta König-Ries. Kg2tables: Your way to generate an STI benchmark for your domain. In Lorena Etcheverry, Vanessa López Garcia, Francesco Osborne, and Romana Pernisch, editors, Proceedings of the ISWC 2024 Posters, Demos and Industry Tracks: From Novel Ideas to Industrial Practice co-located with 23nd International Semantic Web Conference (ISWC 2024), Hanover, Maryland, USA, November 11-15, 2024, volume 3828 of CEUR Workshop Proceedings. CEUR-WS.org, 2024. URL: https://ceur-ws.org/Vol-3828/paper14.pdf.
- [4] Nora Abdelmageed, Ernesto Jiménez-Ruiz, Oktie Hassanzadeh, and Birgitta König-Ries. tBiodiv: Semantic Table Annotations Benchmark for the Biodiversity Domain, December 2023. doi:10.5281/zenodo.10283015.
- [5] Nora Abdelmageed, Ernesto Jiménez-Ruiz, Oktie Hassanzadeh, and Birgitta König-Ries. tBiodivL: Larger Semantic Table Annotations Benchmark for the Biodiversity Domain, December 2023. doi:10.5281/zenodo.10283083.
- [6] Nora Abdelmageed, Ernesto Jiménez-Ruiz, Oktie Hassanzadeh, and Birgitta König-Ries. tBiodmed: Semantic Table Annotations Benchmark for the Biomedical Domain, December 2023. doi:10.5281/zenodo.10283103.
- [7] Nora Abdelmageed, Ernesto Jiménez-Ruiz, Oktie Hassanzadeh, and Birgitta König-Ries. tBiodmedL: Larger Semantic Table Annotations Benchmark for the Biomedical Domain, December 2023. doi:10.5281/zenodo.10283119.
- [8] Nora Abdelmageed, Ernesto Jiménez-Ruiz, Oktie Hassanzadeh, and Birgitta König-Ries. tFood: Semantic Table Annotations Benchmark for Food Domain, October 2023. doi:10.5281/zenodo.10048187.
- [9] Nora Abdelmageed, Ernesto Jiménez-Ruiz, Oktie Hassanzadeh, and Birgitta König-Ries. tFoodL: Larger Semantic Table Annotations Benchmark for Food Domain, December 2023. doi:10.5281/zenodo.10277790.
- [10] Nora Abdelmageed, Ernesto Jimènez-Ruiz, Oktie Hassanzadeh, and Birgitta König-Ries. KG2Tables: Semantic Table Interpretation Benchmarks Generator Code, December 2023. doi:10.5281/zenodo.10285835.
- [11] Nora Abdelmageed and Sirko Schindler. Jentab: Do CTA solutions affect the entire scores? In Proceedings of the Semantic Web Challenge on Tabular Data to Knowledge Graph Matching, SemTab 2021, co-located with the 21st International Semantic Web Conference, ISWC 2022, Virtual conference, October 23-27, 2022, volume 3320 of CEUR Workshop Proceedings, pages 72–79. CEUR-WS.org, 2022. URL: https://ceur-ws.org/Vol-3320/paper8.pdf.
- [12] Nora Abdelmageed, Sirko Schindler, and Birgitta König-Ries. Biodivtab: A table annotation benchmark based on biodiversity research data. In Proceedings of the Semantic Web Challenge on Tabular Data to Knowledge Graph Matching co-located with the 20th International Semantic Web Conference (ISWC 2021), Virtual conference, October 27, 2021, volume 3103 of CEUR Workshop Proceedings, pages 13–18. CEUR-WS.org, 2021. URL: https://ceur-ws.org/Vol-3103/paper1.pdf.
- [13] Nora Abdelmageed, Sirko Schindler, and Birgitta König-Ries. Biodivtab: semantic table annotation benchmark construction, analysis, and new additions. In Proceedings of the 17th International Workshop on Ontology Matching (OM 2022) co-located with the 21th International Semantic Web Conference (ISWC 2022), Hangzhou, China, held as a virtual conference, October 23, 2022, volume 3324, pages 37–48. CEUR-WS.org, 2022. URL: https://ceur-ws.org/Vol-3324/om2022_LTpaper4.pdf.
- [14] Oktie Hassanzadeh Nora Abdelmageed, Jiaoyan Chen, Vincenzo Cutrona, Vasilis Efthymiou, Madelon Hulsebos, Ernesto Jiménez-Ruiz, Aamod Khatiwada, Keti Korini, Benno Kruit, Juan Sequeda, and Kavitha Srinivas. Results of SemTab 2023. In Proceedings of the Semantic Web Challenge on Tabular Data to Knowledge Graph Matching co-located with the 22nd International Semantic Web Conference (ISWC 2023)., volume 3557 of CEUR Workshop Proceedings, pages 1–14. CEUR-WS.org, 2023. URL: https://ceur-ws.org/Vol-3557/paper0.pdf.
- [15] Sören Auer, Christian Bizer, Georgi Kobilarov, Jens Lehmann, Richard Cyganiak, and Zachary Ives. Dbpedia: A nucleus for a web of open data. In The Semantic Web: 6th International Semantic Web Conference, 2nd Asian Semantic Web Conference, ISWC 2007+ ASWC 2007, Busan, Korea, November 11-15, 2007. Proceedings, pages 722–735. Springer, 2007. doi:10.1007/978-3-540-76298-0_52.
- [16] Wiem Baazouzi, Marouen Kachroudi, and Sami Faïz. Yet Another Milestone for Kepler-aSI at SemTab 2022. In Proceedings of the Semantic Web Challenge on Tabular Data to Knowledge Graph Matching, SemTab 2022, co-located with the 21st International Semantic Web Conference, ISWC 2022, Virtual conference, October 23-27, 2022, volume 3320, pages 80–91. CEUR-WS.org, 2022. URL: https://ceur-ws.org/Vol-3320/paper9.pdf.
- [17] Wiem Baazouzi, Marouen Kachroudi, and Sami Faïz. Kepler-aSI at SemTab 2023. In Proceedings of the Semantic Web Challenge on Tabular Data to Knowledge Graph Matching co-located with the 22nd International Semantic Web Conference (ISWC 2023)., volume 3557, pages 85–91, 2023. URL: https://ceur-ws.org/Vol-3557/paper7.pdf.
- [18] Chandra Sekhar Bhagavatula, Thanapon Noraset, and Doug Downey. TabEL: Entity Linking in Web Tables. In The Semantic Web - ISWC 2015 - 14th International Semantic Web Conference, Bethlehem, PA, USA, October 11-15, 2015, Proceedings, Part I, volume 9366 of Lecture Notes in Computer Science, pages 425–441. Springer, 2015. doi:10.1007/978-3-319-25007-6_25.
- [19] Michael J. Cafarella, Alon Y. Halevy, Daisy Zhe Wang, Eugene Wu, and Yang Zhang. WebTables: exploring the power of tables on the web. Proc. VLDB Endow., 1(1):538–549, 2008. doi:10.14778/1453856.1453916.
- [20] Marco Cremaschi, Roberto Avogadro, and David Chieregato. s-elbat: A semantic interpretation approach for messy table-s. In Proceedings of the Semantic Web Challenge on Tabular Data to Knowledge Graph Matching, SemTab 2021, co-located with the 21st International Semantic Web Conference, ISWC 2022, Virtual conference, October 23-27, 2022, volume 3320 of CEUR Workshop Proceedings, pages 59–71. CEUR-WS.org, 2022. URL: https://ceur-ws.org/Vol-3320/paper7.pdf.
- [21] Vincenzo Cutrona, Federico Bianchi, Ernesto Jiménez-Ruiz, and Matteo Palmonari. Tough Tables: Carefully Evaluating Entity Linking for Tabular Data. In 19th International Semantic Web Conference (ISWC), pages 328–343, 2020. doi:10.1007/978-3-030-62466-8_21.
- [22] Vincenzo Cutrona, Jiaoyan Chen, Vasilis Efthymiou, Oktie Hassanzadeh, Ernesto Jiménez-Ruiz, Juan Sequeda, Kavitha Srinivas, Nora Abdelmageed, Madelon Hulsebos, Daniela Oliveira, and Catia Pesquita. Results of SemTab 2021. In Proceedings of the Semantic Web Challenge on Tabular Data to Knowledge Graph Matching co-located with the 20th International Semantic Web Conference (ISWC 2021), Virtual conference, October 27, 2021, volume 3103 of CEUR Workshop Proceedings, pages 1–12. CEUR-WS.org, 2021. URL: https://ceur-ws.org/Vol-3103/paper0.pdf.
- [23] Ioannis Dasoulas, Duo Yang, Xuemin Duan, and Anastasia Dimou. TorchicTab: Semantic Table Annotation with Wikidata and Language Models. In Proceedings of the Semantic Web Challenge on Tabular Data to Knowledge Graph Matching co-located with the 22nd International Semantic Web Conference (ISWC 2023)., volume 3557 of CEUR Workshop Proceedings, pages 21–37. CEUR-WS.org, 2023. URL: https://ceur-ws.org/Vol-3557/paper2.pdf.
- [24] Vasilis Efthymiou, Oktie Hassanzadeh, Mariano Rodriguez-Muro, and Vassilis Christophides. Matching Web Tables with Knowledge Base Entities: From Entity Lookups to Entity Embeddings. In The Semantic Web - ISWC 2017 - 16th International Semantic Web Conference, Vienna, Austria, October 21-25, 2017, Proceedings, Part I, volume 10587 of Lecture Notes in Computer Science, pages 260–277. Springer, 2017. doi:10.1007/978-3-319-68288-4_16.
- [25] R. V. Guha, Dan Brickley, and Steve MacBeth. Schema.org: Evolution of structured data on the web: Big data makes common schemas even more necessary. Queue, 13(9):10–37, 2015. doi:10.1145/2857274.2857276.
- [26] Oktie Hassanzadeh. Wikidata truthy dump from march 20, 2024, July 2024. doi:10.5281/zenodo.12588085.
- [27] Madelon Hulsebos, Çagatay Demiralp, and Paul Groth. GitTables: A Large-Scale Corpus of Relational Tables. CoRR, abs/2106.07258, 2021. arXiv:2106.07258.
- [28] Madelon Hulsebos, Çağatay Demiralp, and Paul Demiralp. GitTables for SemTab 2021 - CTA task, November 2021. doi:10.5281/zenodo.5706316.
- [29] Viet-Phi Huynh, Yoan Chabot, Thomas Labbé, Jixiong Liu, and Raphaël Troncy. From heuristics to language models: A journey through the universe of semantic table interpretation with DAGOBAH. In Proceedings of the Semantic Web Challenge on Tabular Data to Knowledge Graph Matching, SemTab 2021, co-located with the 21st International Semantic Web Conference, ISWC 2022, Virtual conference, October 23-27, 2022, volume 3320 of CEUR Workshop Proceedings, pages 45–58. CEUR-WS.org, 2022. URL: https://ceur-ws.org/Vol-3320/paper6.pdf.
- [30] Ernesto Jiménez-Ruiz, Oktie Hassanzadeh, Vasilis Efthymiou, Jiaoyan Chen, and Kavitha Srinivas. Semtab 2019: Resources to benchmark tabular data to knowledge graph matching systems. In The Semantic Web - 17th International Conference, ESWC 2020, Heraklion, Crete, Greece, May 31-June 4, 2020, Proceedings, pages 514–530. Springer, 2020. doi:10.1007/978-3-030-49461-2_30.
- [31] Ernesto Jiménez-Ruiz, Oktie Hassanzadeh, Vasilis Efthymiou, Jiaoyan Chen, Kavitha Srinivas, and Vincenzo Cutrona. Results of semtab 2020. In Proceedings of the Semantic Web Challenge on Tabular Data to Knowledge Graph Matching (SemTab 2020) co-located with the 19th International Semantic Web Conference (ISWC 2020), Virtual conference (originally planned to be in Athens, Greece), November 5, 2020, volume 2775 of CEUR Workshop Proceedings, pages 1–8. CEUR-WS.org, 2020. URL: https://ceur-ws.org/Vol-2775/paper0.pdf.
- [32] Azanzi Jiomekong and Brice Foko. Exploring naive bayes classifiers for tabular data to knowledge graph matching. In Proceedings of the Semantic Web Challenge on Tabular Data to Knowledge Graph Matching co-located with the 22nd International Semantic Web Conference (ISWC 2023)., volume 3557, pages 72–84, 2023. URL: https://ceur-ws.org/Vol-3557/paper6.pdf.
- [33] Oliver Lehmberg, Dominique Ritze, Robert Meusel, and Christian Bizer. A Large Public Corpus of Web Tables containing Time and Context Metadata. In Proceedings of the 25th International Conference on World Wide Web, WWW 2016, Montreal, Canada, April 11-15, 2016, Companion Volume, pages 75–76. ACM, 2016. doi:10.1145/2872518.2889386.
- [34] Girija Limaye, Sunita Sarawagi, and Soumen Chakrabarti. Annotating and Searching Web Tables Using Entities, Types and Relationships. Proc. VLDB Endow., 3(1):1338–1347, 2010. doi:10.14778/1920841.1921005.
- [35] Jixiong Liu, Yoan Chabot, Raphaël Troncy, Viet-Phi Huynh, Thomas Labbé, and Pierre Monnin. From tabular data to knowledge graphs: A survey of semantic table interpretation tasks and methods. Journal of Web Semantics, page 100761, 2022.
- [36] Varish Mulwad, Tim Finin, and Anupam Joshi. Semantic Message Passing for Generating Linked Data from Tables. In The Semantic Web - ISWC 2013 - 12th International Semantic Web Conference, Sydney, NSW, Australia, October 21-25, 2013, Proceedings, Part I, volume 8218 of Lecture Notes in Computer Science, pages 363–378. Springer, 2013. doi:10.1007/978-3-642-41335-3_23.
- [37] Daniela Oliveira and Catia Pesquita. Semtab 2021 biotable dataset, October 2021. doi:10.5281/zenodo.5606585.
- [38] OpenAI. GPT-4 technical report. CoRR, abs/2303.08774, 2023. doi:10.48550/arXiv.2303.08774.
- [39] Gerald Penn, Jianying Hu, Hengbin Luo, and Ryan T. McDonald. Flexible Web Document Analysis for Delivery to Narrow-Bandwidth Devices. In 6th International Conference on Document Analysis and Recognition (ICDAR 2001), 10-13 September 2001, Seattle, WA, USA, pages 1074–1078. IEEE Computer Society, 2001. doi:10.1109/ICDAR.2001.953951.
- [40] Dominique Ritze, Oliver Lehmberg, and Christian Bizer. Matching HTML Tables to DBpedia. In Proceedings of the 5th International Conference on Web Intelligence, Mining and Semantics, WIMS 2015, Larnaca, Cyprus, July 13-15, 2015, pages 10:1–10:6. ACM, 2015. doi:10.1145/2797115.2797118.
- [41] Denny Vrandečić and Markus Krötzsch. Wikidata: A free collaborative knowledgebase. Commun. ACM, 57(10):78–85, September 2014. doi:10.1145/2629489.
- [42] Brend Wanders. Repurposing and probabilistic integration of data. SIKS dissertation series, Universiteit Twente, June 2016. isbn:978-90-365-4110-7, number:2016-24.
- [43] Yalin Wang and Jianying Hu. Detecting tables in HTML documents. In Document Analysis Systems V, 5th International Workshop, DAS 2002, Princeton, NJ, USA, August 19-21, 2002, Proceedings, volume 2423 of Lecture Notes in Computer Science, pages 249–260. Springer, 2002. doi:10.1007/3-540-45869-7_29.
- [44] Mark D Wilkinson, Michel Dumontier, IJsbrand Jan Aalbersberg, Gabrielle Appleton, Myles Axton, Arie Baak, Niklas Blomberg, Jan-Willem Boiten, Luiz Bonino da Silva Santos, Philip E Bourne, et al. The fair guiding principles for scientific data management and stewardship. Scientific data, 3, 2016. doi:10.1038/sdata.2016.18.